
Between 22 and 25 September 2026, a frontal system linked to an atmospheric river and an unusually high freezing level affected south-central Chile. This combination extended the area exposed to liquid precipitation farther into the Andes, over catchments that had already experienced a wetter-than-normal September. The worst disruption stretched from southern Biobío to Los Ríos: Red Alerts for overflowing rivers, SAE evacuation messages, several days of isolation in Curarrehue and widespread road closures 1 2 3 4 .
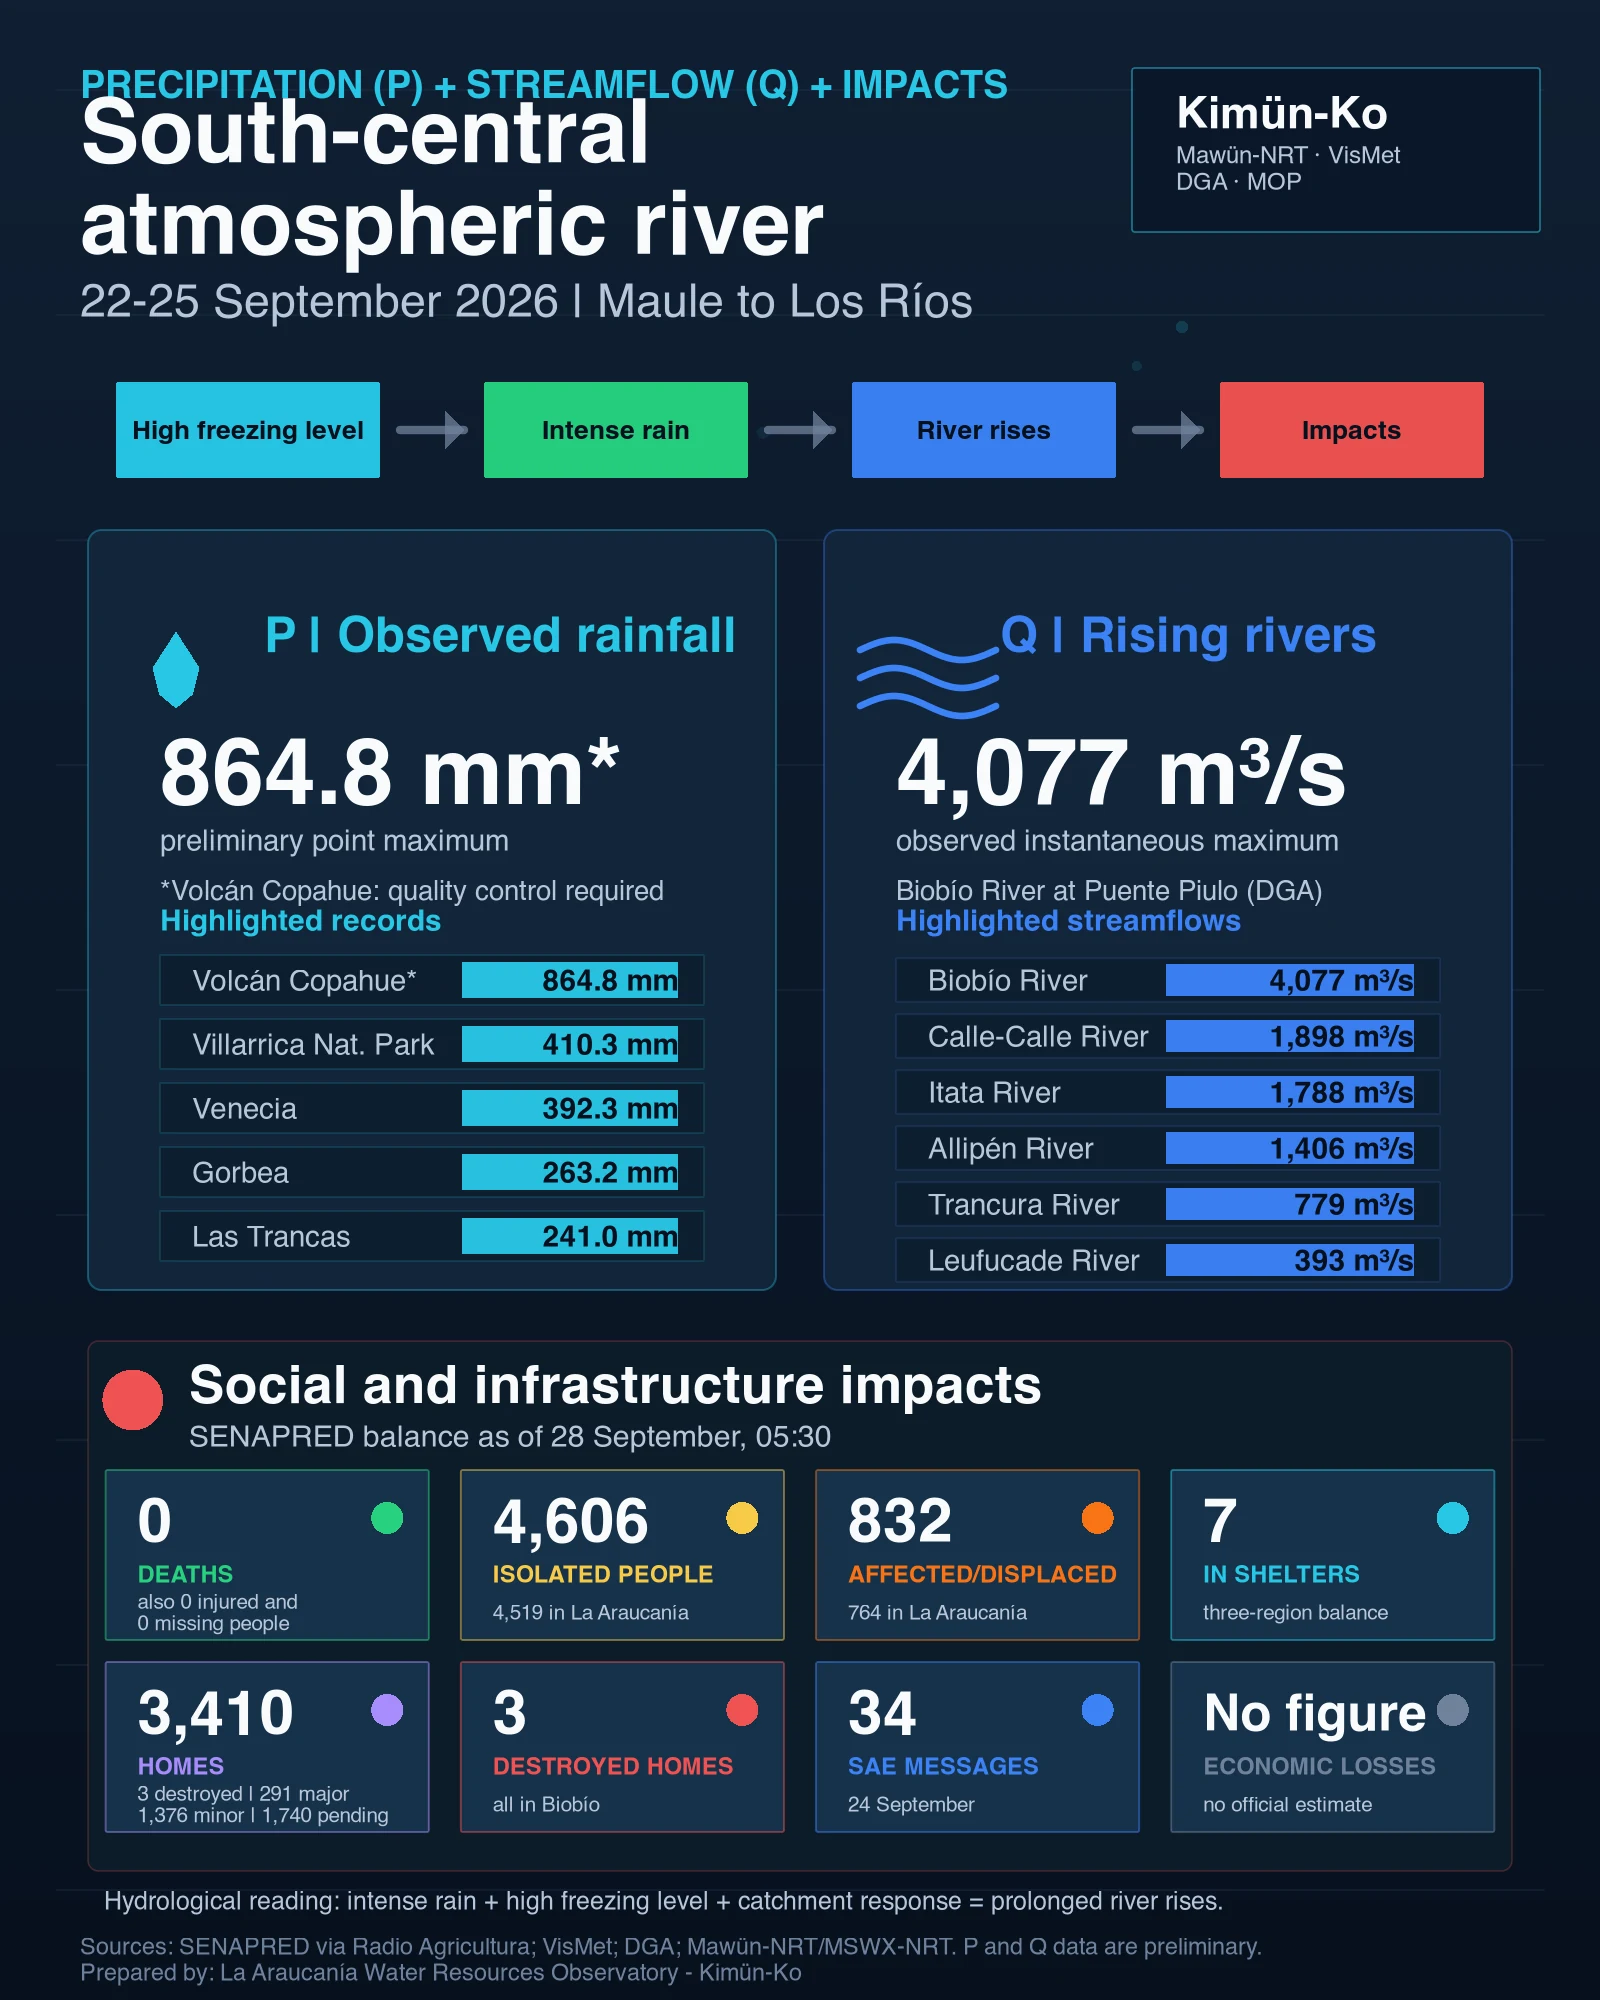
The latest detailed numerical balance located for this event, compiled from SENAPRED regional directorate information as of 05:30 on 28 September, recorded no deaths, injuries or missing people, 832 affected or displaced people (damnificados), 7 people in shelters and 4,606 isolated people across Biobío, La Araucanía and Los Ríos. It also counted 3 destroyed homes, 291 with major damage, 1,376 with minor damage and 1,740 still under assessment 5 . SENAPRED formally closed its event monitoring at 22:39 that evening 3 . The agency had issued 34 SAE messages on 24 September: 15 in La Araucanía, 15 in Biobío and 4 in Los Ríos 4 .
The public balance does not provide an official monetary estimate of economic losses. This article therefore keeps measured social, housing and connectivity impacts separate from financial damage, which would require later sector-by-sector assessments.
Infographic: the event in numbers
Key facts
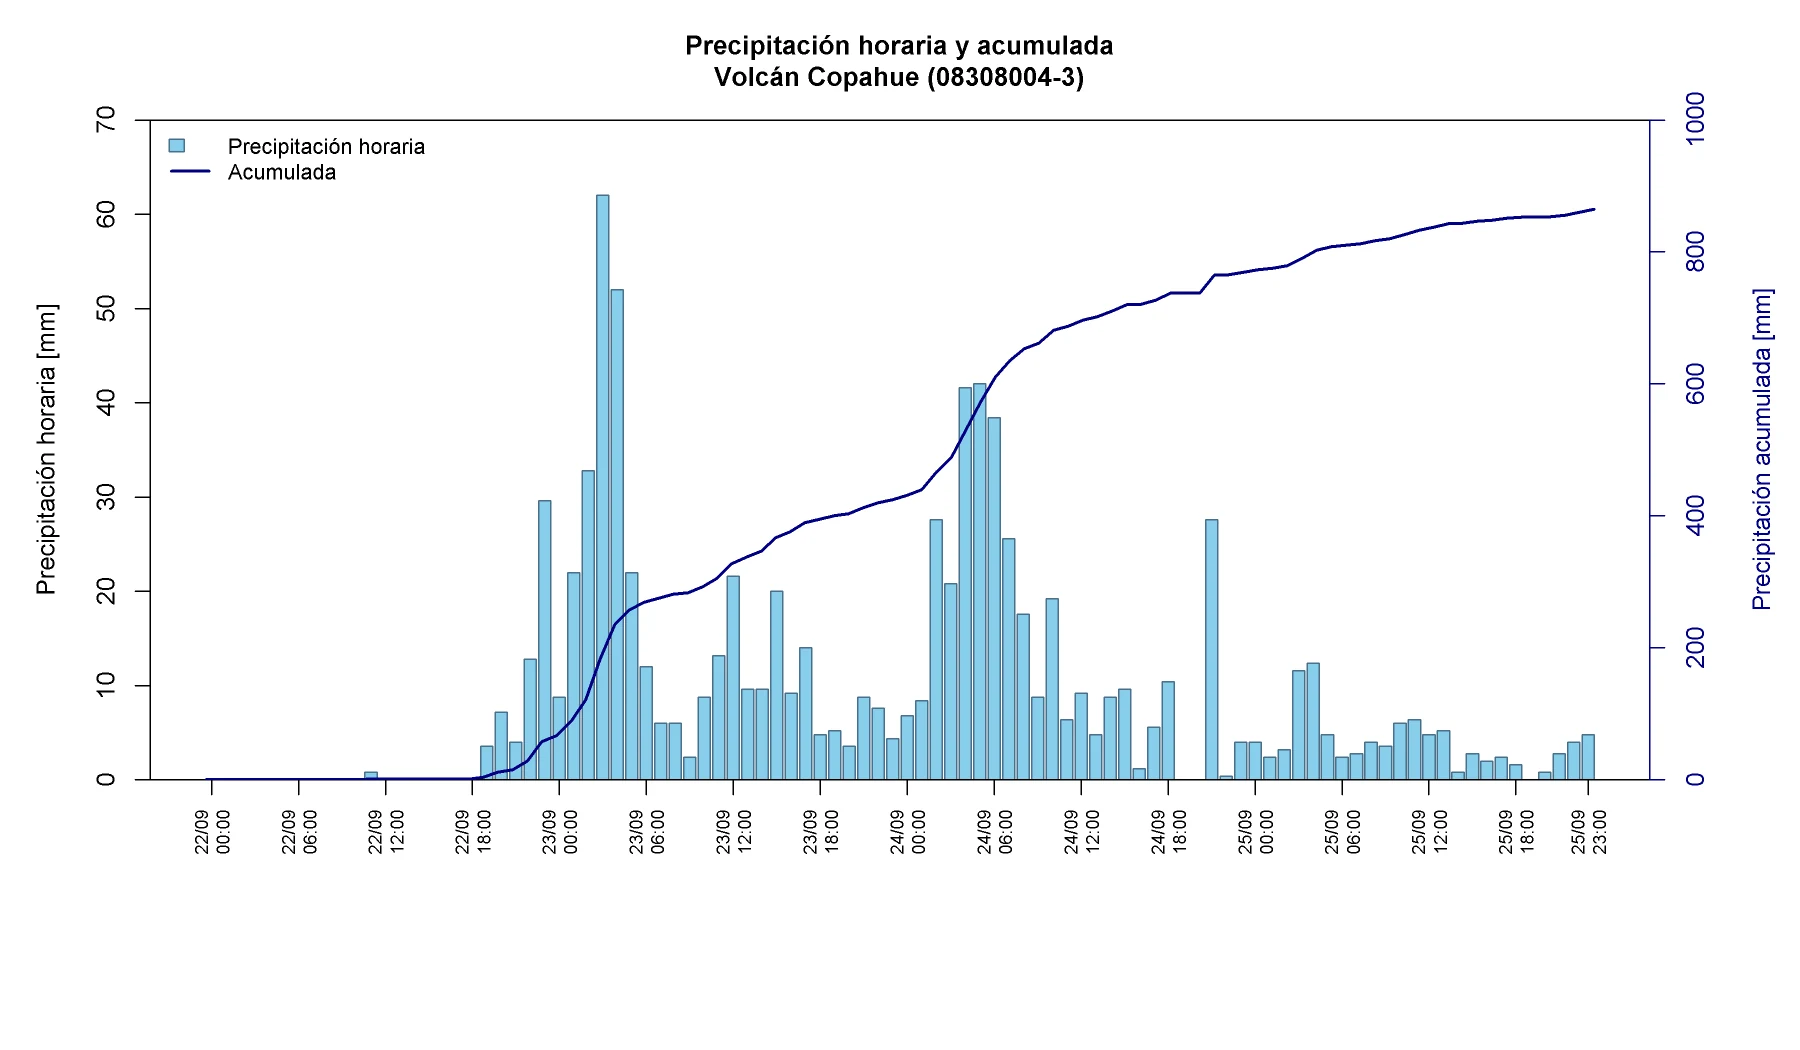
- P — precipitation: 864.8 mm at Volcán Copahue, the highest point total among the highlighted hourly records. Because this is an extreme high-mountain value, it should remain provisional until quality control is complete. In populated areas, Gorbea recorded 263.2 mm and Valdivia-Isla Teja 220.1 mm.
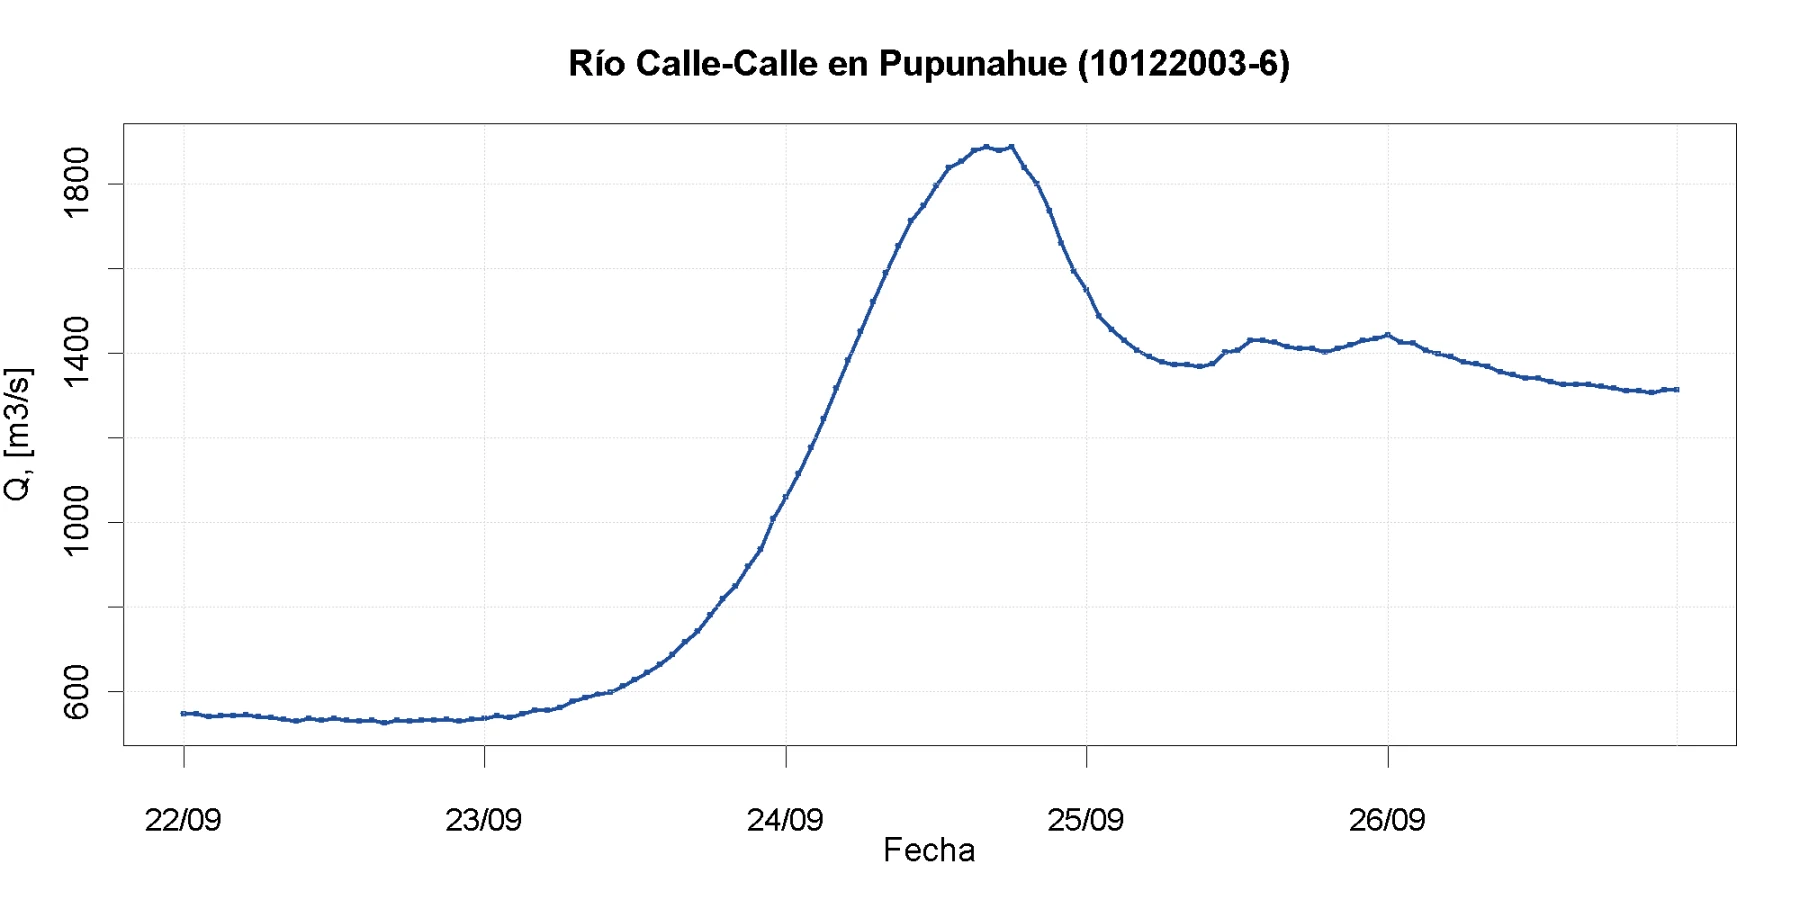
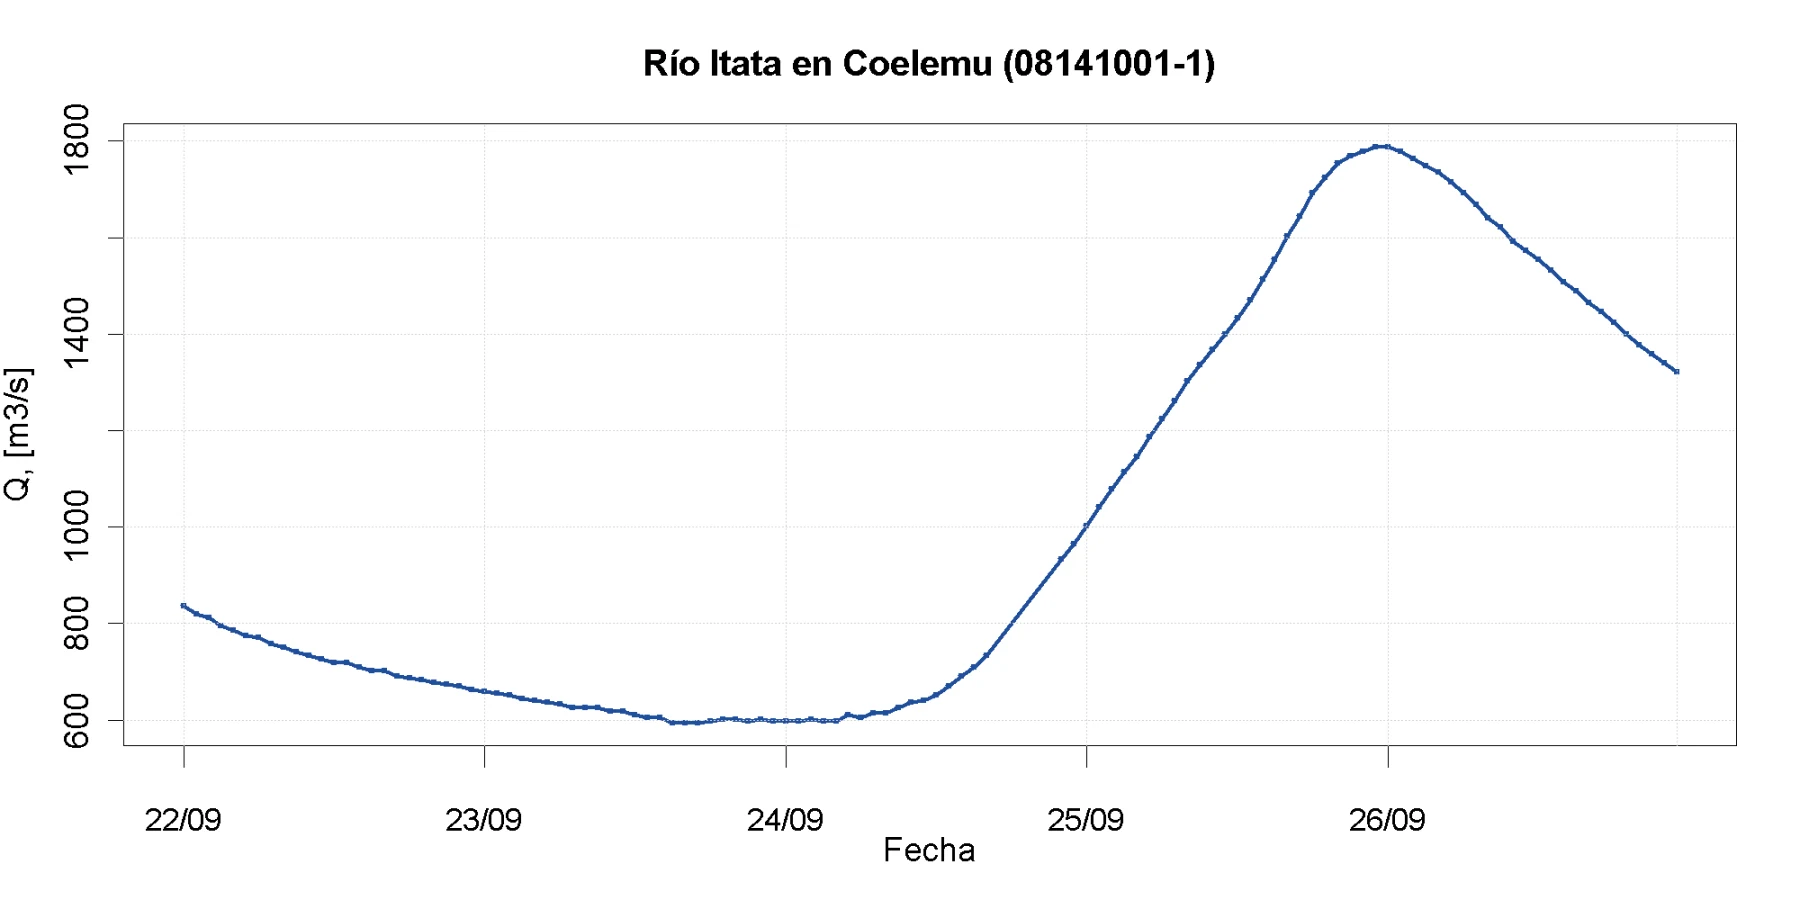
- Q — streamflow: 4,077.2 m³/s in the Biobío River at Puente Piulo, 1,897.7 m³/s in the Calle-Calle River at Pupunahue, and 1,787.8 m³/s in the Itata River at Coelemu. These are maxima at specific gauges, not universal flood thresholds.
- Impacts: no deaths, injuries or missing people; 832 affected or displaced people; 7 in shelters; 4,606 isolated; and 3,410 homes destroyed, damaged or awaiting assessment 5 .
- Economic damage: no official monetary estimate was included in the latest public balance located for this event.
Contents
- Why the high freezing level mattered
- La Araucanía Region
- Los Ríos Region
- Biobío Region
- Ñuble Region
- Maule Region
- Connecting the river records to reported impacts
- Hydrological interpretation
- Frequently asked questions
- Public-safety recommendations
- Sources
Why the high freezing level mattered
On 22 September, SENAPRED convened a technical coordination meeting after the Chilean Meteorological Directorate forecast a frontal band coupled with an atmospheric river. The warning covered heavy precipitation and strong winds on 23-24 September, including intense rainfall with a high freezing level in La Araucanía, Los Ríos and Los Lagos 1 .
The forecast freezing level reached about 2,800 m in La Araucanía and 2,600 m in Los Ríos on 23 September 2 . A high freezing level does not prove that all mountain snow melted, or that rain fell at every elevation. It does mean that the layer of above-freezing air reached higher into the mountains, allowing a larger area to receive rain instead of snow. Liquid water can reach hillslopes and channels faster; where it falls on mature snow, it may also add snowmelt. Quantifying those separate contributions would require air temperature, snow-water equivalent and catchment-average precipitation, which are not available in this analysis.
La Araucanía Region
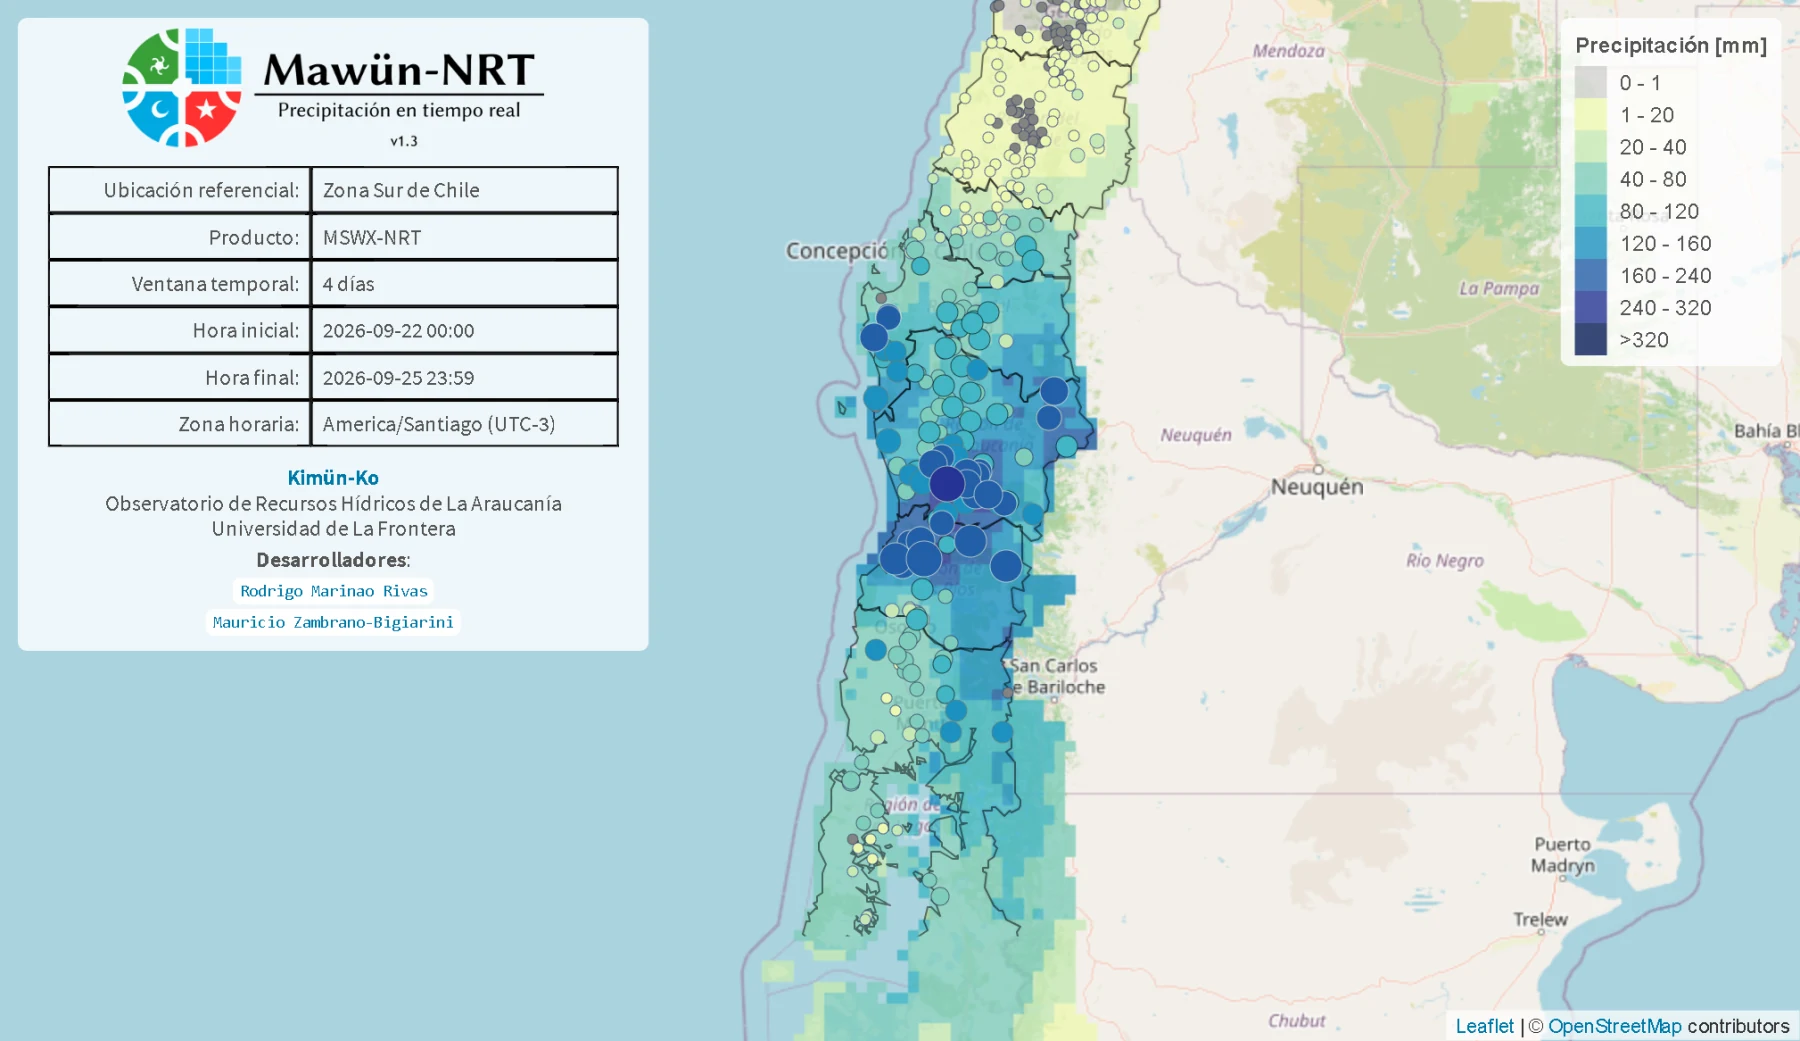
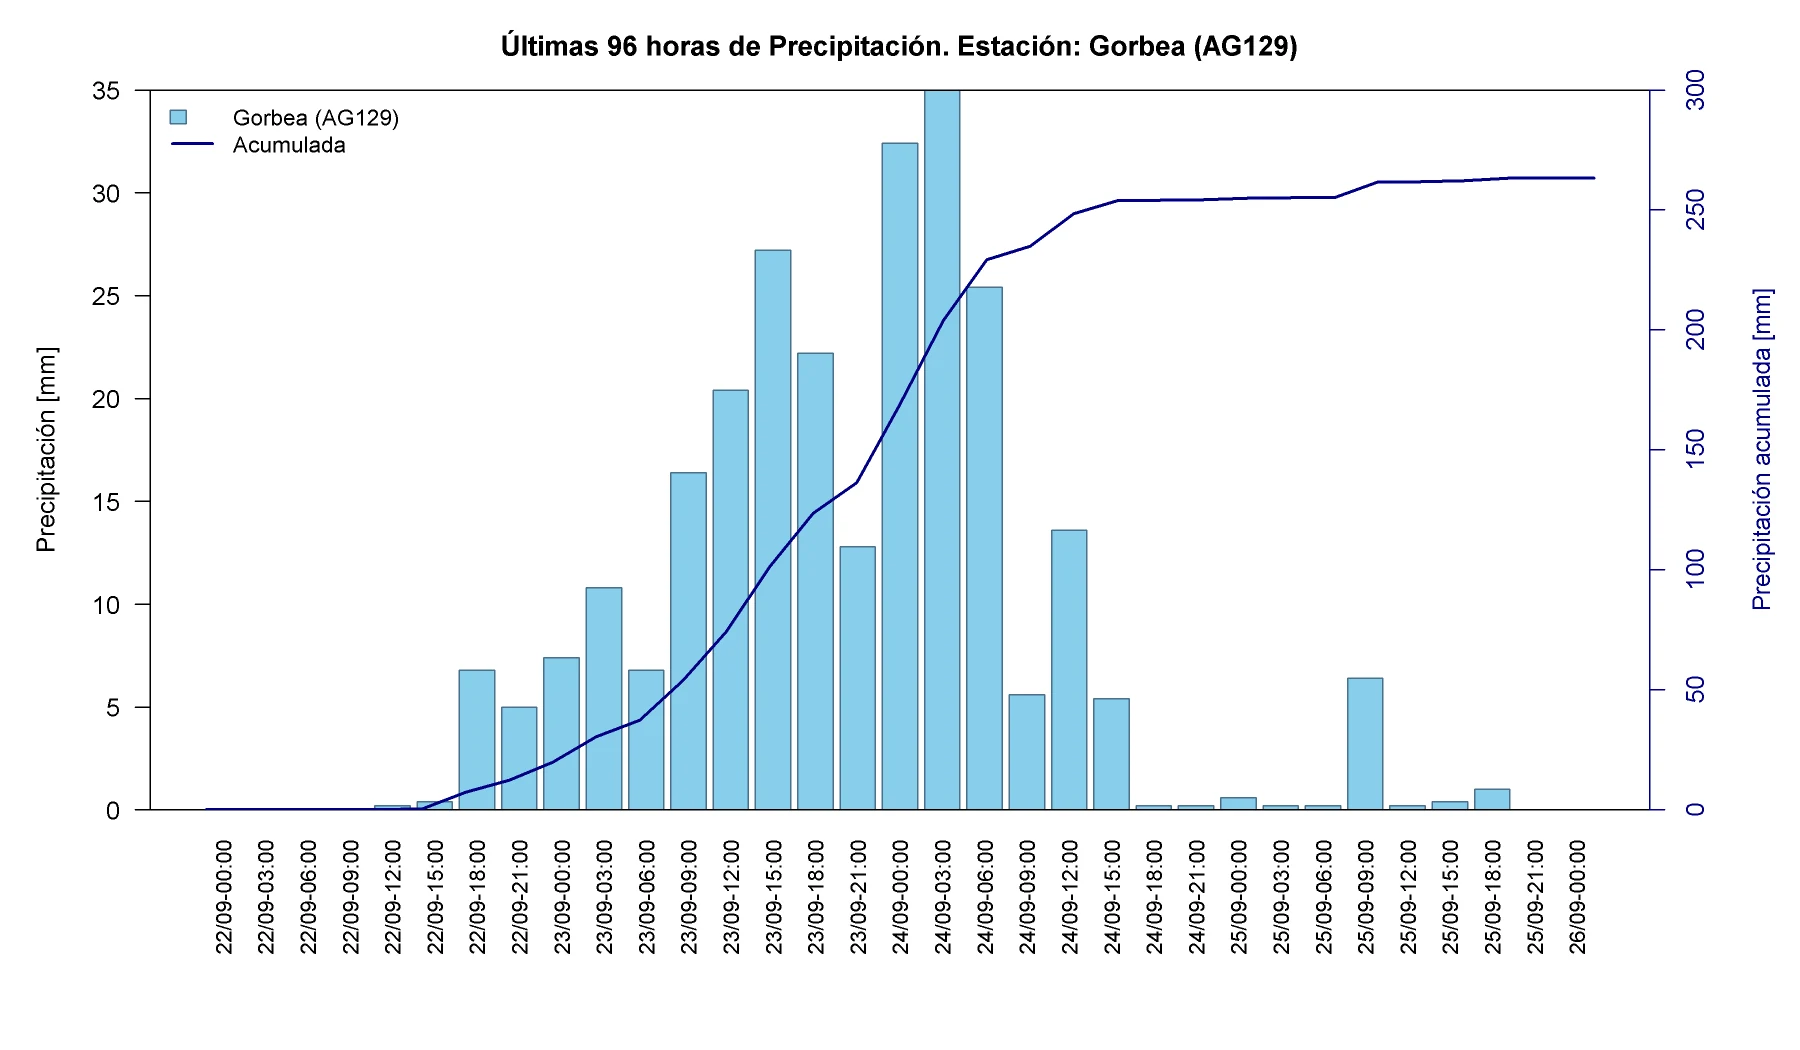
Among the 63 gauges included in the regional table, 27 recorded at least 100 mm and 12 exceeded 150 mm 7 . Gorbea accumulated 263.2 mm, including 124.0 mm on 23 September and 117.8 mm on 24 September: 92% of its event total fell in two days. Villarrica reached 200.6 mm, while Río Toltén at Coipué recorded 192.3 mm.
Map 2. Rain gauges analysed in La Araucanía from 22 to 25 September 2026. Source: analysis based on VisMet .
Table 1. Accumulated rainfall at the selected La Araucanía gauges 7 .
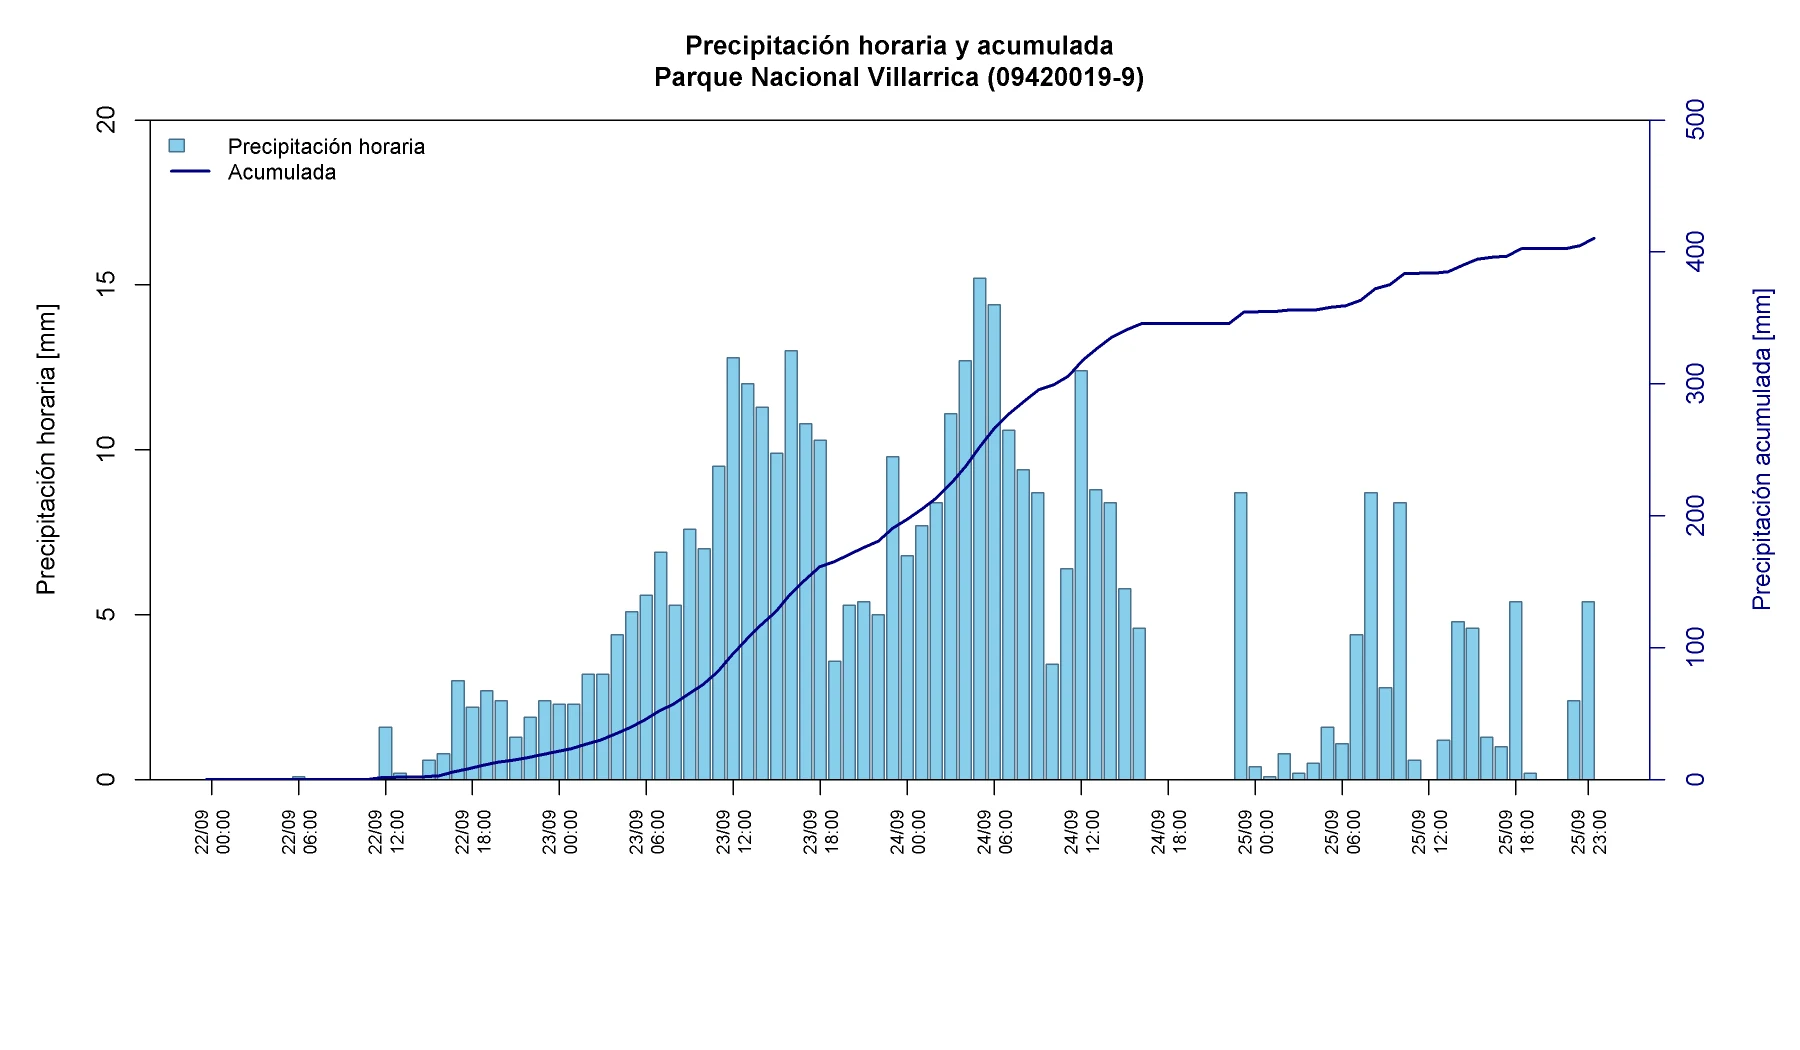
Other hourly VisMet records expand the high-elevation picture: Villarrica National Park reported 410.3 mm, Puesco 362.4 mm and Conguillío 317.7 mm. These preliminary point values need normal quality control and should not be treated as catchment averages or regional records without comparison with neighbouring stations.
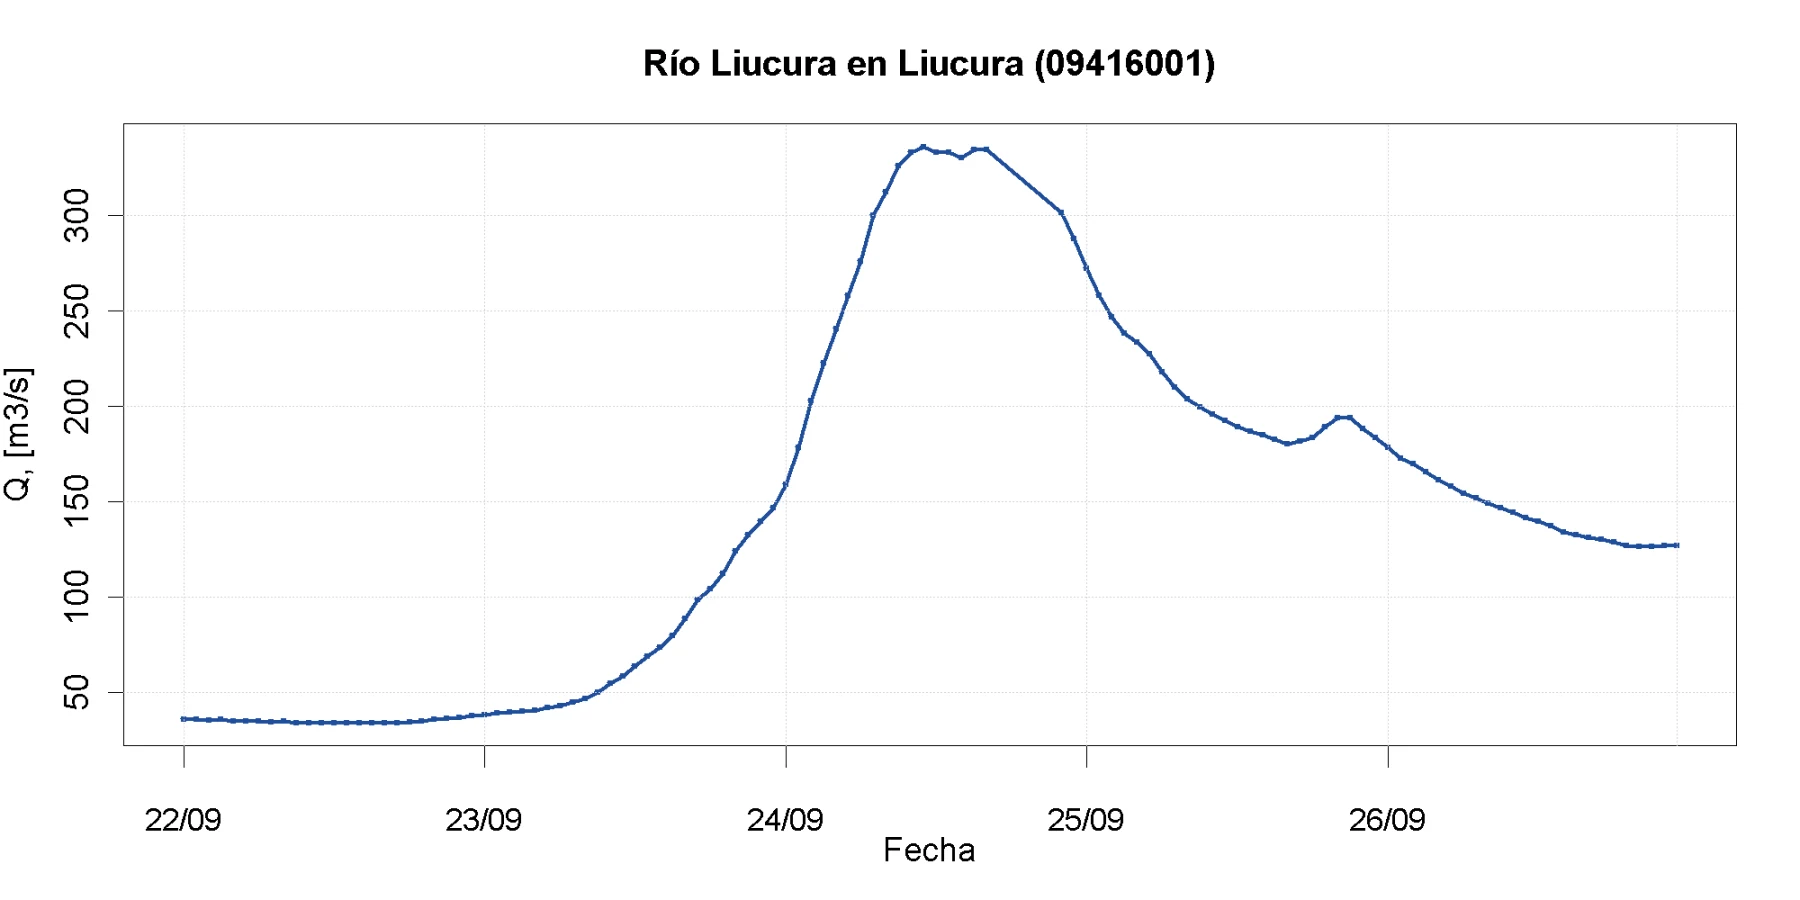
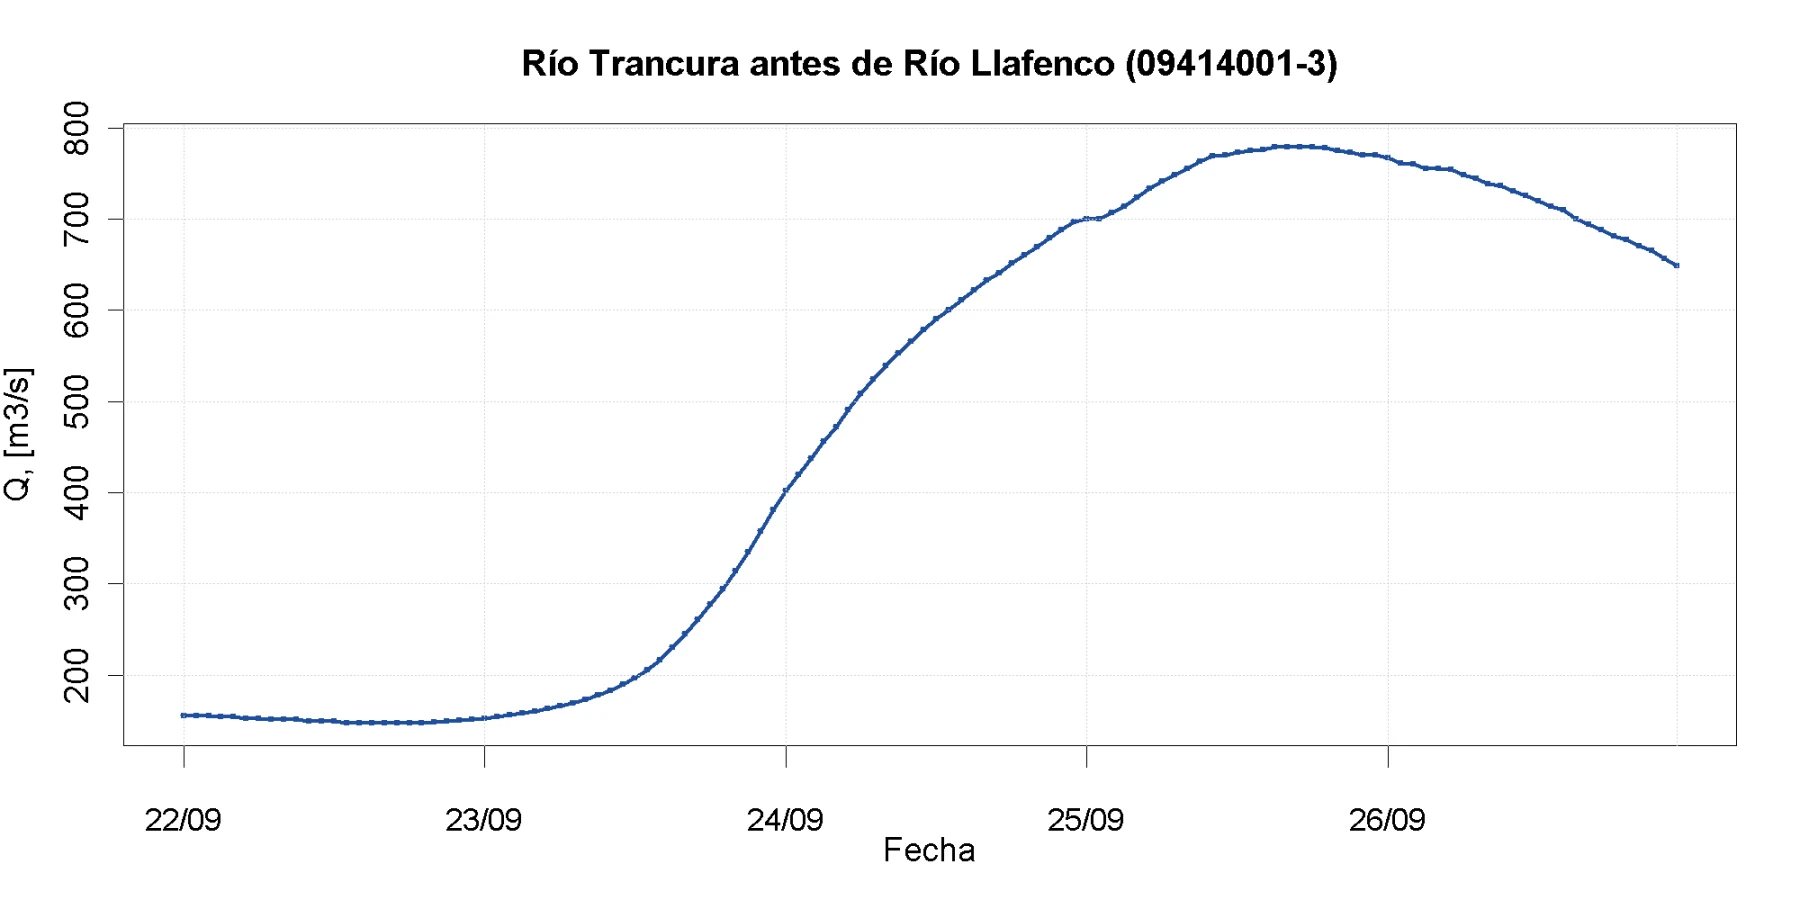
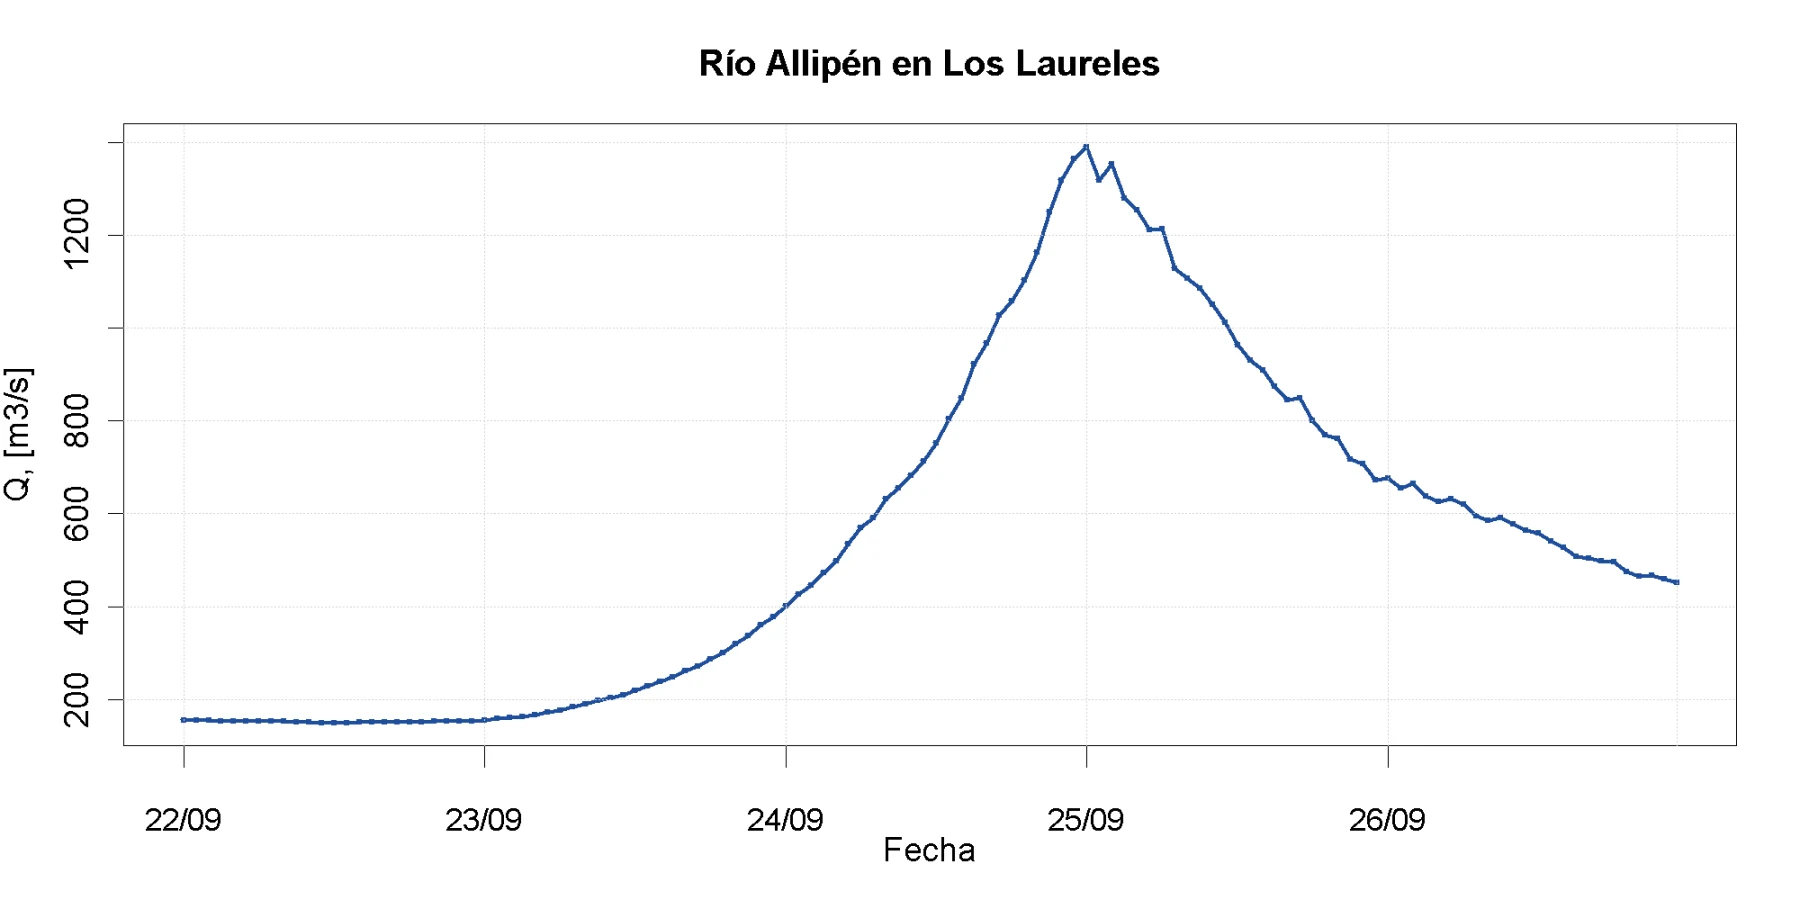
The river response combined fast headwater rises with a longer plateau in larger systems. The Liucura River rose from roughly 35 m³/s to 337.2 m³/s at 11:00 on 24 September. The Trancura climbed more gradually to 779.2 m³/s at 15:28 on 25 September and remained high, consistent with the multi-day connectivity disruption around Curarrehue 3 9 . The Allipén reached 1,406.1 m³/s shortly after midnight on 25 September, several hours after evacuations in Cunco.
Los Ríos Region
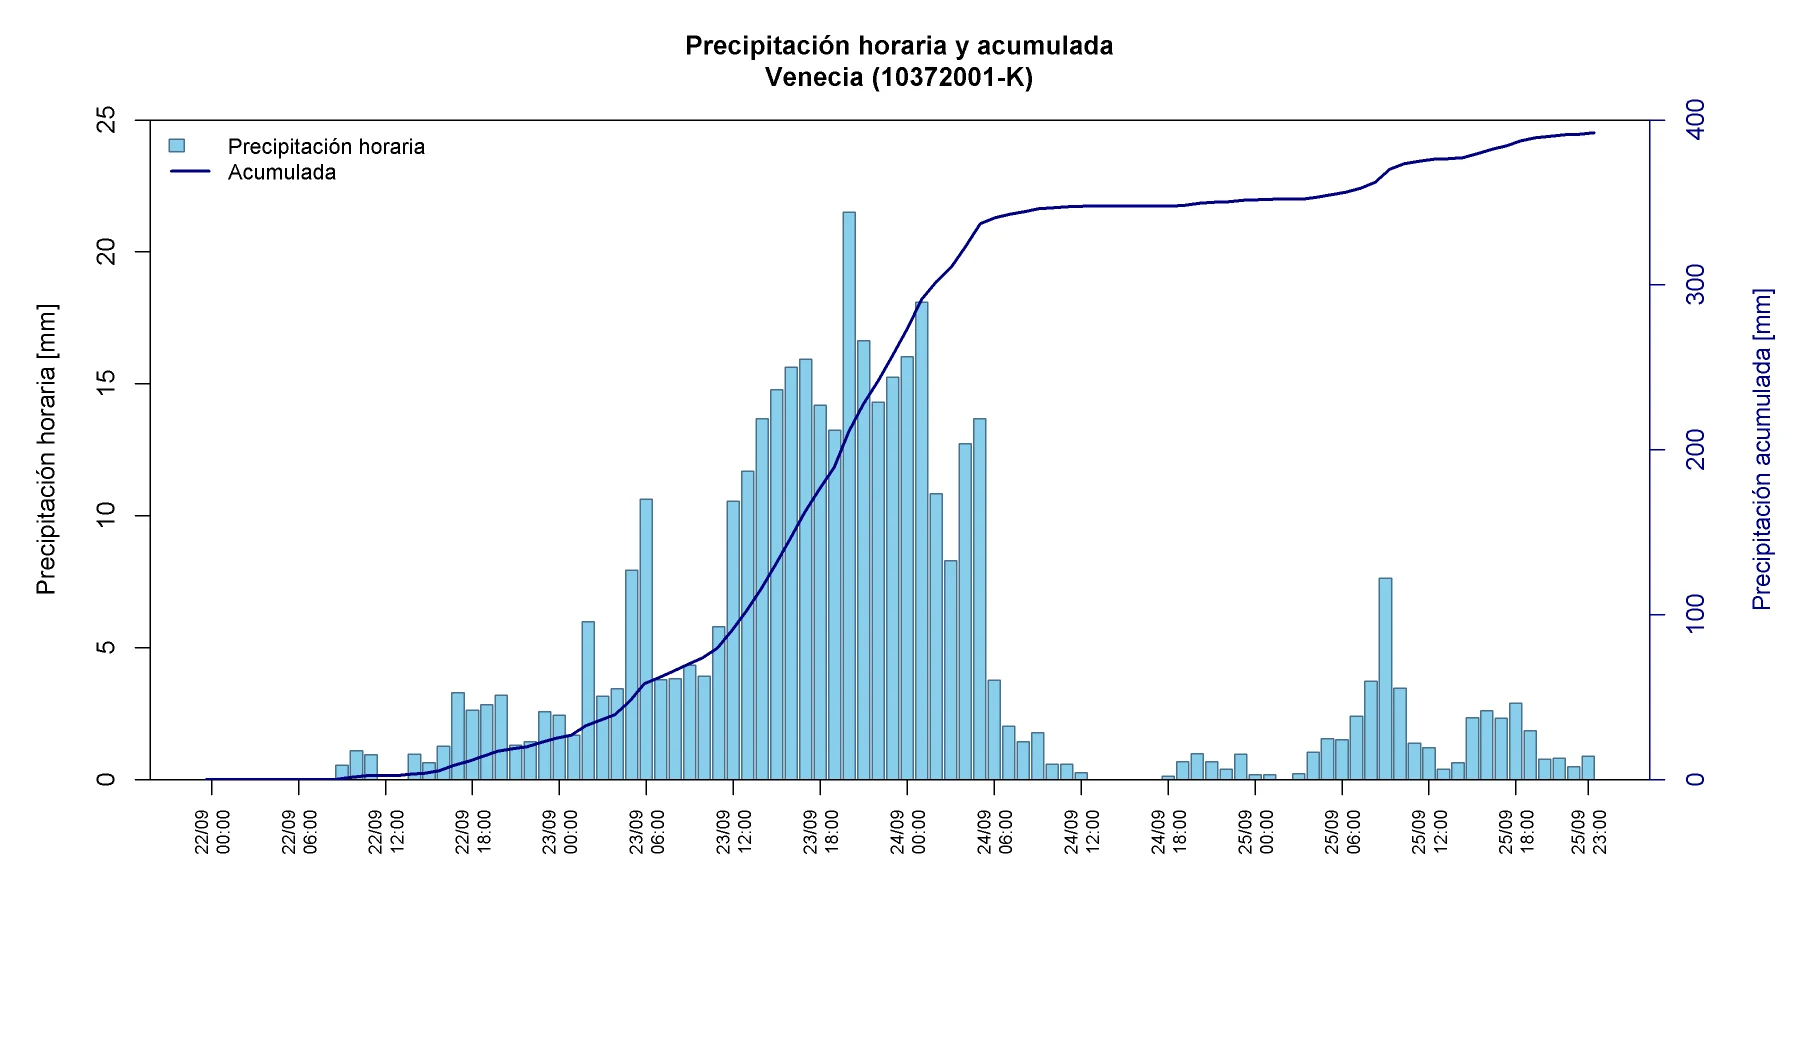
Thirteen of the 27 gauges in the regional table exceeded 100 mm and four exceeded 200 mm 7 . Río Calle Calle at Pupunahue recorded 234.7 mm, Río Fui at the outlet of Lake Pirihueico 223.2 mm, Isla Teja in Valdivia 220.1 mm and Panguipulli 211.3 mm. The strongest pulses arrived earlier in valley and coastal stations on 23 September, while some foothill and mountain stations remained intense into 24 September.
Map 3. Rain gauges analysed in Los Ríos from 22 to 25 September 2026 7 .
Table 2. Accumulated rainfall at the selected Los Ríos gauges 7 .
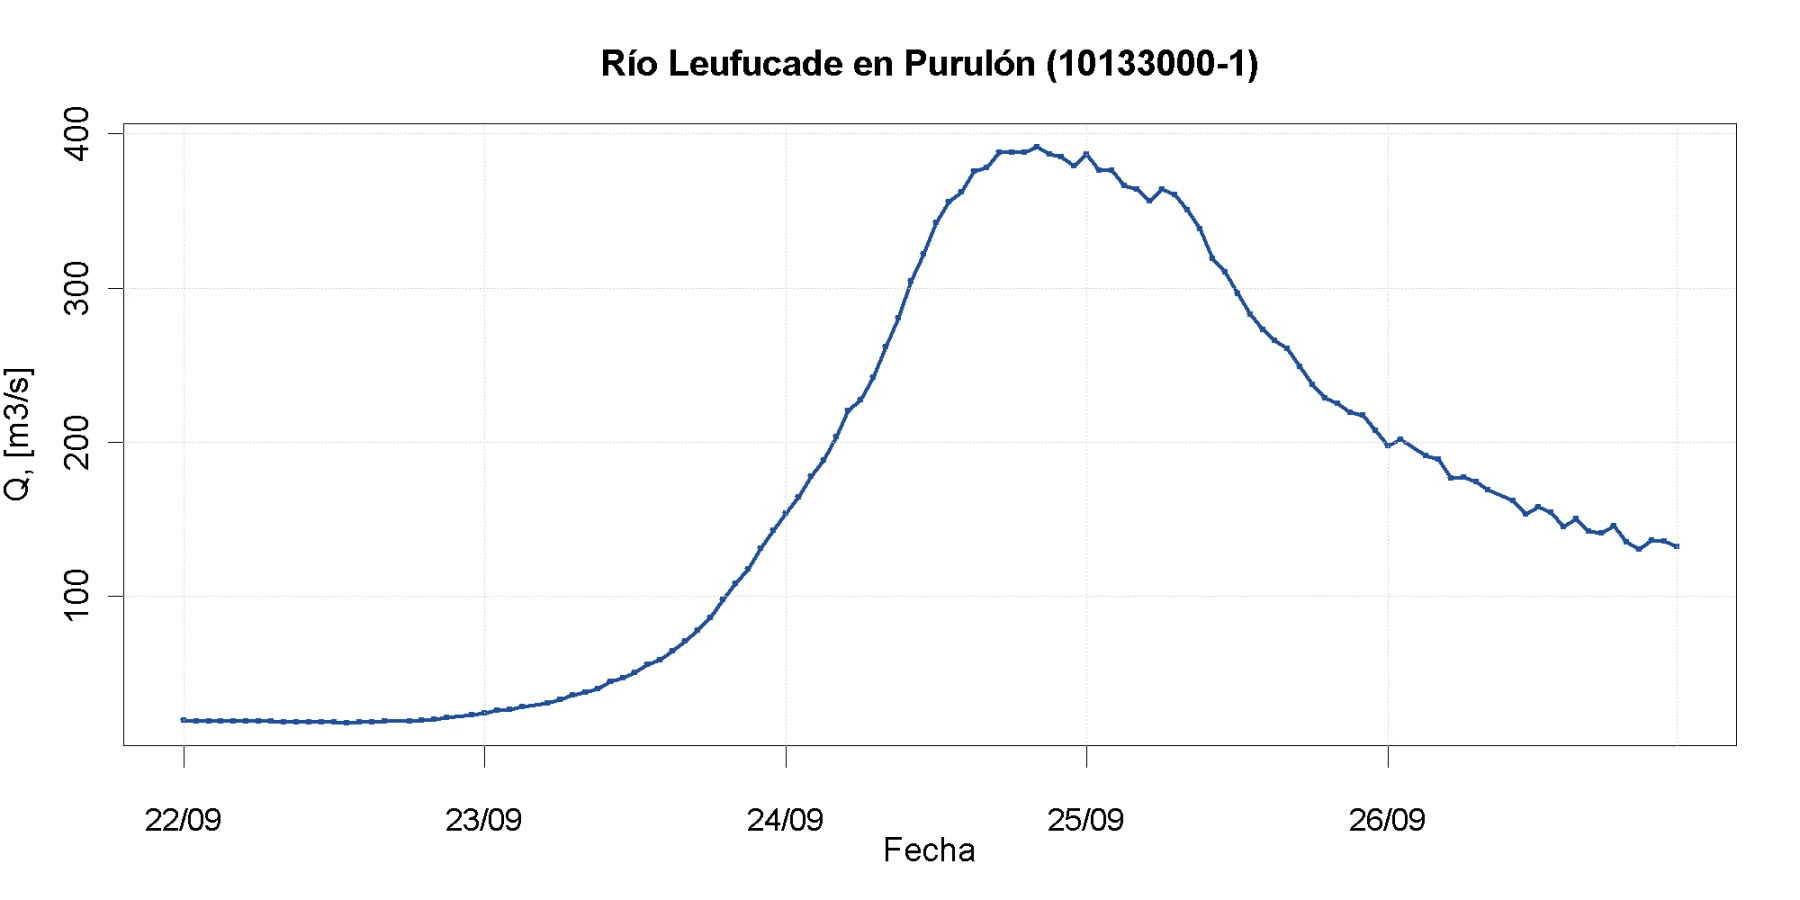
The Leufucade River at Purulón rose from roughly 18 m³/s to 392.5 m³/s at 20:57 on 24 September. Farther downstream, the Calle-Calle at Pupunahue reached 1,897.7 m³/s at 17:28. Its discharge remained well above its initial level through the end of the record, illustrating how a broad catchment can keep conveying water after the heaviest rain has passed.
Biobío Region
Seven of the 37 gauges in the regional table exceeded 100 mm. The largest lowland and coastal totals were concentrated in the coastal range and Arauco Province: Lebu recorded 176.4 mm, Estero Plegarias 166.6 mm and Ponotro 158.3 mm 7 . Estero Plegarias received 108.4 mm on 24 September alone.
Map 4. Rain gauges analysed in Biobío from 22 to 25 September 2026 7 .
Table 3. Accumulated rainfall at the selected Biobío gauges 7 .
Volcán Copahue reported 864.8 mm in the highlighted hourly series, substantially more than surrounding regional-table totals. The time series contains sustained hourly precipitation, but because of its magnitude and high-mountain setting, the value should remain explicitly provisional pending quality control and independent comparison.
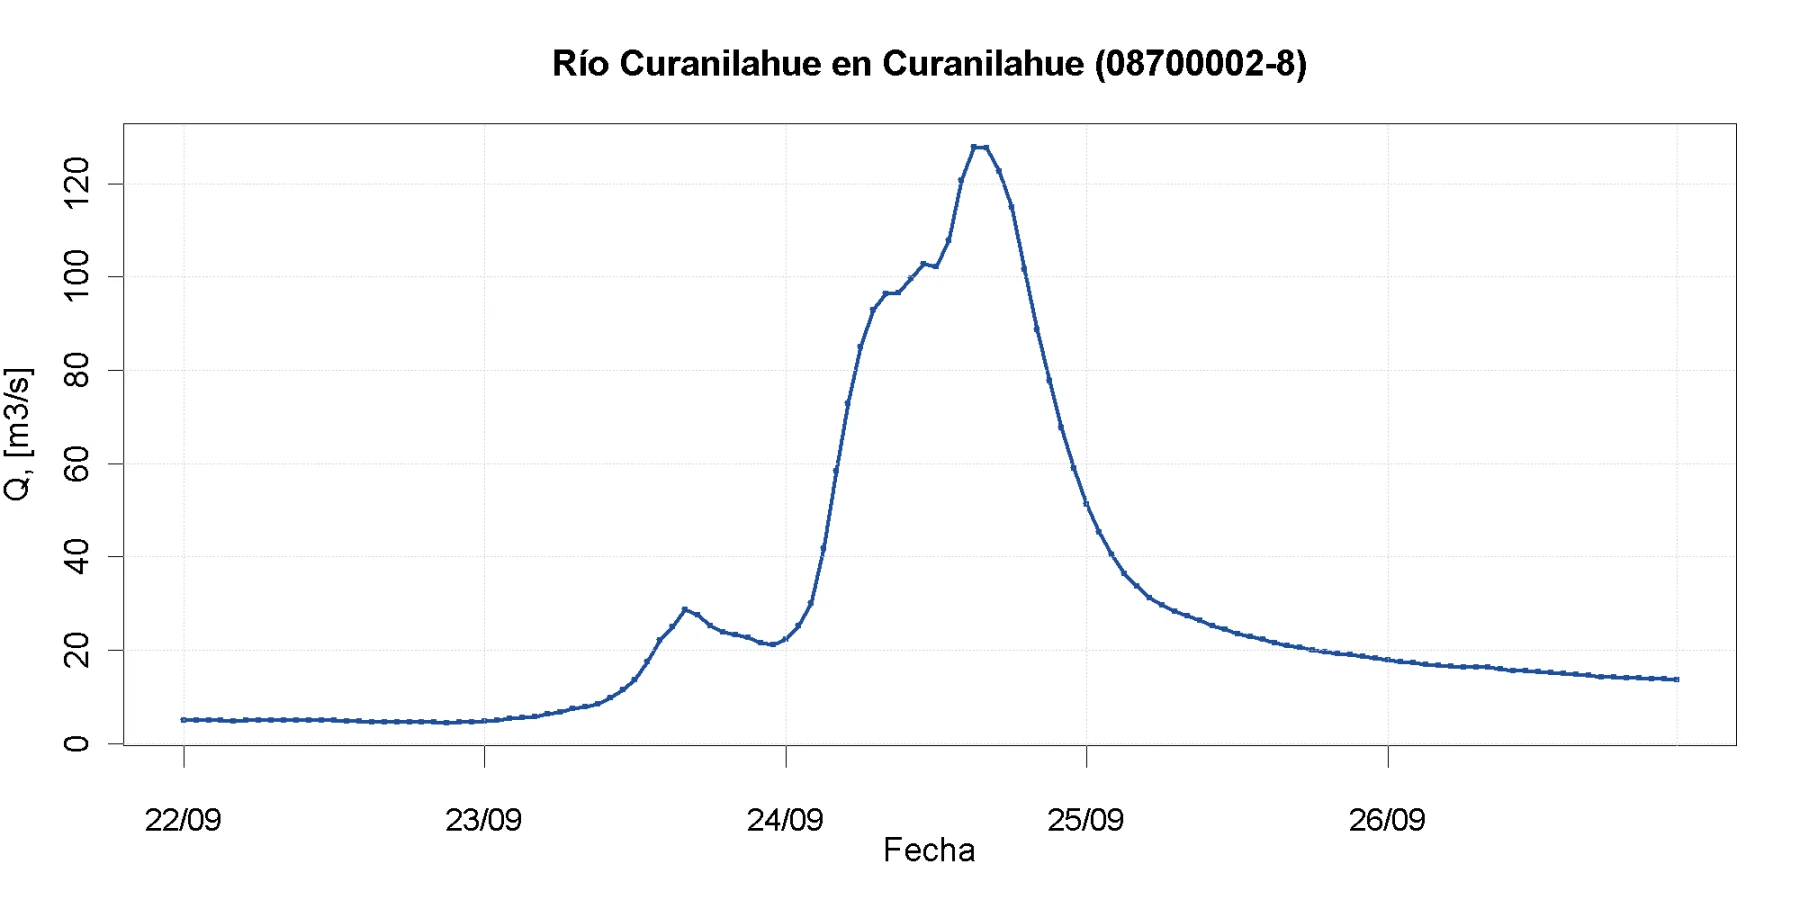
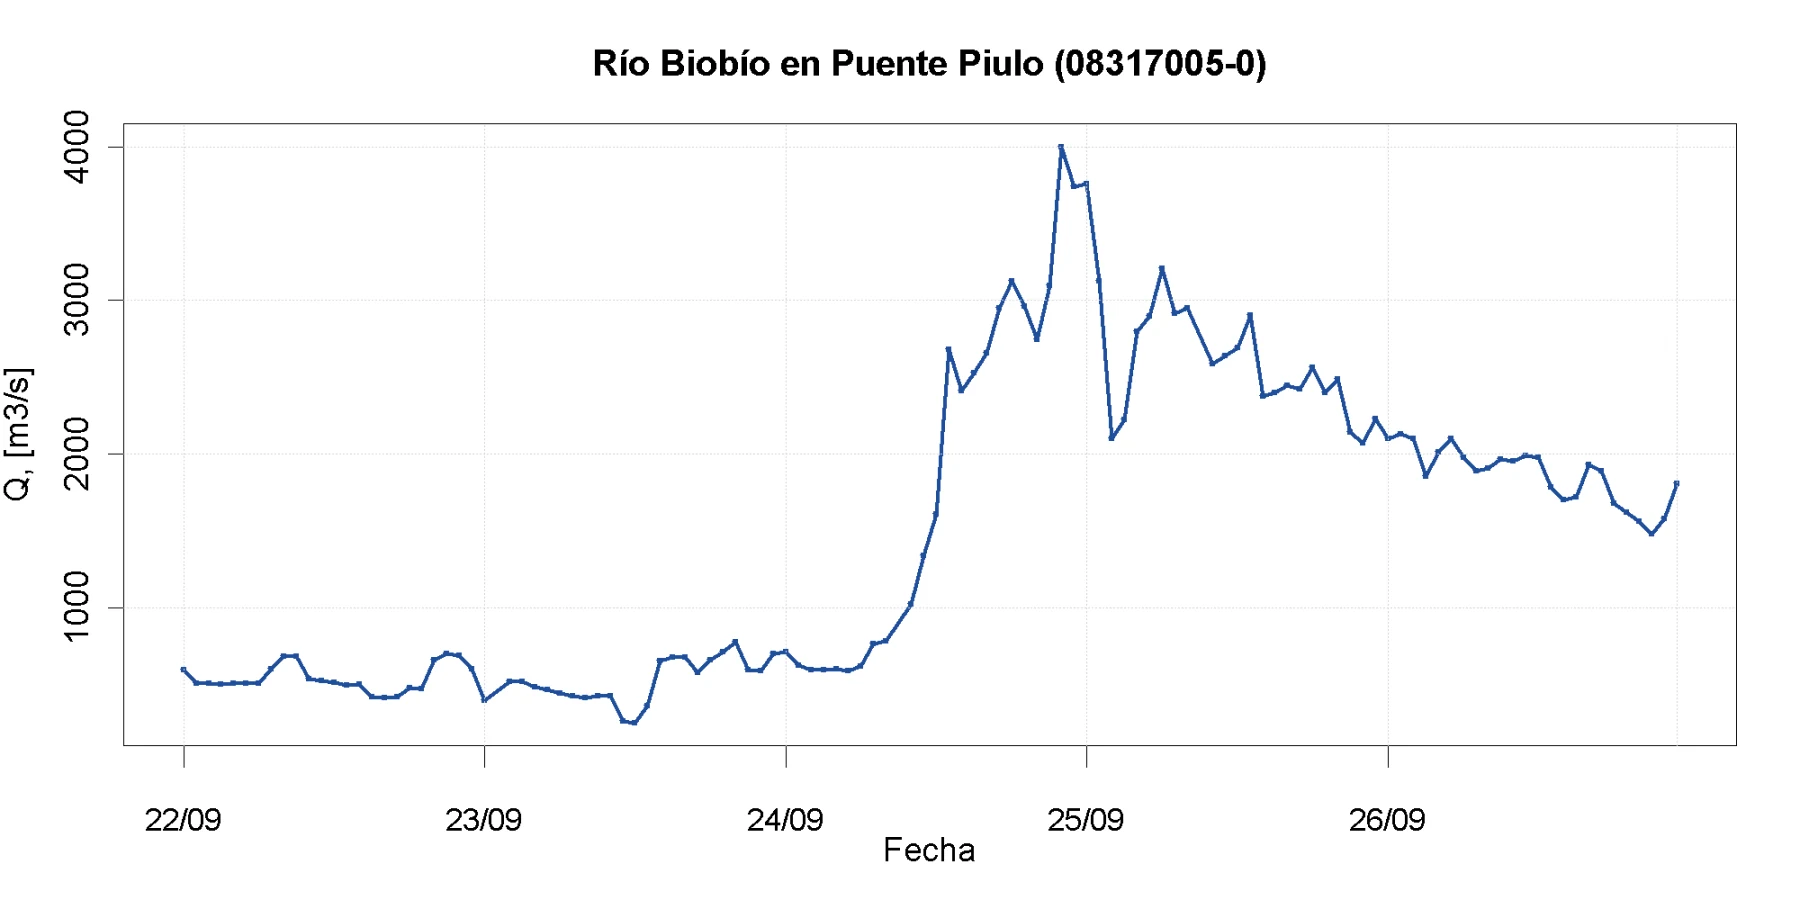
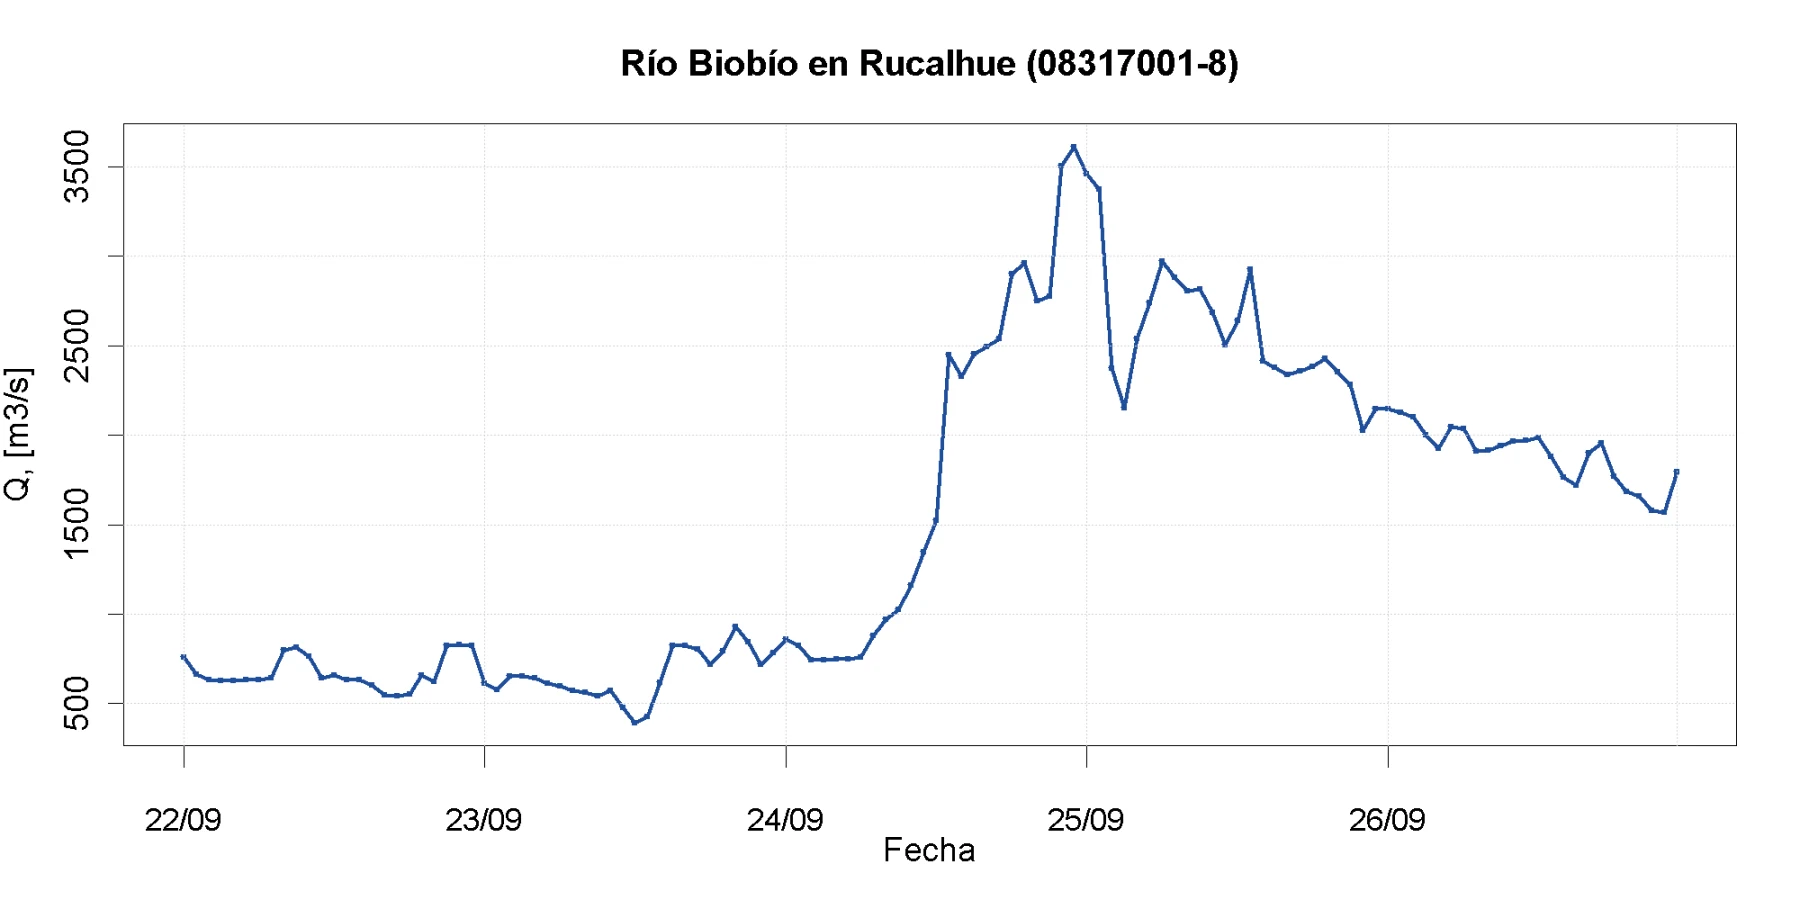
The Curanilahue River produced the sharpest response in this set, rising from about 5 m³/s to 128.8 m³/s at 15:37 on 24 September—about one hour after an SAE evacuation message—and then receding rapidly 10 . The Biobío River reached 4,077.2 m³/s at Puente Piulo and 3,699.1 m³/s at Rucalhue around 22:30. The hydrograph shape may combine tributary inflows with reservoir operations; the observations used here cannot separate those effects.
Ñuble Region
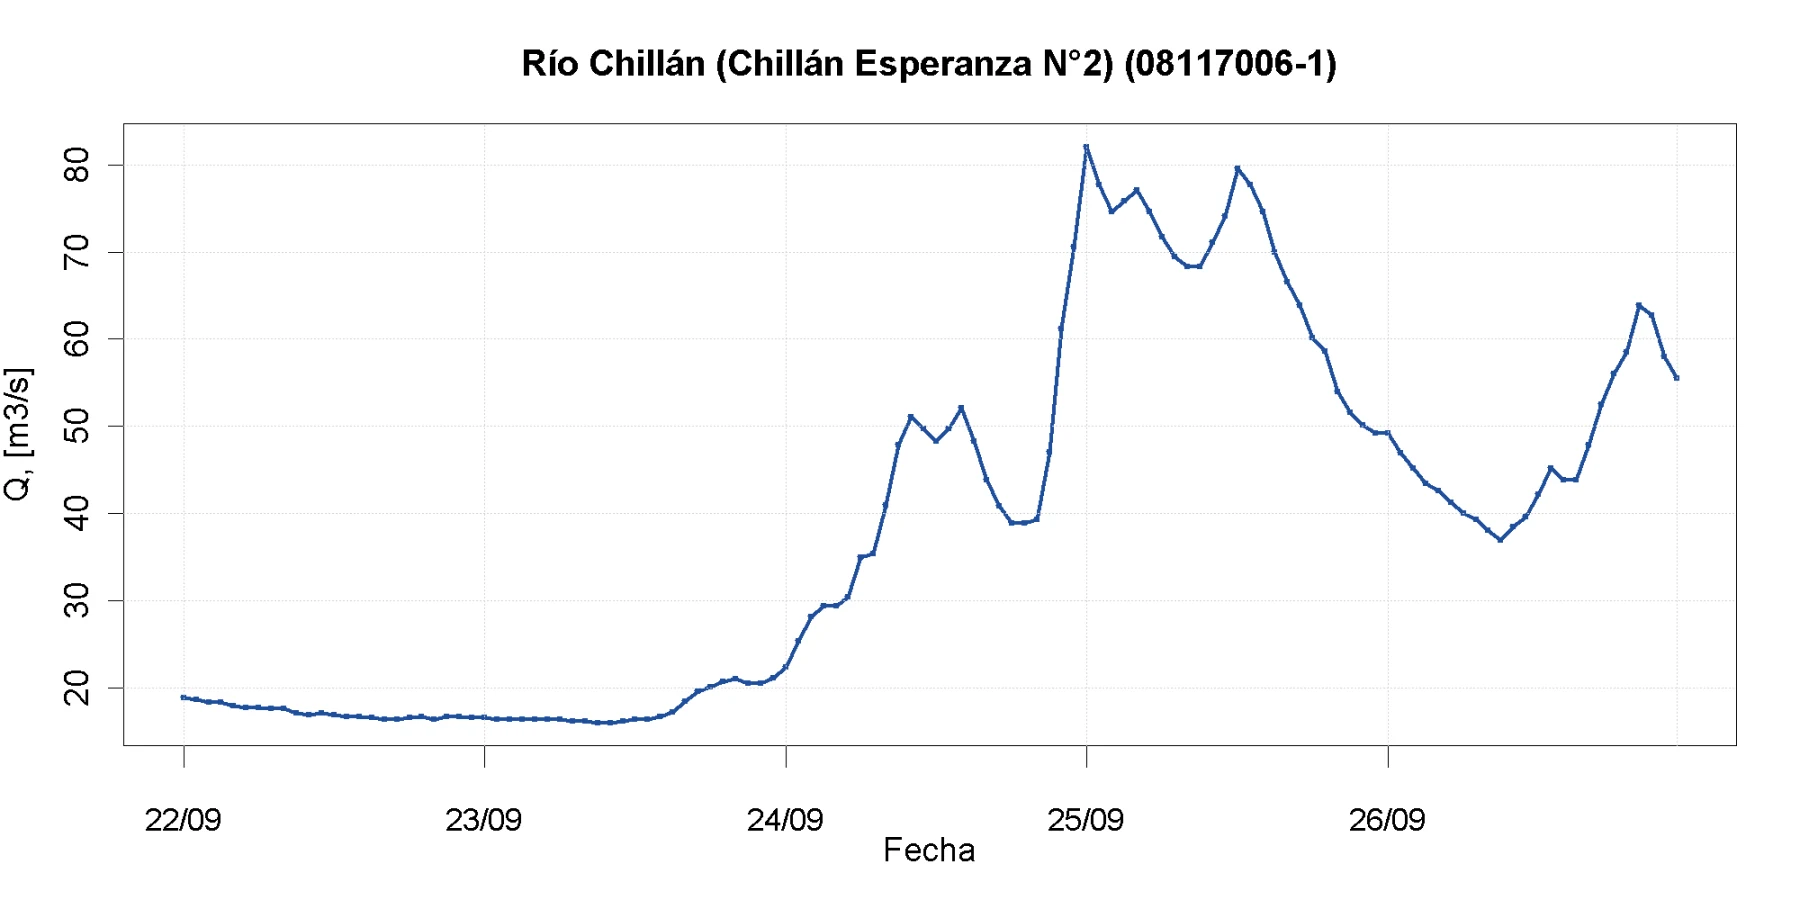
Rain arrived later in Ñuble. The regional-table average increased from 2.8 mm on 23 September to 20.8 mm on 24 September and 11.7 mm on 25 September. Río Chillán at Esperanza No. 2 accumulated 104.0 mm, while the separate highlighted hourly series reached 241.0 mm at Las Trancas 7 .
Map 5. Rain gauges analysed in Ñuble from 22 to 25 September 2026 7 .
Table 4. Accumulated rainfall at the selected Ñuble gauges 7 .
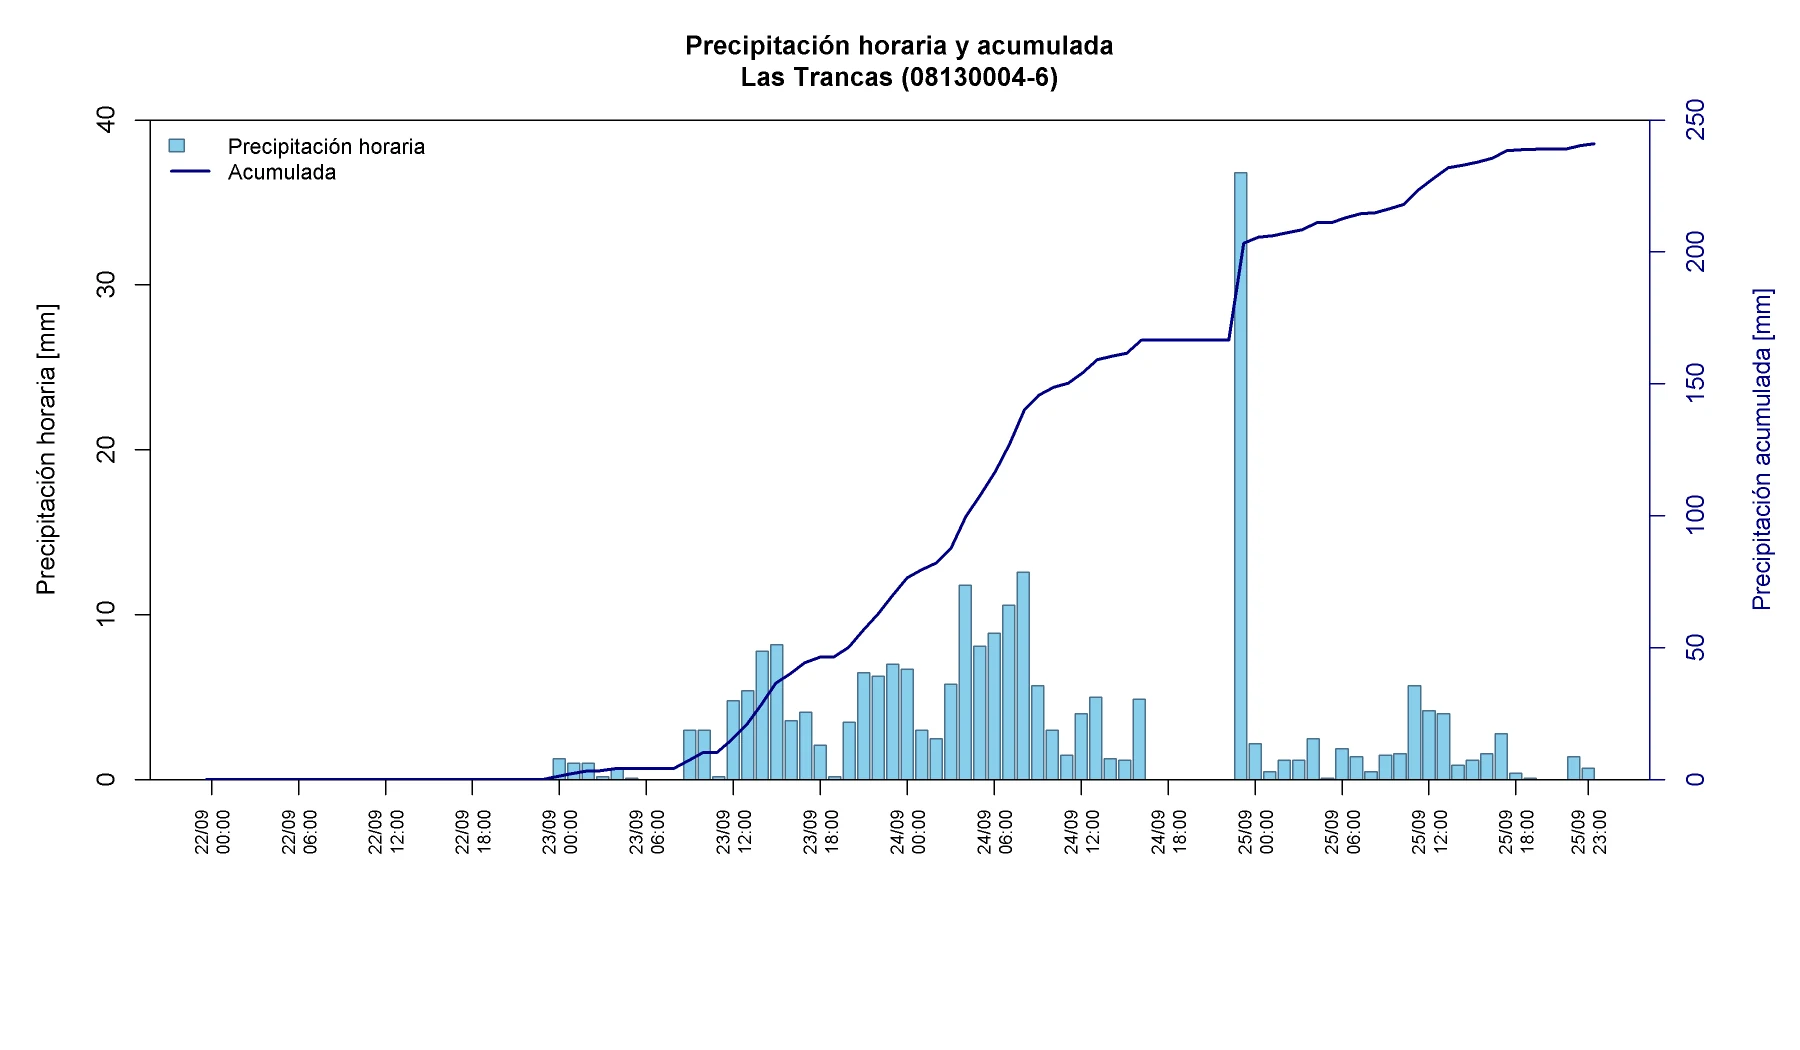
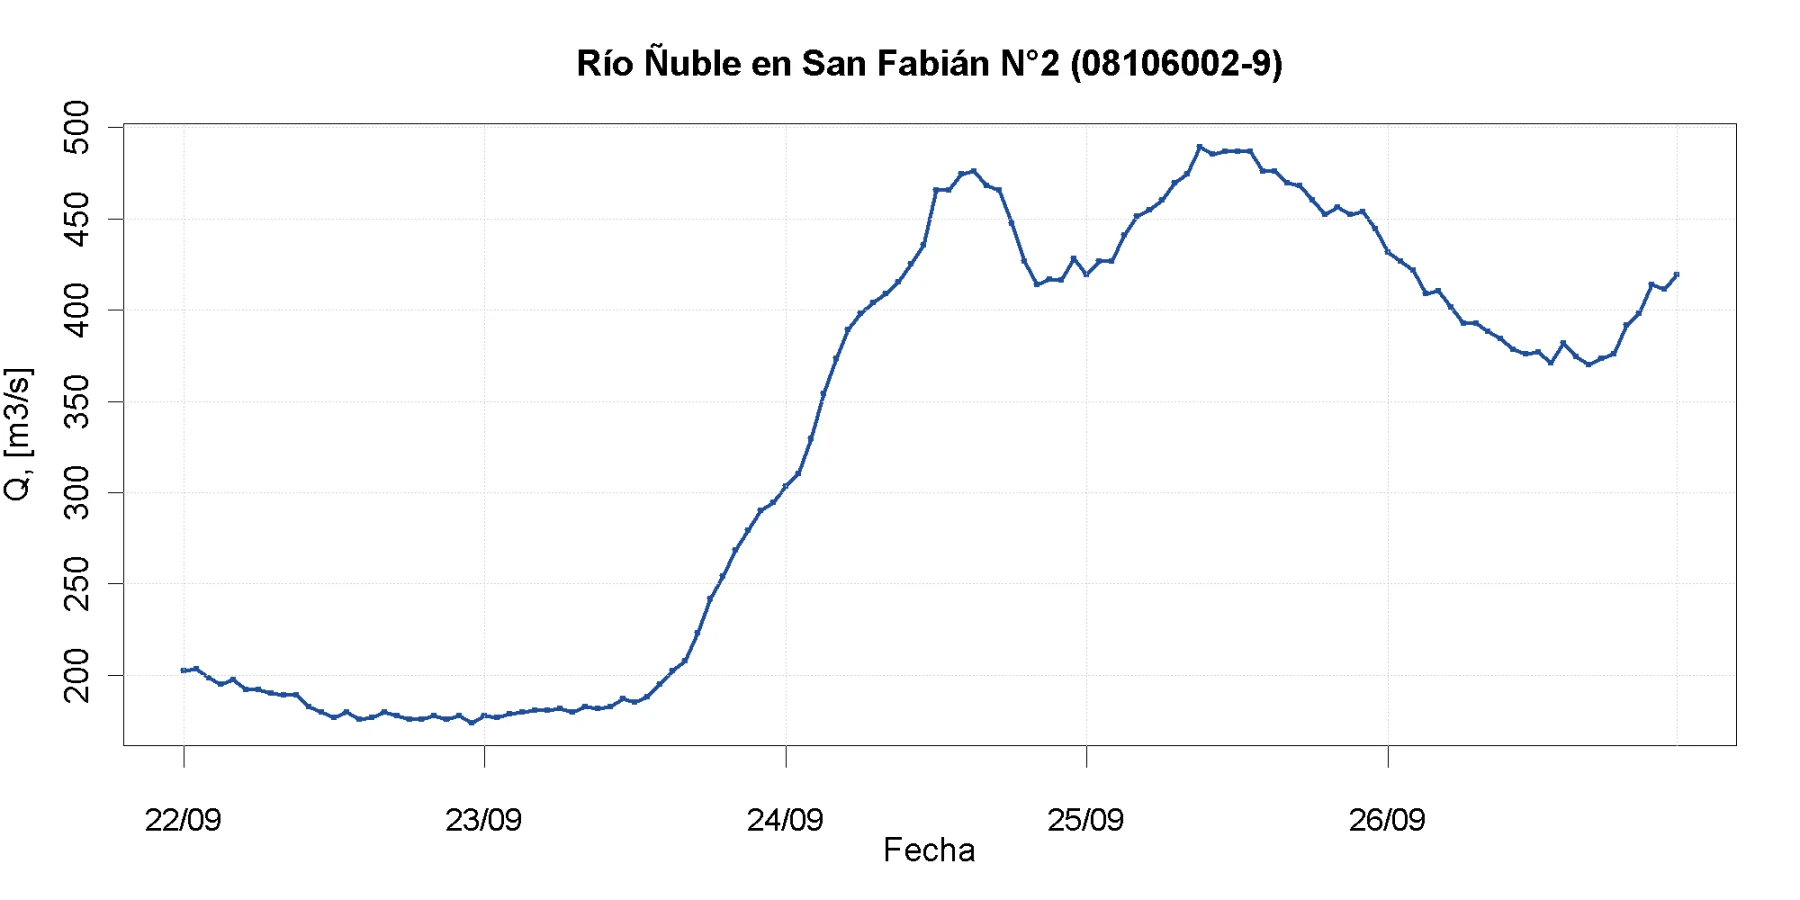
The Chillán River peaked at 85.8 m³/s just after midnight on 25 September. The Ñuble at San Fabián reached 498.9 m³/s late that morning and remained above roughly 400 m³/s for about two days. The larger Itata at Coelemu responded more slowly, peaking at 1,787.8 m³/s at 23:00 on 25 September and remaining elevated through 26 September.
Maule Region
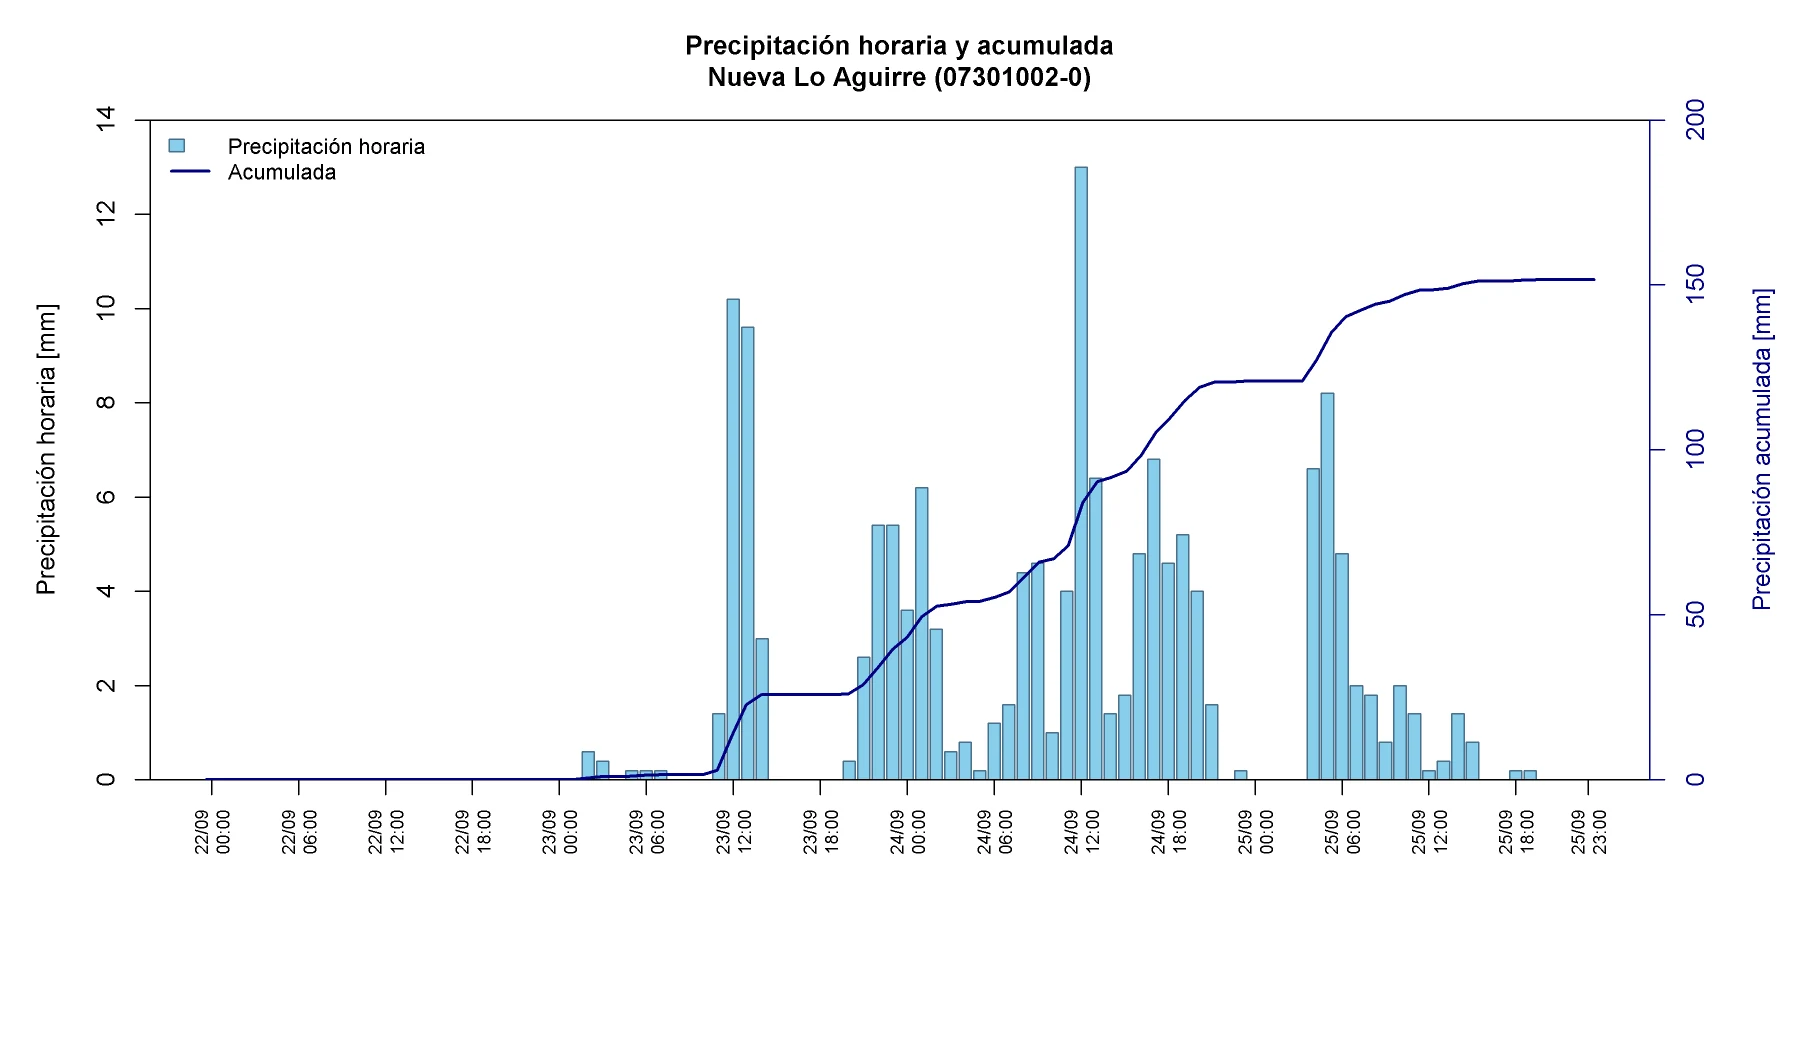
The 76-gauge regional table recorded much less rain: none exceeded 40 mm and the median was 1.4 mm. The largest values were at foothill and mountain stations, led by Embalse Bullileo with 36.5 mm. A separate highlighted hourly record at Nueva Lo Aguirre reached 151.6 mm, again showing why network definitions and data completeness must be checked before comparing rankings 7 .
Map 6. Rain gauges analysed in Maule from 22 to 25 September 2026 7 .
Table 5. Accumulated rainfall at the selected Maule gauges 7 .
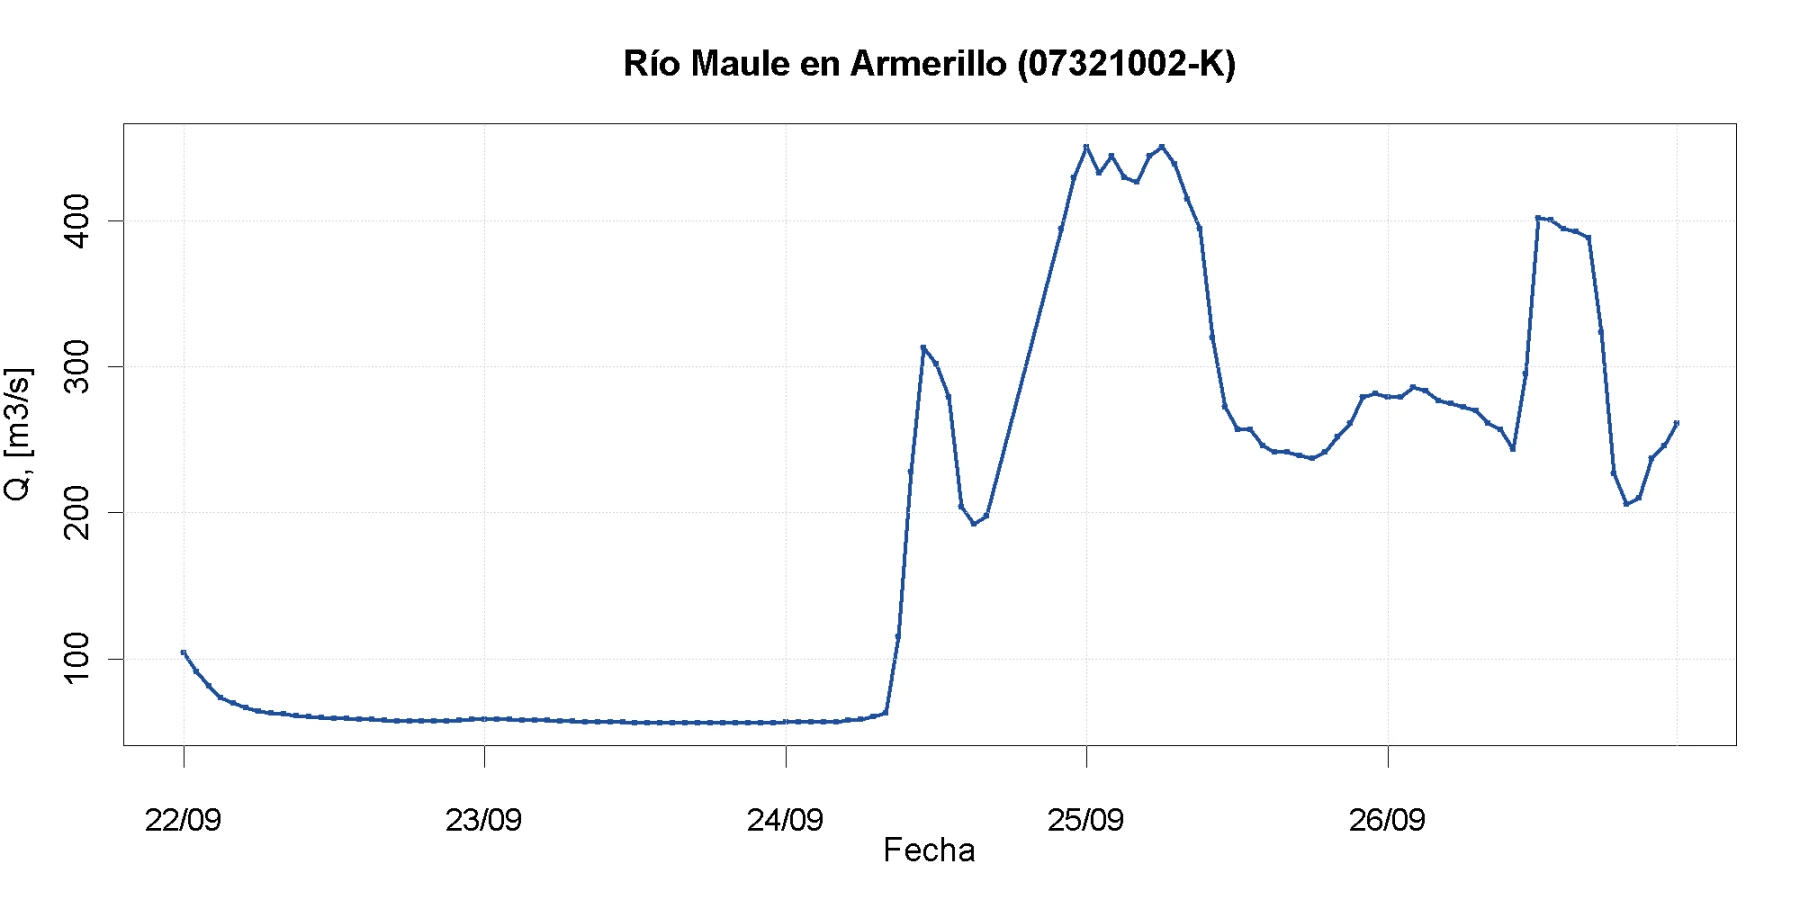
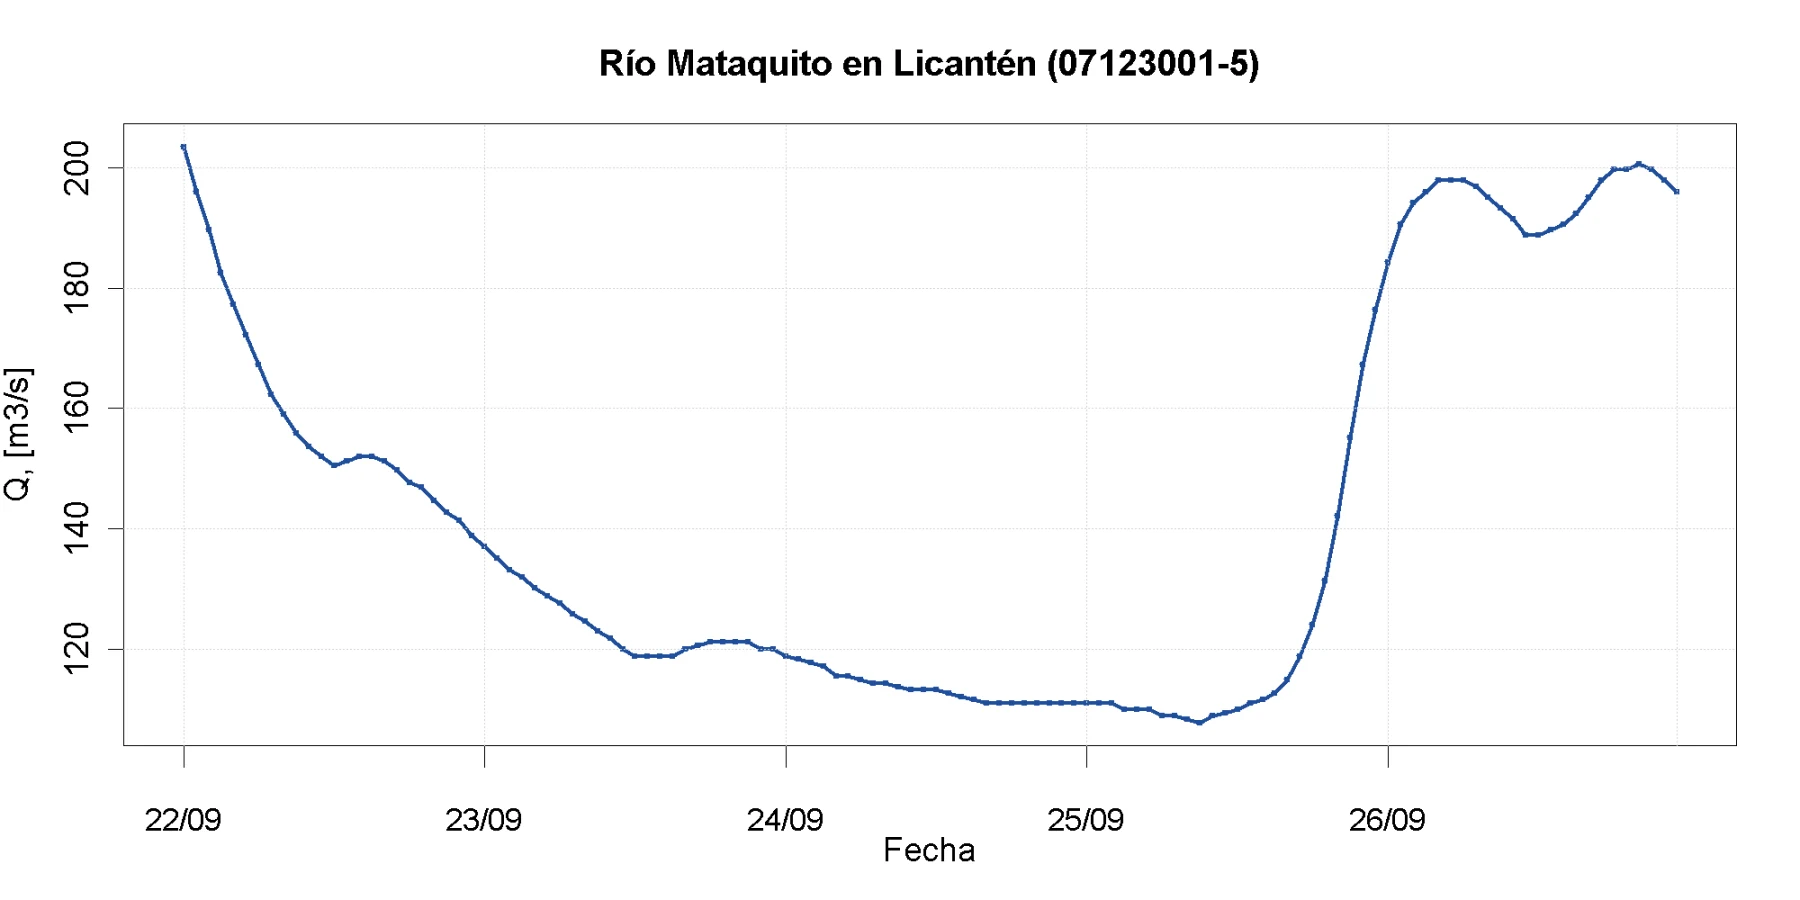
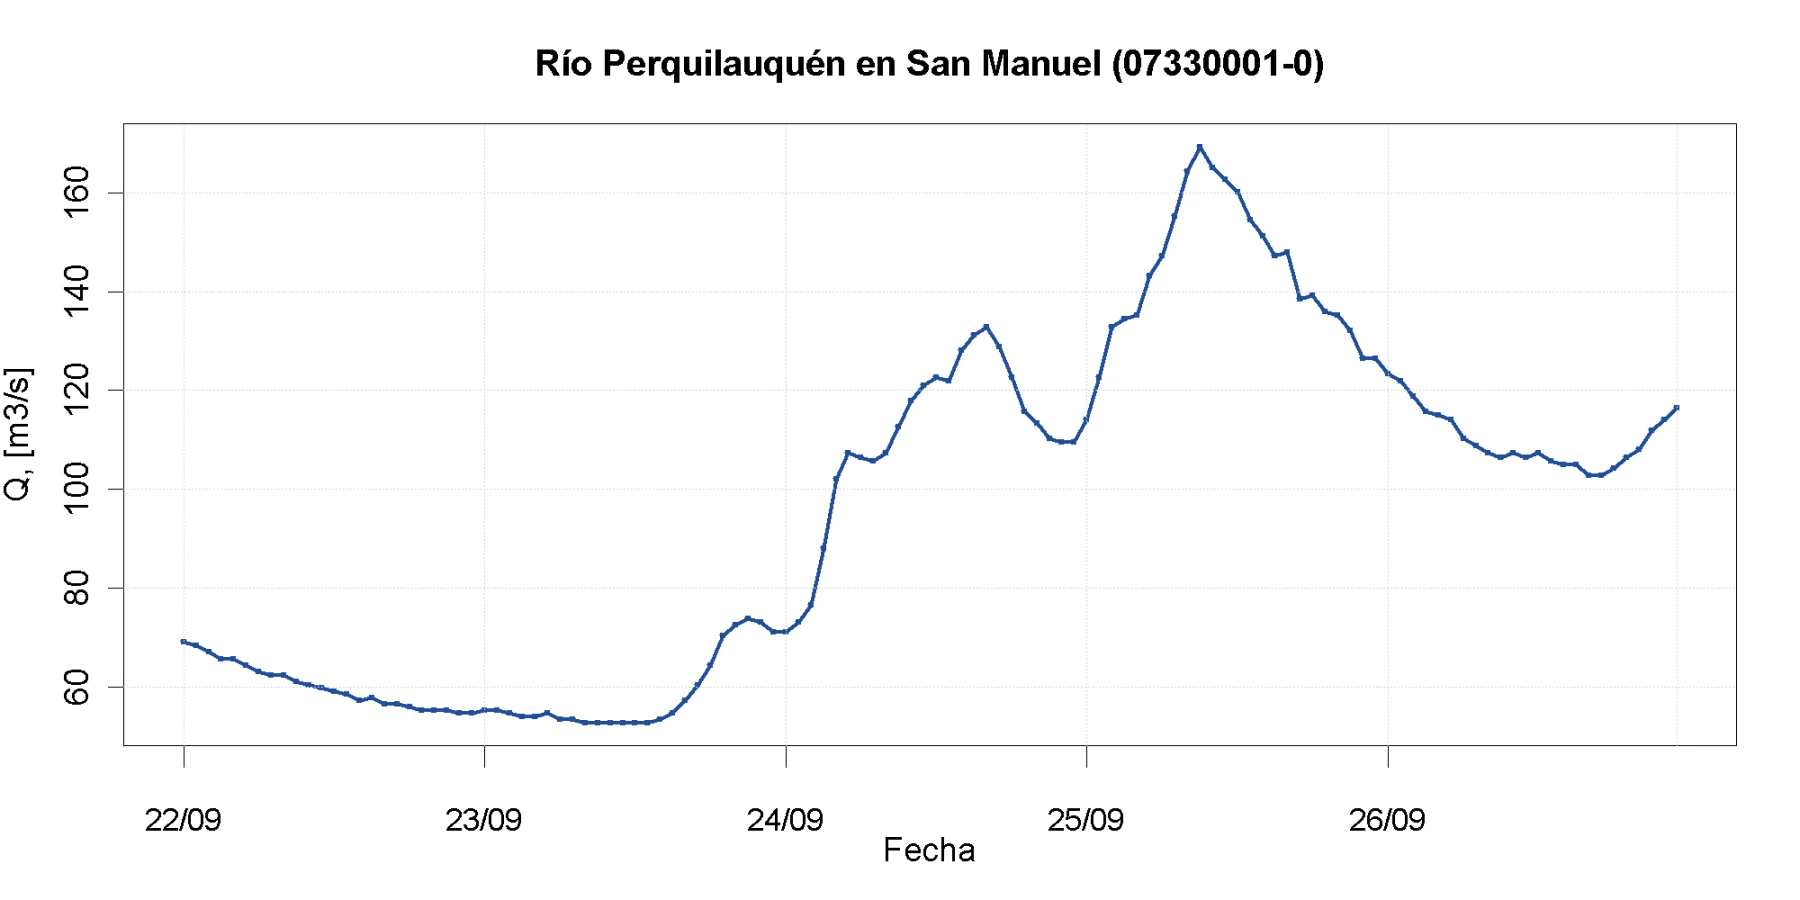
The Maule River at Armerillo rose from about 60 m³/s to 462.7 m³/s at 05:30 on 25 September. The Perquilauquén reached 172.6 m³/s later that morning. The Mataquito series needs a different reading: its nominal maximum of 205.3 m³/s is the first observation on 22 September and belongs to an earlier recession, not to a new event peak. Rain gauges may not represent headwater precipitation, and reservoir operations or rain-on-snow processes cannot be quantified with the available data.
Connecting the river records to reported impacts
Gauge records support the event timeline, but a gauge does not represent an entire river and cannot by itself prove where a channel overflowed.
- Curanilahue: the strongest match. Evacuation was ordered at 14:40 on 24 September after the Curanilahue and Rana rivers and Estero Plegarias overflowed; the gauge peaked at 15:37 after 108.4 mm of rain at Estero Plegarias that day 10 .
- Curarrehue and Pucón: the Liucura peaked during the 24 September emergency, whereas the Trancura peaked more than a day later and stayed high. This timing is consistent with prolonged isolation, but the affected reaches are not the gauge sections 3 9 .
- Los Ríos: the Leufucade and Calle-Calle peaked on the same day as evacuations and the Valdivia Province Red Alert. Their discharge values do not define the bankfull level at other locations 3 4 .
- Biobío River: the Puente Piulo and Rucalhue peaks coincided with downstream alerts and evacuations. The available series cannot separate natural tributary inflow from reservoir operations.
Hydrological interpretation
- The event arrived over an already wet month. Antecedent wetness reduced the catchment storage available before new rainfall became runoff.
- The rainfall pulse moved from south to north. The largest regional averages occurred first in Los Ríos, then in La Araucanía and Biobío, and later in Ñuble and Maule.
- Small catchments responded in hours. The Liucura, Curanilahue, Leufucade and Chillán rose sharply during or just after the strongest rainfall blocks.
- Large catchments remained high for longer. The Trancura, Allipén, Calle-Calle and Itata showed broader peaks and slower recessions, so danger persisted after rain weakened.
- A high freezing level increased the potentially contributing area. It favoured liquid precipitation at higher elevations, but the available observations cannot quantify snowmelt or assign each discharge peak to a single cause.
- The social inventory lagged the weather. Isolation decreased as roads reopened, while the number of affected or displaced people continued to rise as local assessments were completed 5 .
Frequently asked questions
Why did some rivers remain high after the rain eased?
Water does not reach the main channel from every part of a catchment at the same time. Travel through hillslopes, tributaries, lakes and regulated reaches can spread a flood wave over hours or days.
Does 864.8 mm mean that all of Biobío received that much rain?
No. It is a preliminary point total from one high-mountain gauge at Volcán Copahue. Estimating catchment rainfall requires many gauges and spatial products, not the single largest value.
Does 4,077.2 m³/s mean the Biobío River overflowed everywhere?
No. Overflow depends on local water level, channel geometry, bridges, flood defences and the floodplain. The value describes magnitude and timing at Puente Piulo only.
What was the economic cost?
The latest public balance located for this event did not include an official monetary estimate. A defensible cost requires later housing, transport, agriculture and public-infrastructure assessments.
Public-safety recommendations
- Continue monitoring rivers and roads after rainfall has stopped; large catchments can peak late and recede slowly.
- Evacuate immediately after an SAE message, and never cross flooded roads, bridges or footbridges.
- Do not use a local break in rainfall as the sole signal that it is safe to return to an evacuated home.
- Check official road and mountain-pass conditions before travelling, especially on routes already affected by washouts or river overflow.
- Follow SENAPRED and DMC channels for official warnings, and treat real-time hydrometeorological values as preliminary until validated.
[1]: SENAPRED: coordination and forecast for south-central Chile, 22 September 2026.
[2]: La Tribuna: frontal-system warning and forecast freezing levels, 23 September 2026.
[3]: SENAPRED event monitoring from O'Higgins to Magallanes, updates from 24-28 September 2026, including the event closure.
[4]: La Tercera: SENAPRED balance, 34 SAE messages and river-overflow response, 25 September 2026.
[5]: Radio Agricultura: latest SENAPRED balance located for the event, cut-off at 05:30 on 28 September 2026.
[6]: Mawün-NRT real-time precipitation, La Araucanía Water Resources Observatory.
[7]: CR2 Meteorological Viewer (VisMet).
[8]: DGA official online hydrometeorological information.
[9]: Radio Bío Bío: Curarrehue remained isolated for a third day, 26 September 2026.
[10]: VLN Radio: Curanilahue evacuations after river overflows, 24 September 2026.