
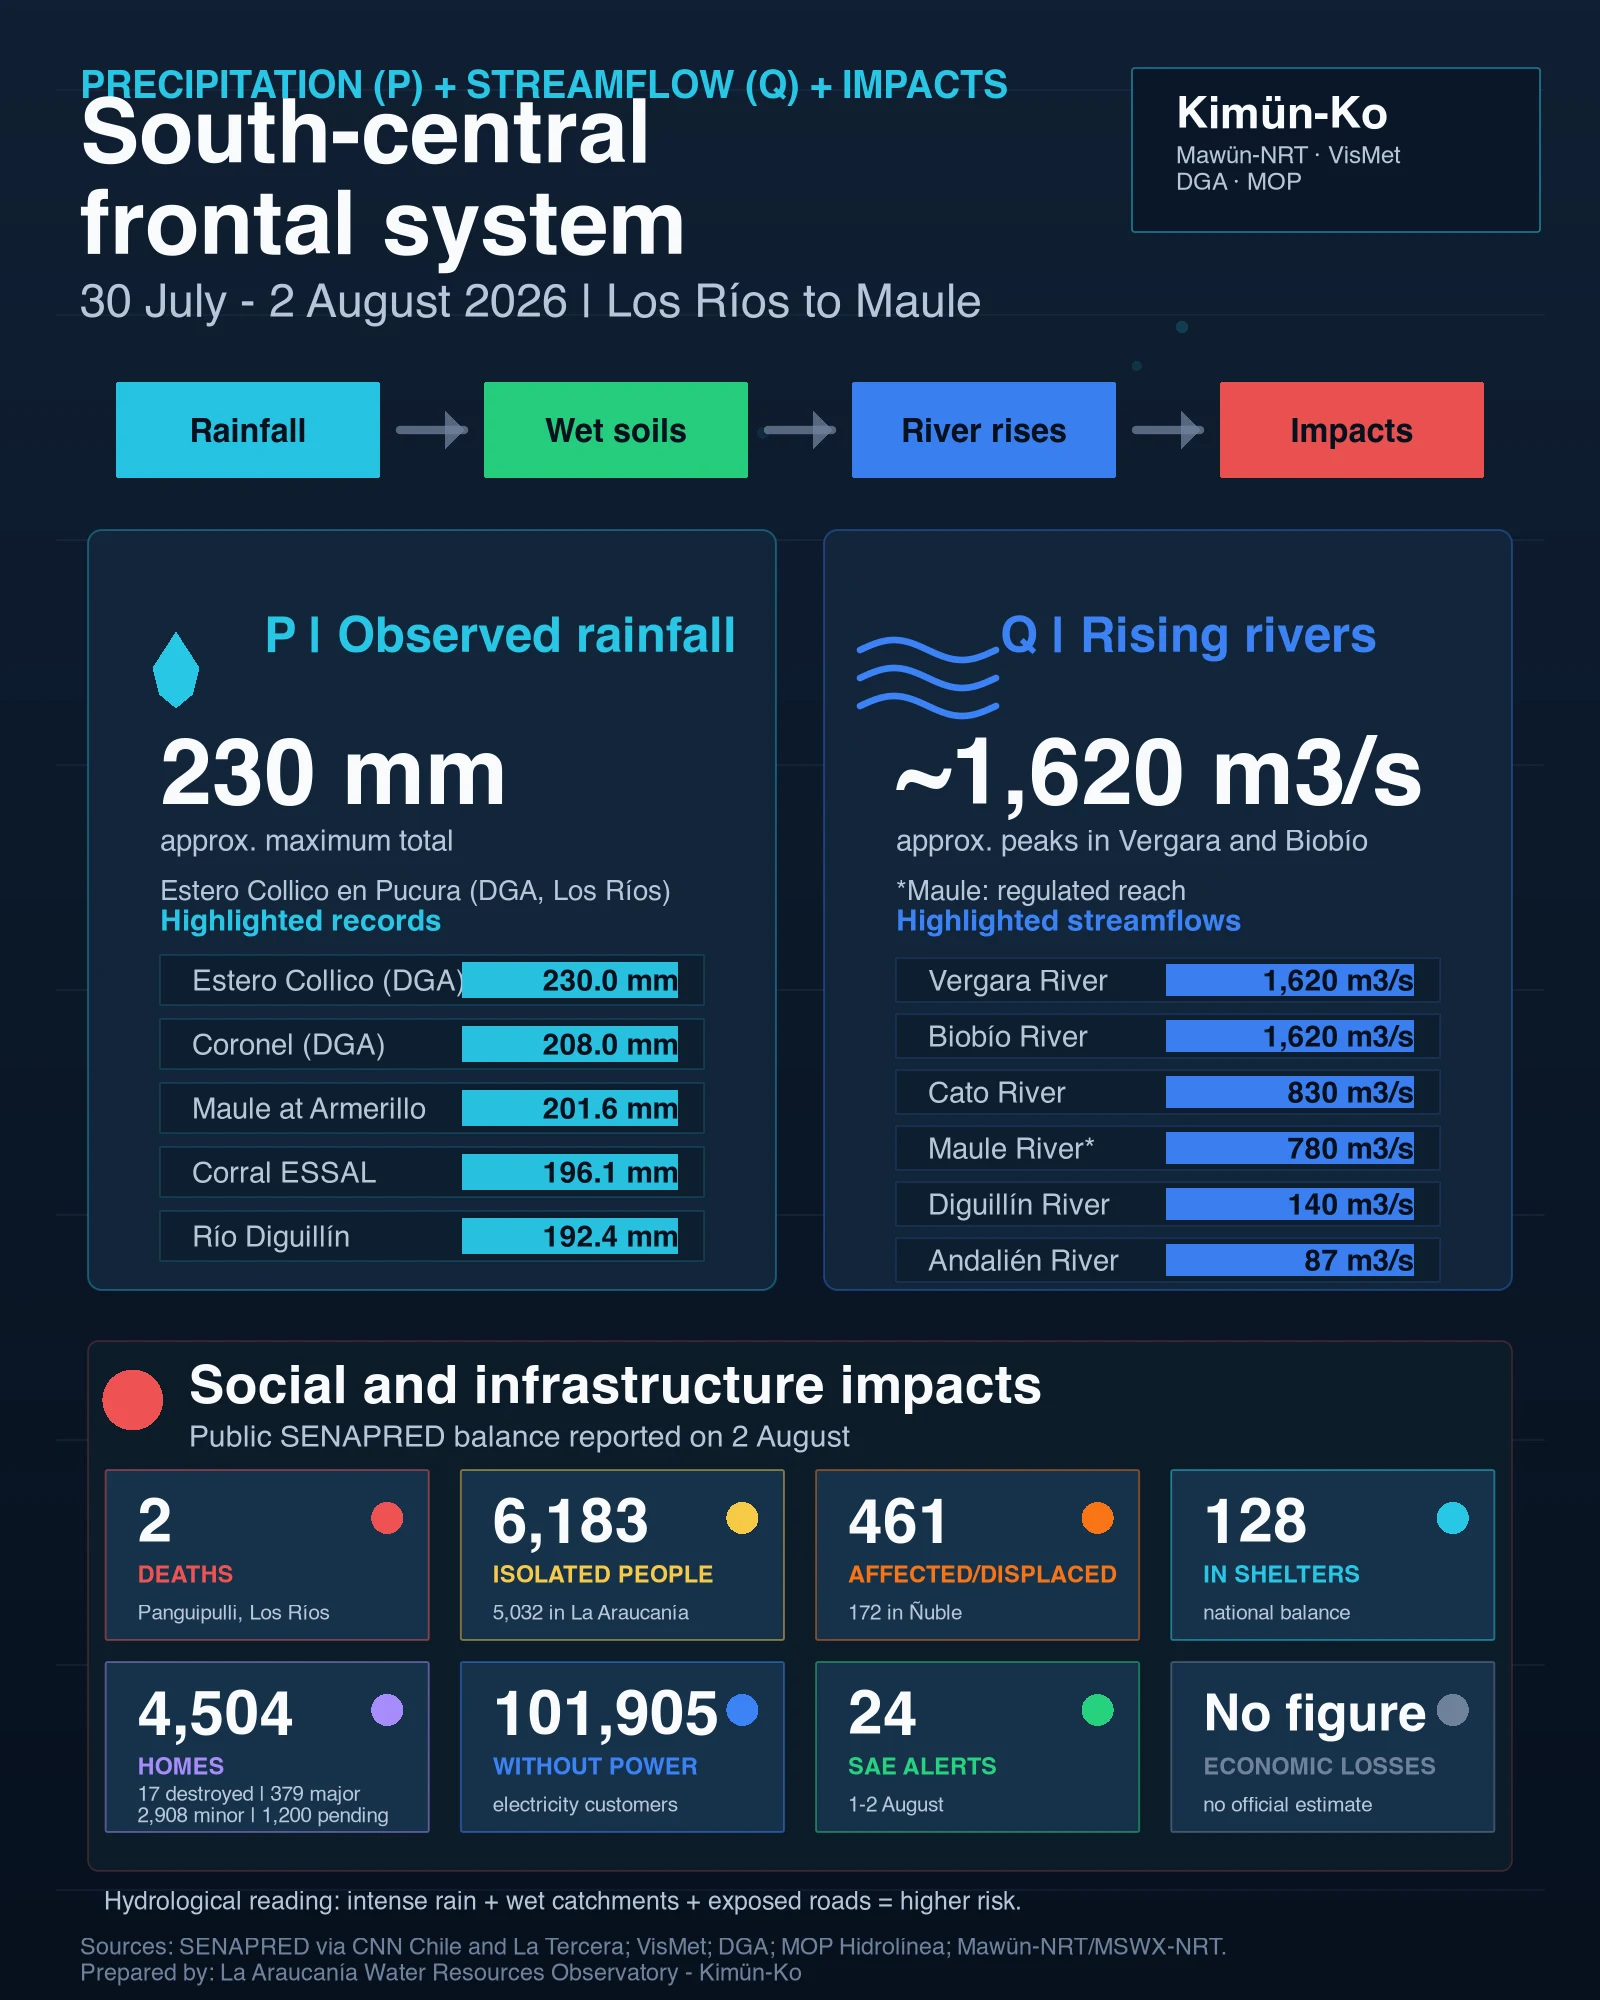
Between 30 July and 2 August 2026, a two-pulse frontal system hit south-central Chile. The first rainfall band wetted soils, hillslopes and small channels; the second arrived over catchments that were already storing water. Under those conditions, a larger share of new rainfall can become rapid runoff, raising rivers, triggering local overflows, destabilizing slopes and cutting rural connectivity.
The latest SENAPRED national balance available for this event, reported on Sunday 2 August by CNN Chile and La Tercera, kept the death toll at 2 people in Panguipulli, with 461 people directly affected or displaced (damnificados), 128 in shelters and 6,183 isolated. Housing impacts reached 17 destroyed homes, 379 with major damage, 2,908 with minor damage and 1,200 still under assessment ¹ ⁵ . The same update reported 24 activations of the Emergency Alert System (SAE) between 1 and 2 August, plus 101,905 electricity customers without power according to SEC information cited in the SENAPRED balance ¹ ⁵ .
The public balance consulted did not include an official monetary estimate of economic losses. For that reason, this post reports the quantified social and material impacts available from SENAPRED: fatalities, affected/displaced people, shelter use, isolation, damaged housing, electricity outages, interrupted roads, evacuations and alerts for river rises, overflows, landslides, wind and convective clouds.
Summary Infographic
Contents
- A national balance that worsened over the weekend
- La Araucanía, Biobío and Ñuble: the emergency core
- Regional report, south to north:
- What this event tells us about hydrometeorological risk
- Recommendations for exposed communities
- Sources
A national balance that worsened over the weekend
The frontal system entered on Thursday 30 July and intensified again during the weekend. On Saturday 1 August, the national balance mentioned 206 affected/displaced people and 1,284 isolated people. Around 24 hours later, those figures had more than doubled and nearly quintupled, respectively ¹⁶ ⁵ .
The most serious episode occurred that Saturday afternoon in Panguipulli, Los Ríos. A tree brought down by the wind fell on a pickup truck on the road to Licán Ray, in the Pata de Gallo sector, killing both occupants: Maximiliano Ferrada Peña, 41, second commander of the Villarrica Fire Department, and his partner Génesis Molina Bermedo, 25, who was three months pregnant ³ ⁴ .
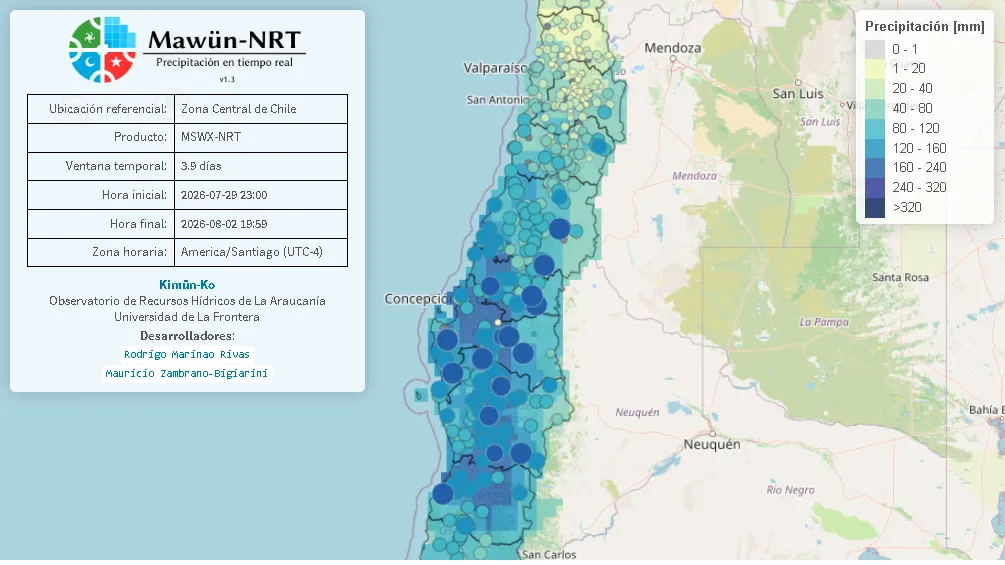
Ñuble had the highest number of affected/displaced people in the national balance, with 172. It was followed by O’Higgins (91), La Araucanía (84) and Los Ríos (55). Isolation was concentrated far more strongly in La Araucanía, with 5,032 isolated people, ahead of Maule (317), Los Lagos (300), Biobío (252) and Ñuble (234) ⁵ . Basic services were also heavily affected: the SENAPRED/SEC balance cited by La Tercera reported 101,905 electricity customers without supply, especially in Maule, O’Higgins and La Araucanía ⁵ .
La Araucanía, Biobío and Ñuble: the emergency core
Although the frontal system affected a wide part of south-central Chile, the most severe impacts on connectivity, infrastructure and daily life were concentrated in La Araucanía, Biobío and Ñuble.
In La Araucanía, roughly half of the communes reported some degree of impact from flooding and overflowing channels, according to regional authorities ² . Angol was the most affected commune, with 76 affected/displaced people, 25 homes with major damage and 35 with minor damage; municipal classes were suspended and security patrols were deployed around evacuated homes ¹³ ² . Landslides, ground failures and road washouts were also reported in Teodoro Schmidt and Victoria ¹⁶ . The Ministry of Education suspended classes on Monday 3 August in eleven communes of the region ¹⁴ .
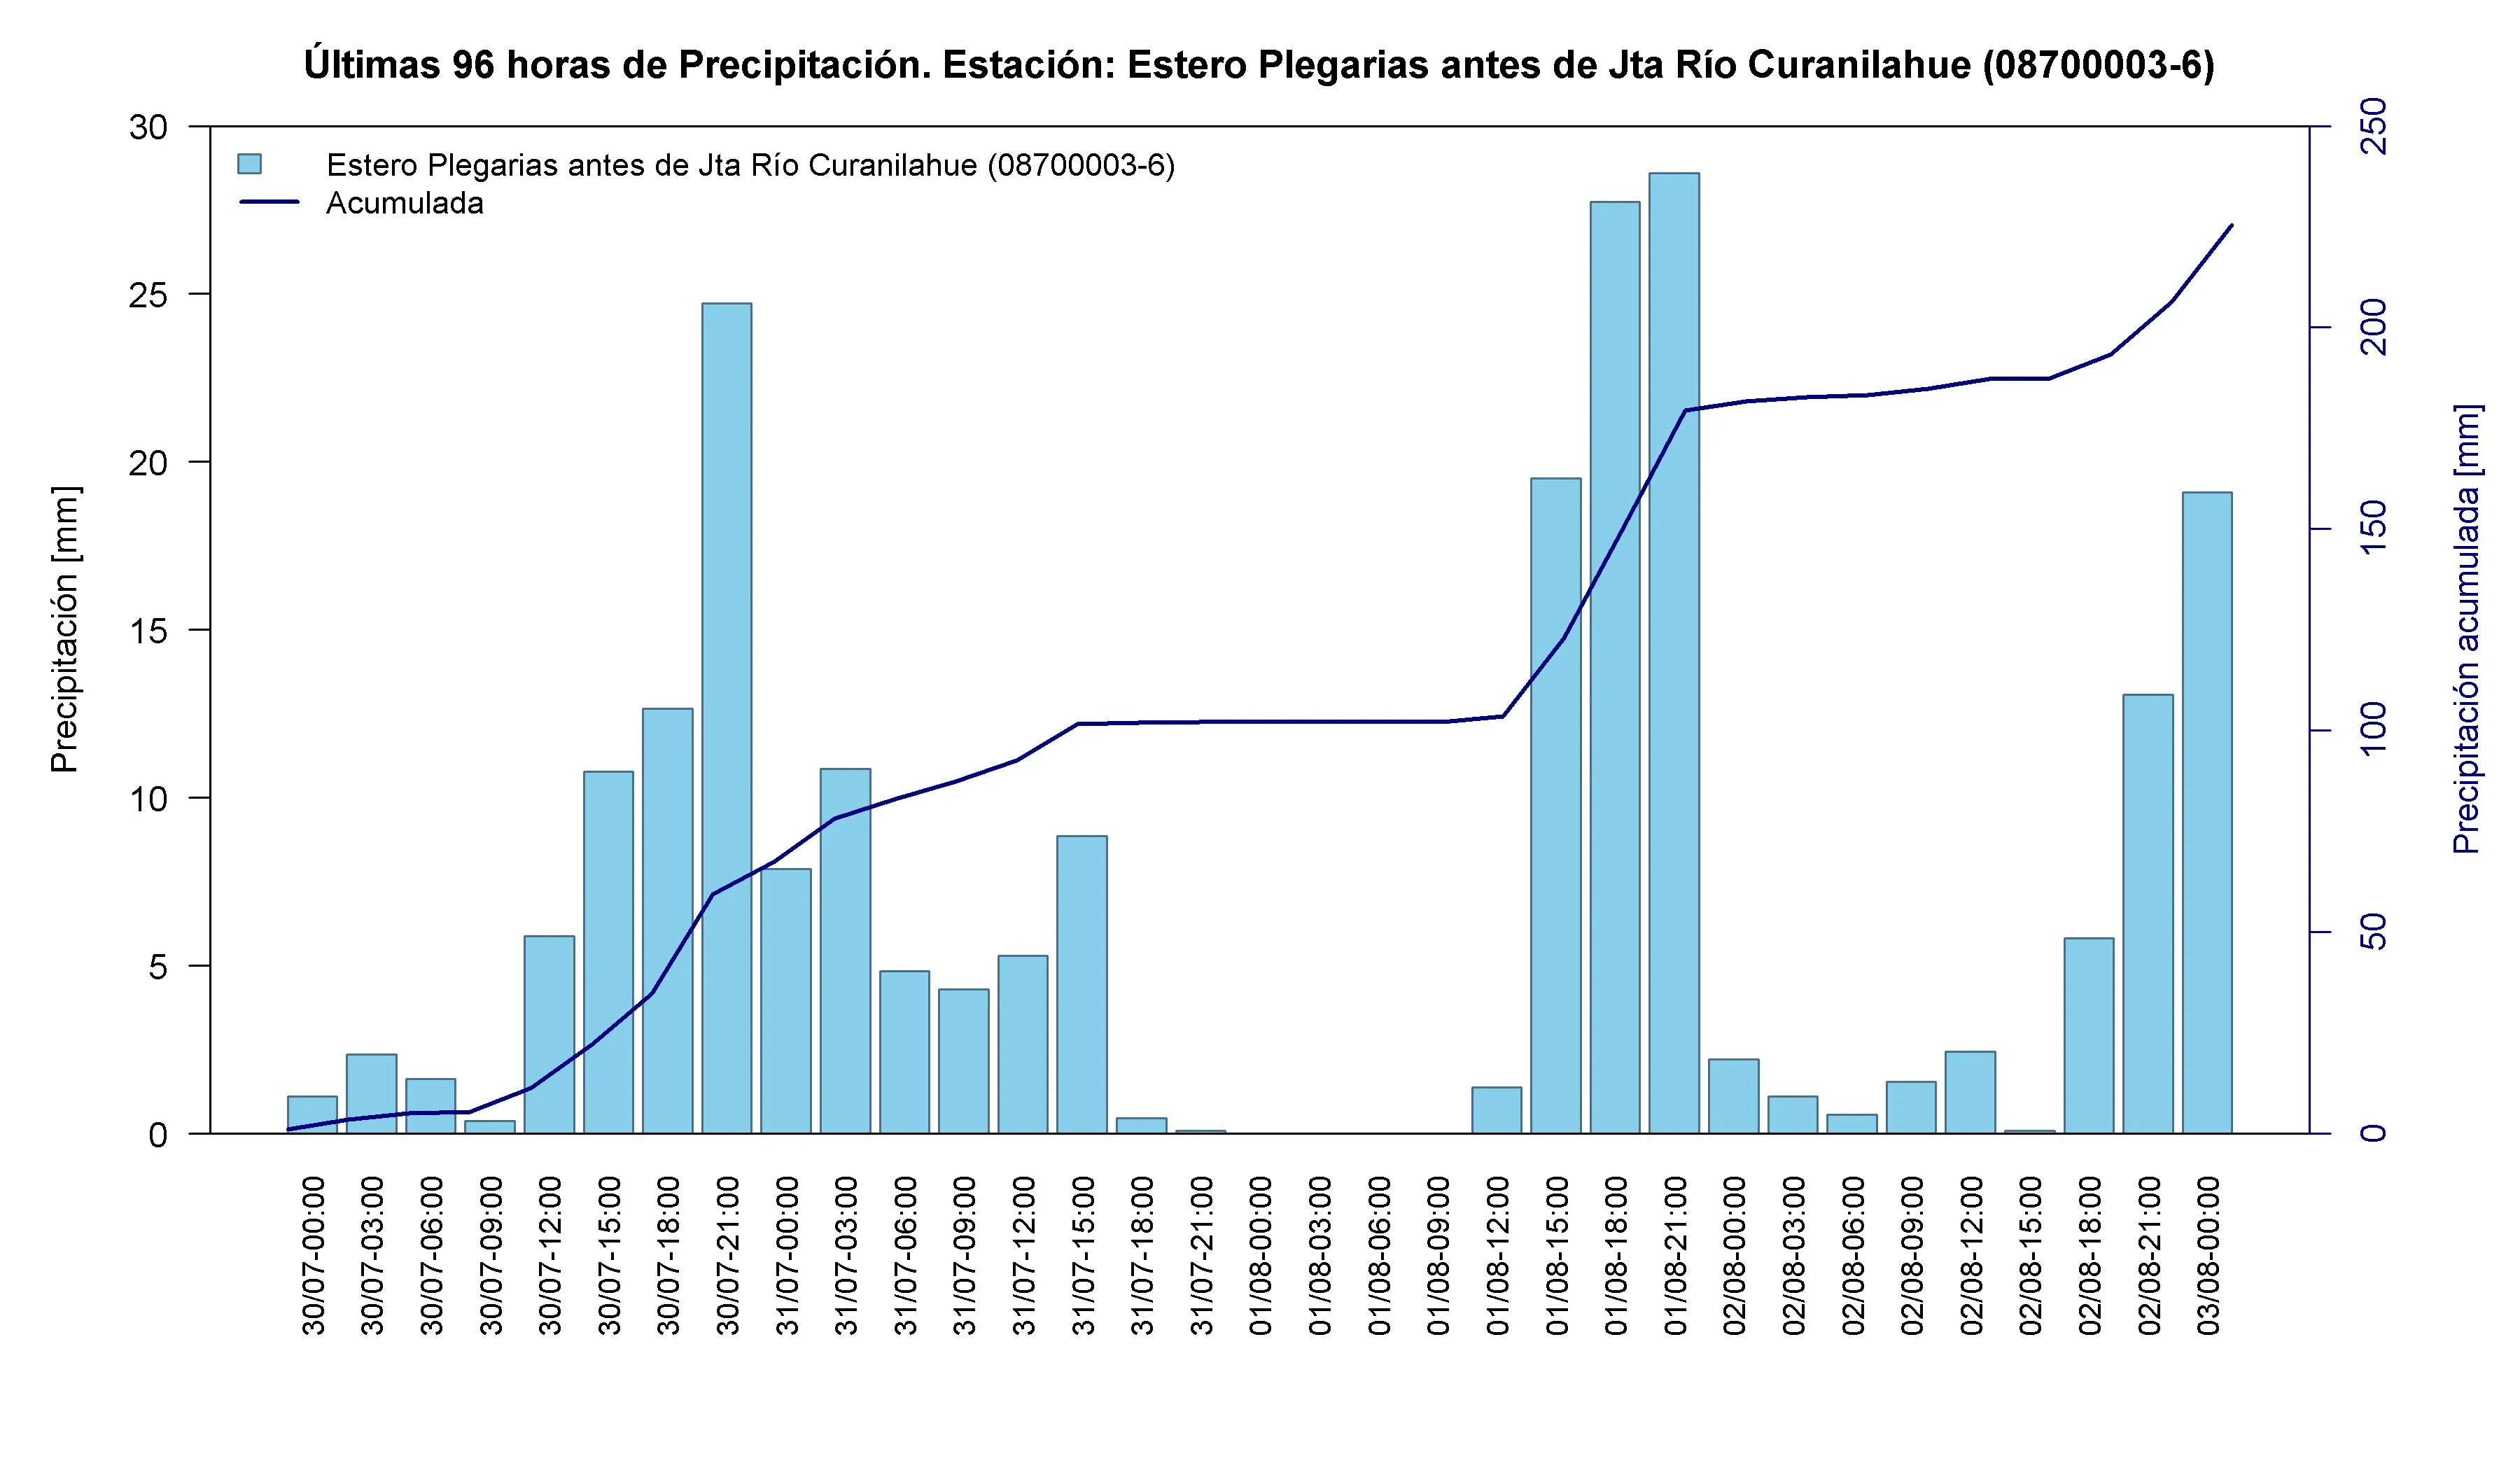
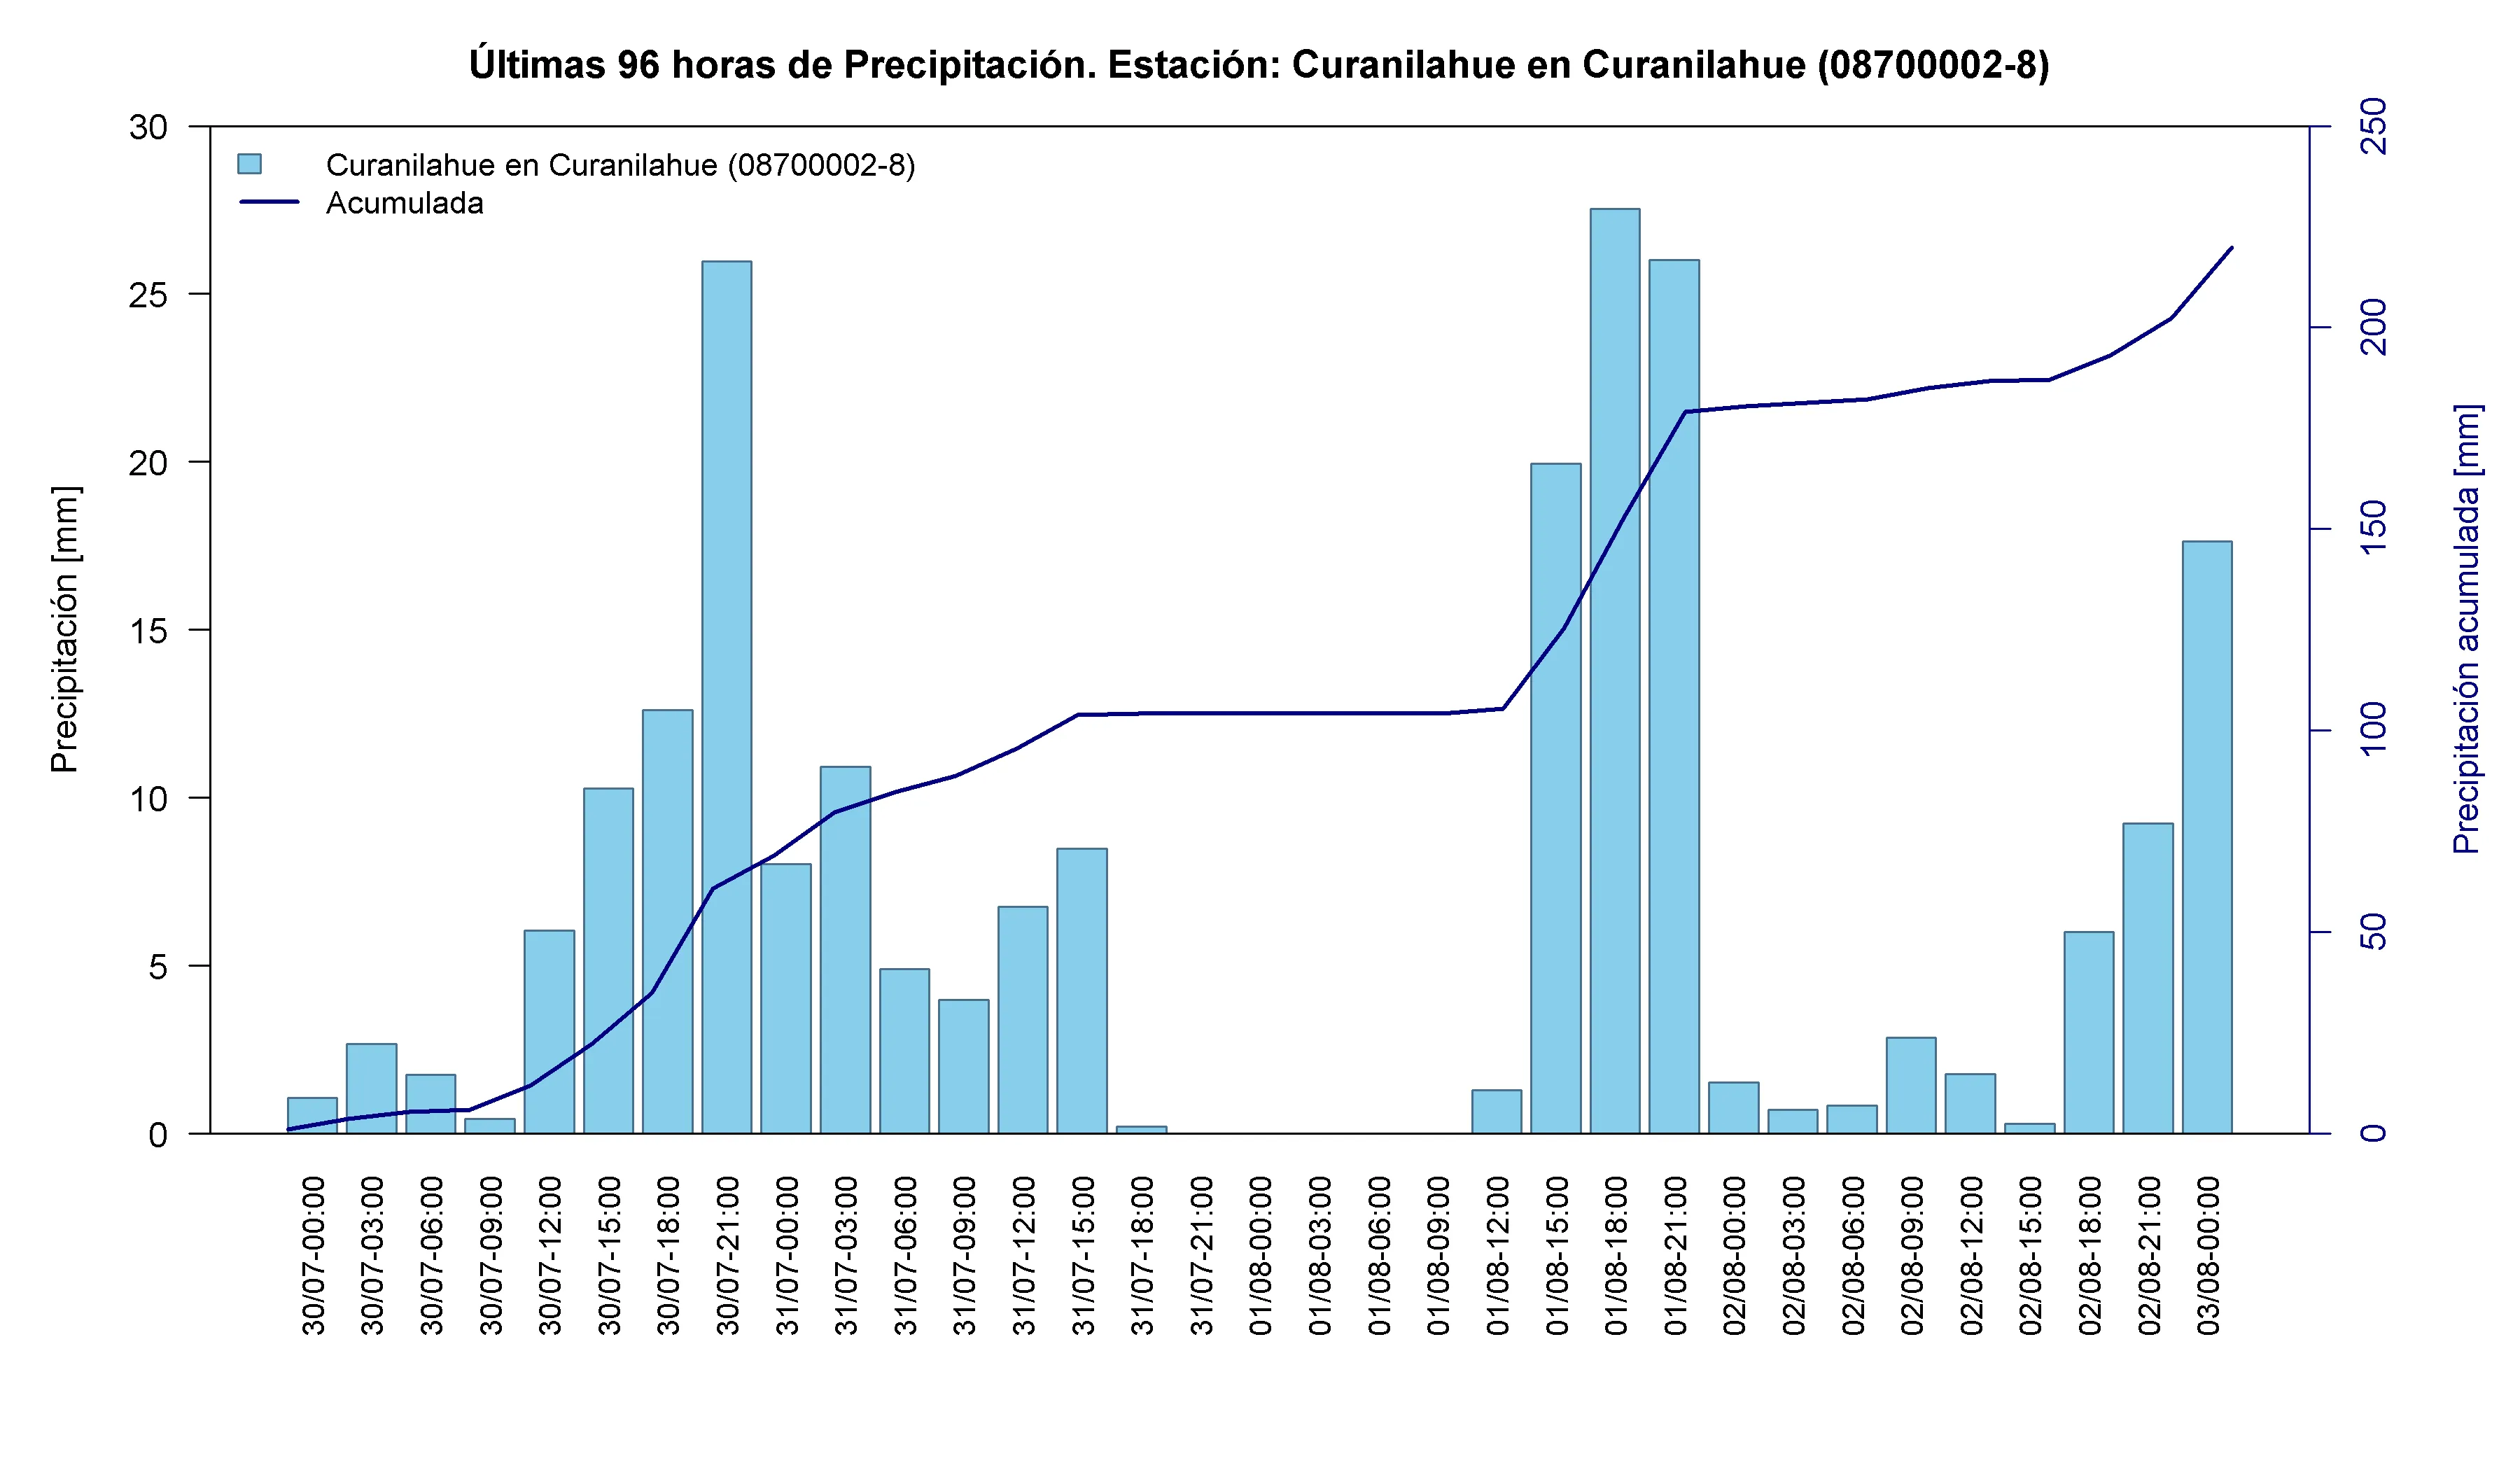
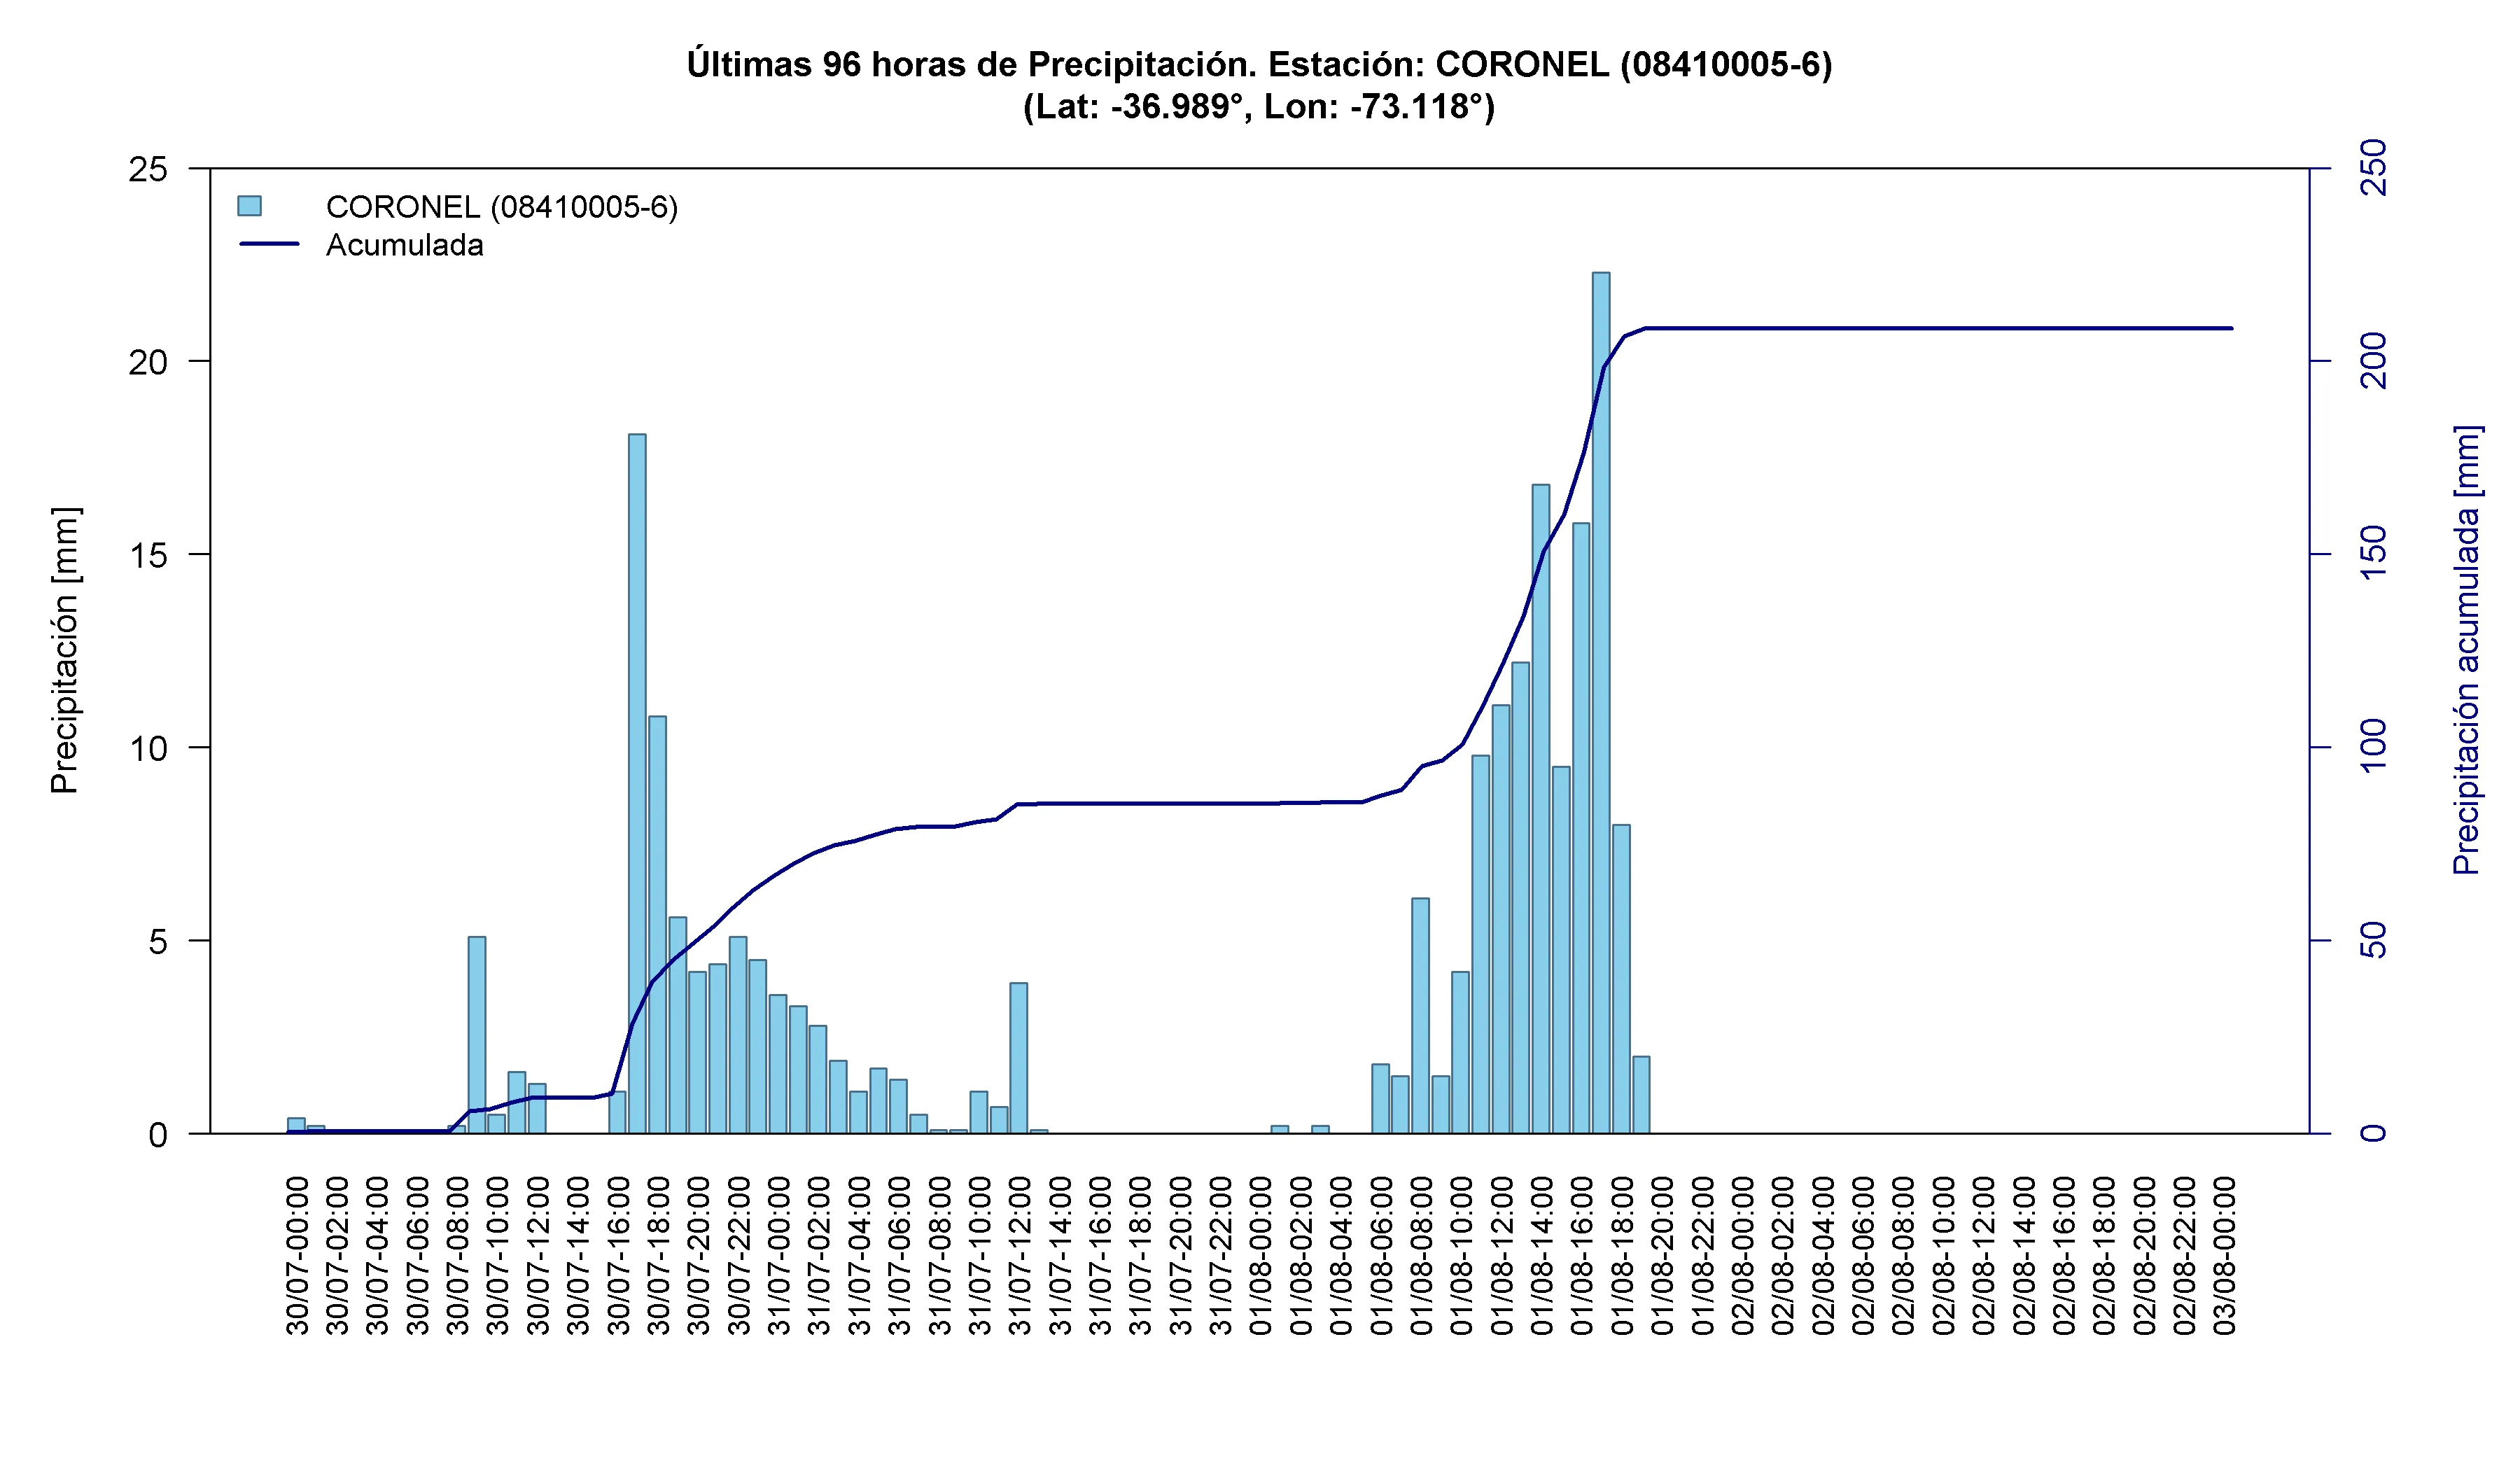
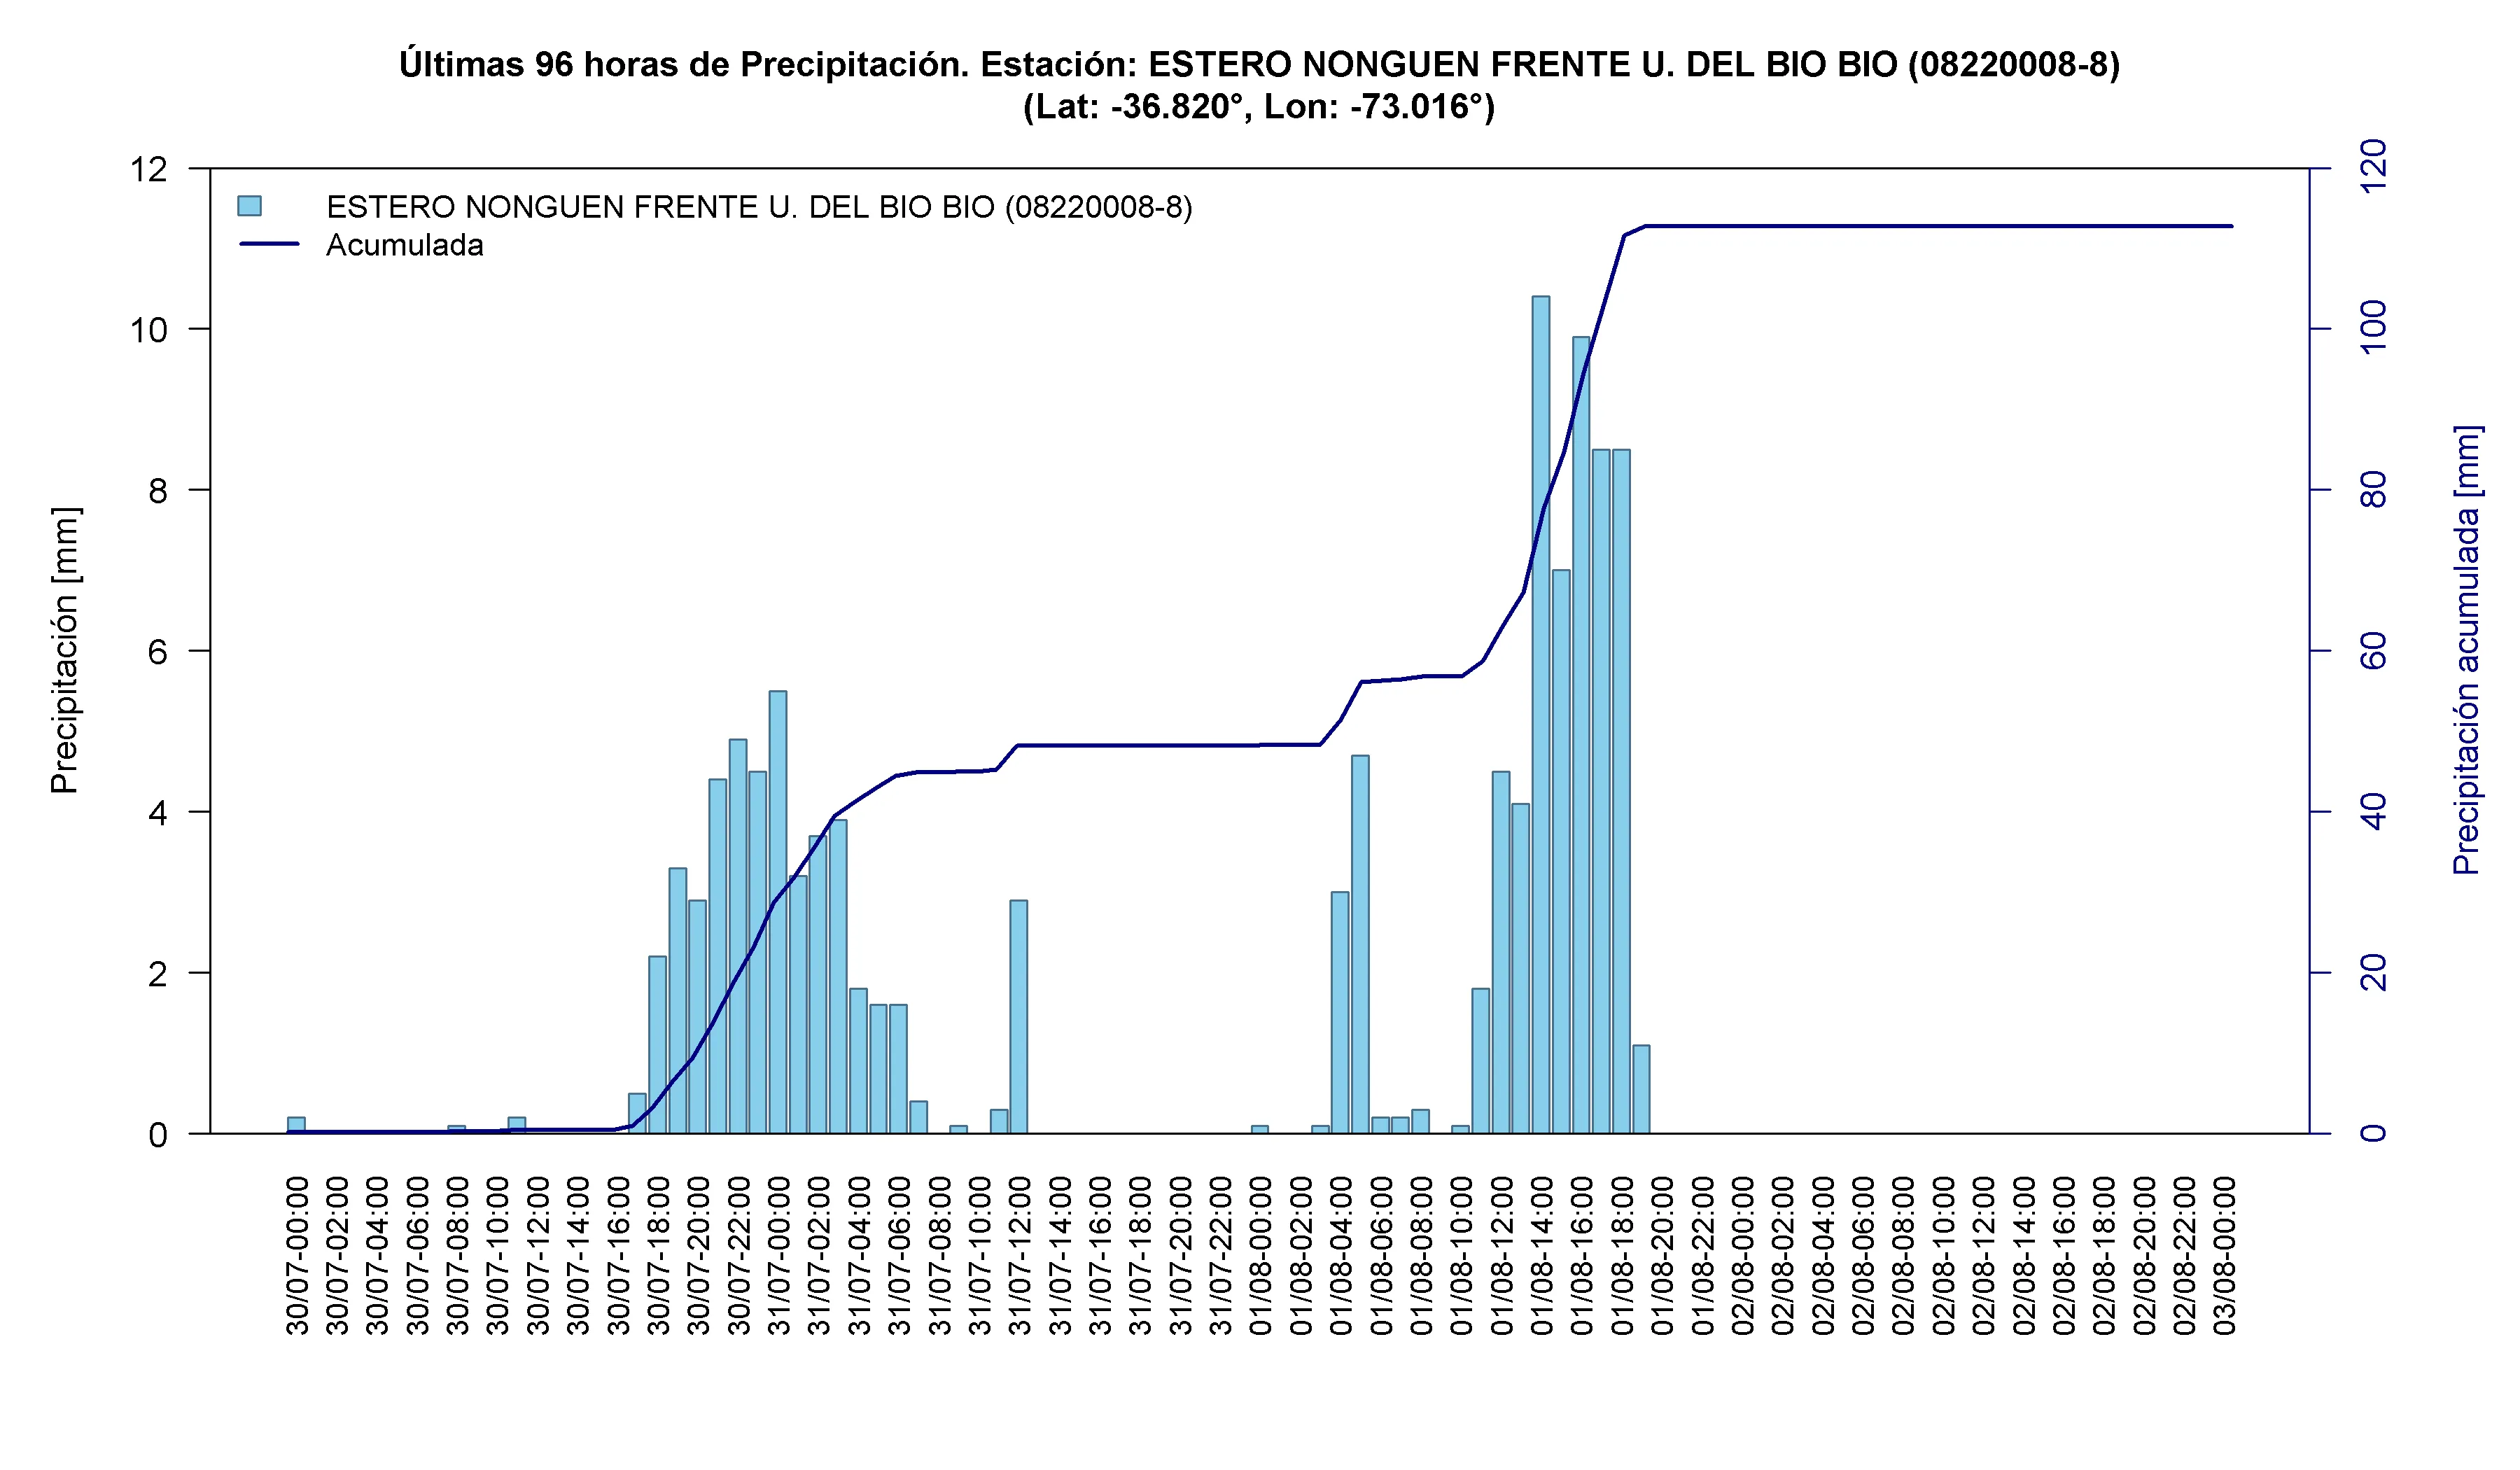
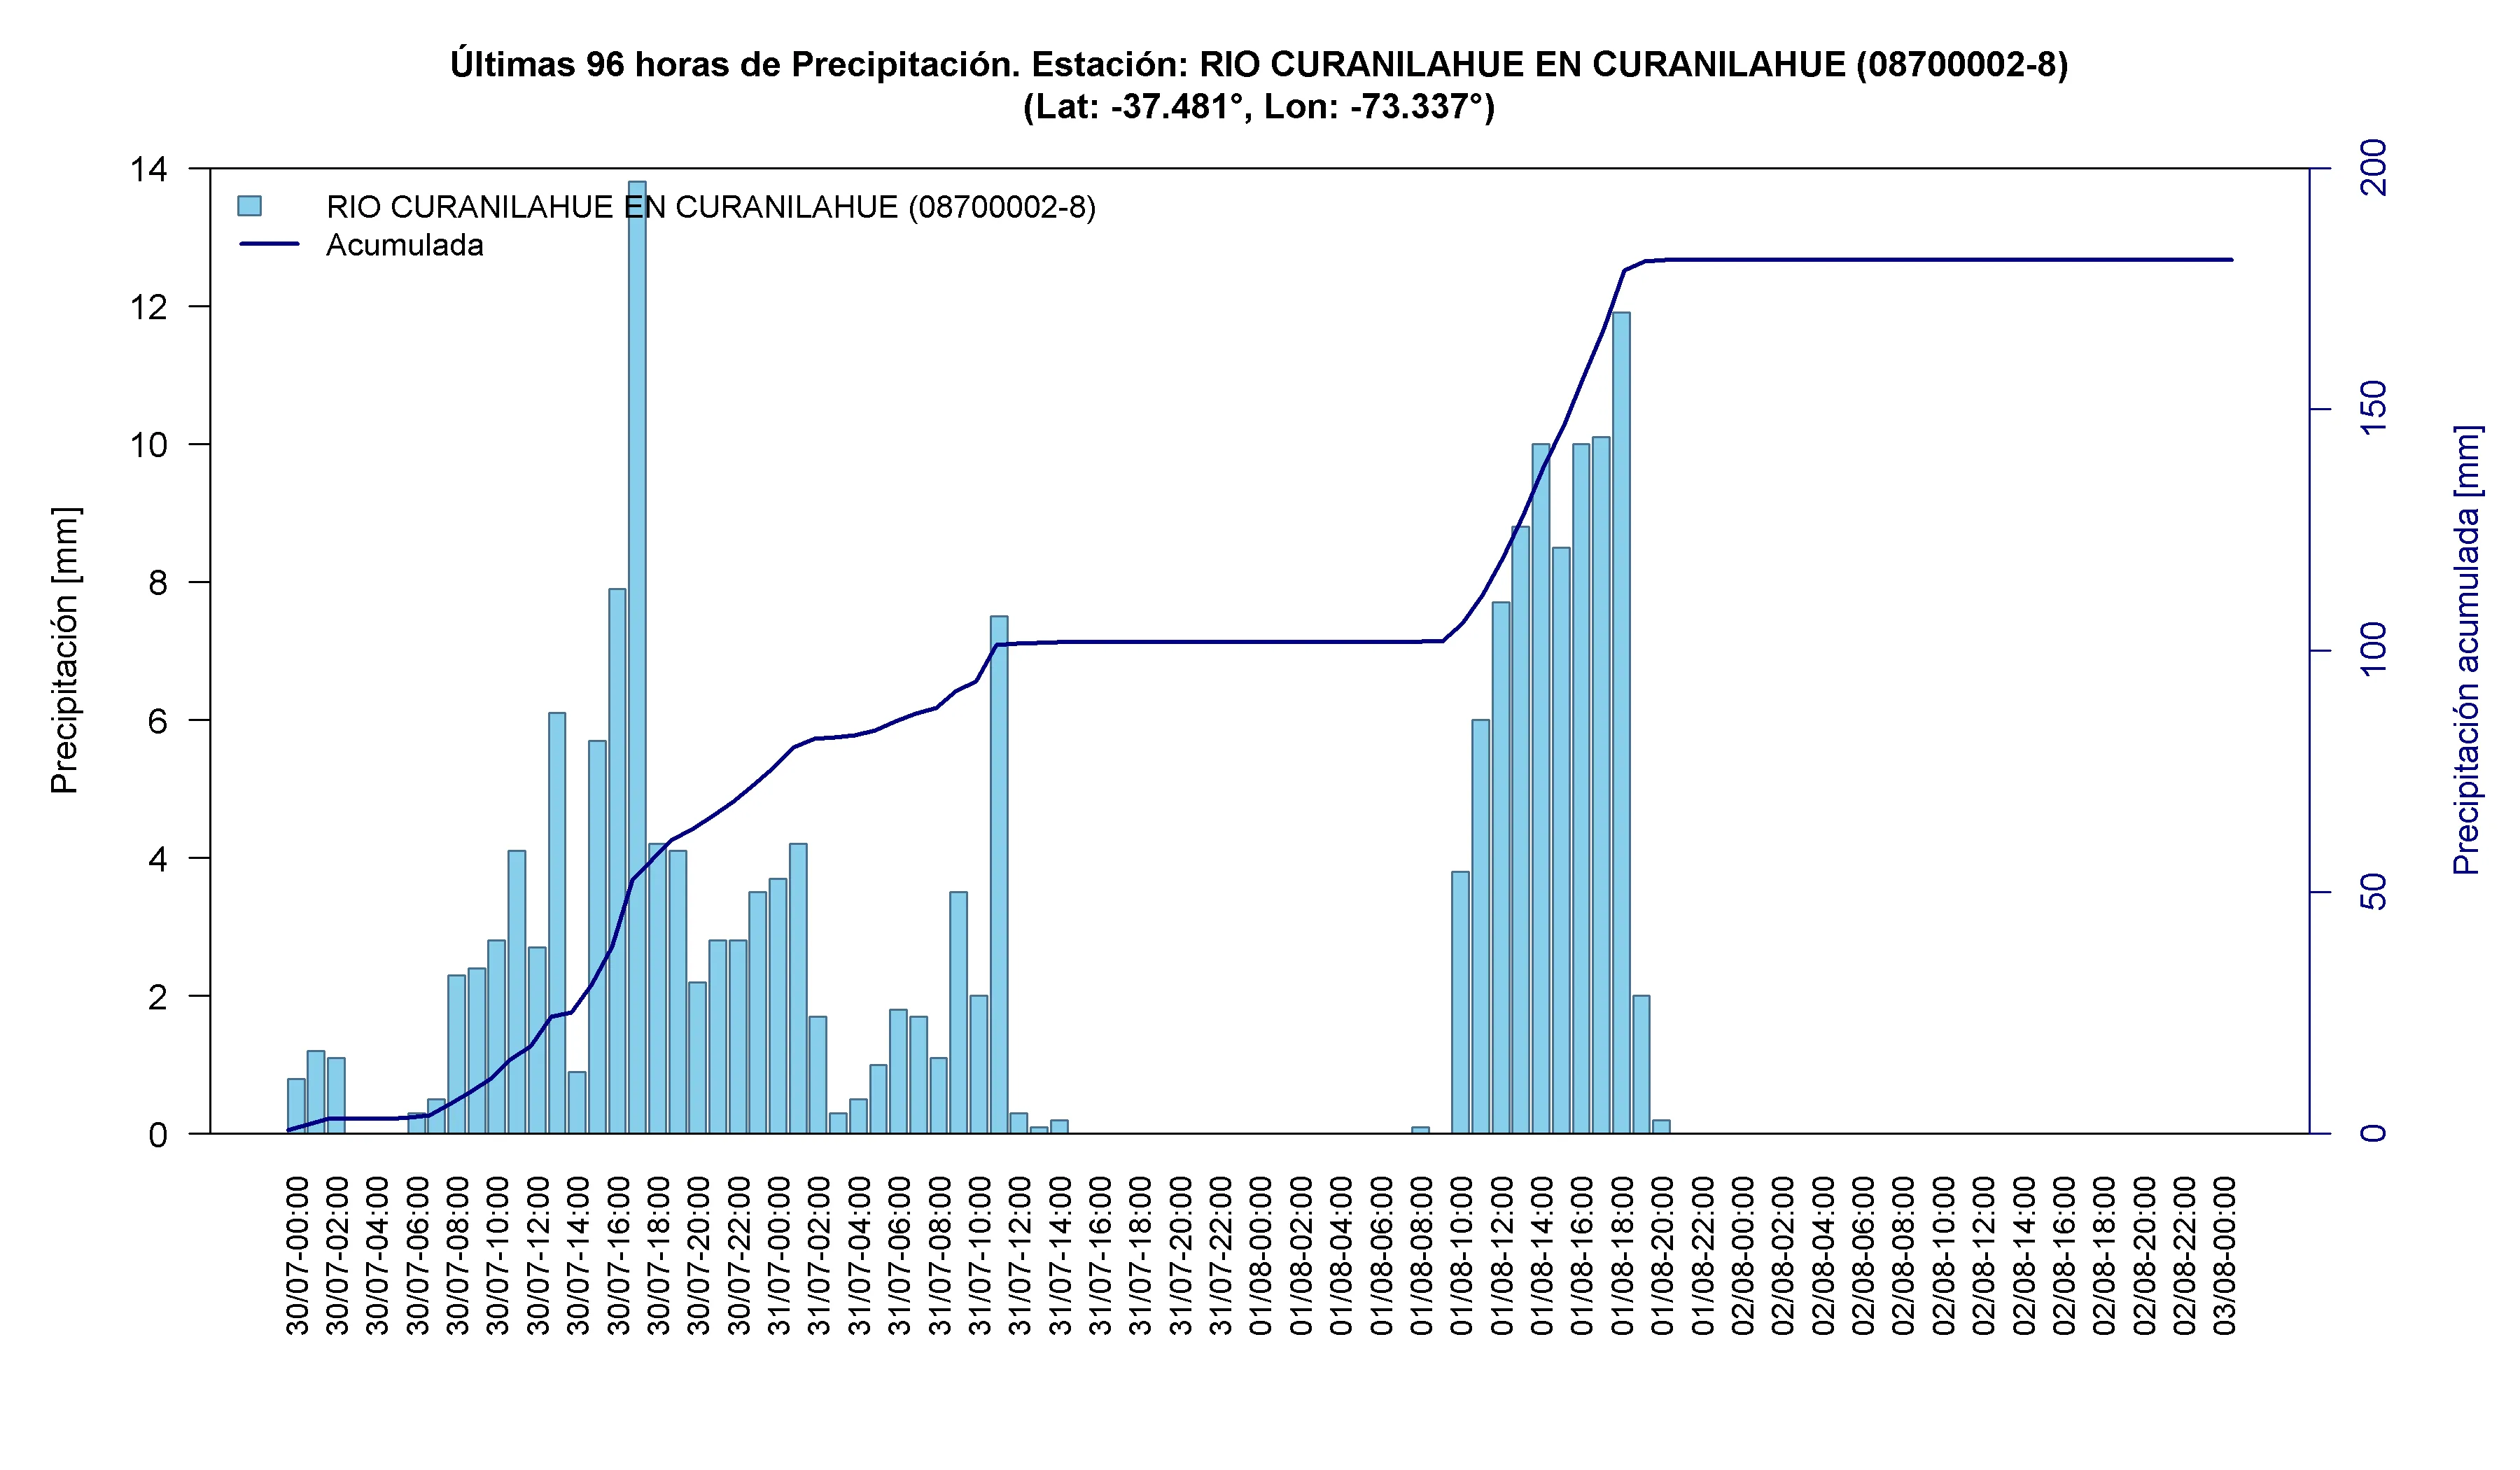
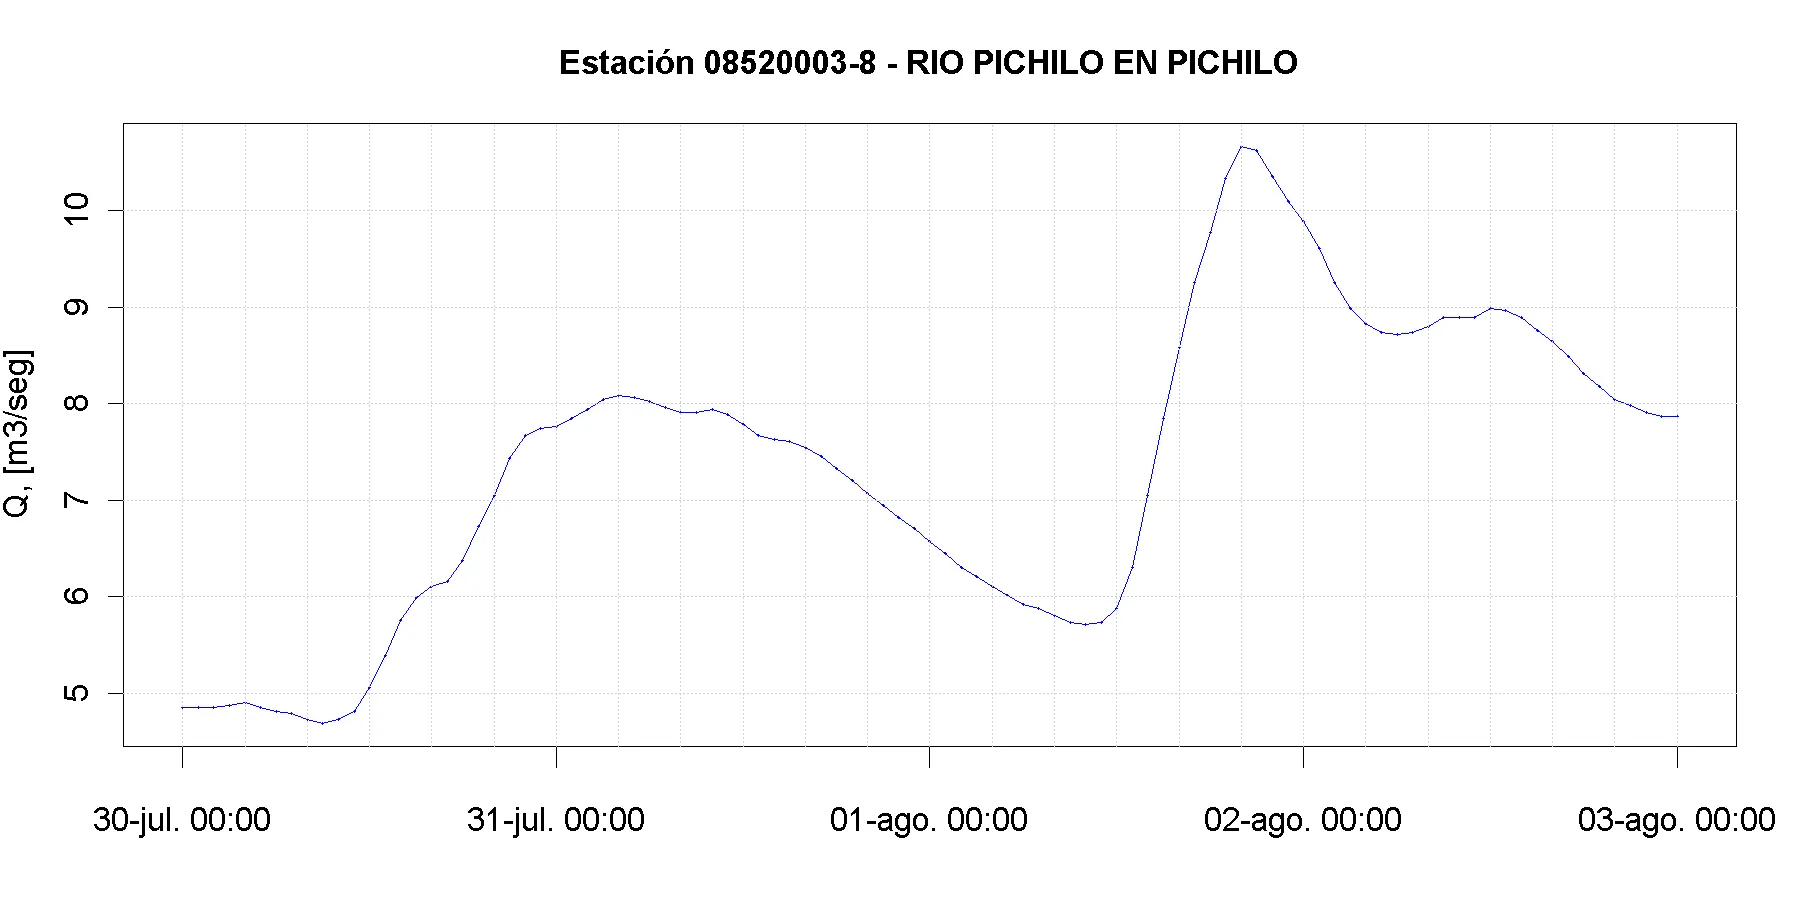
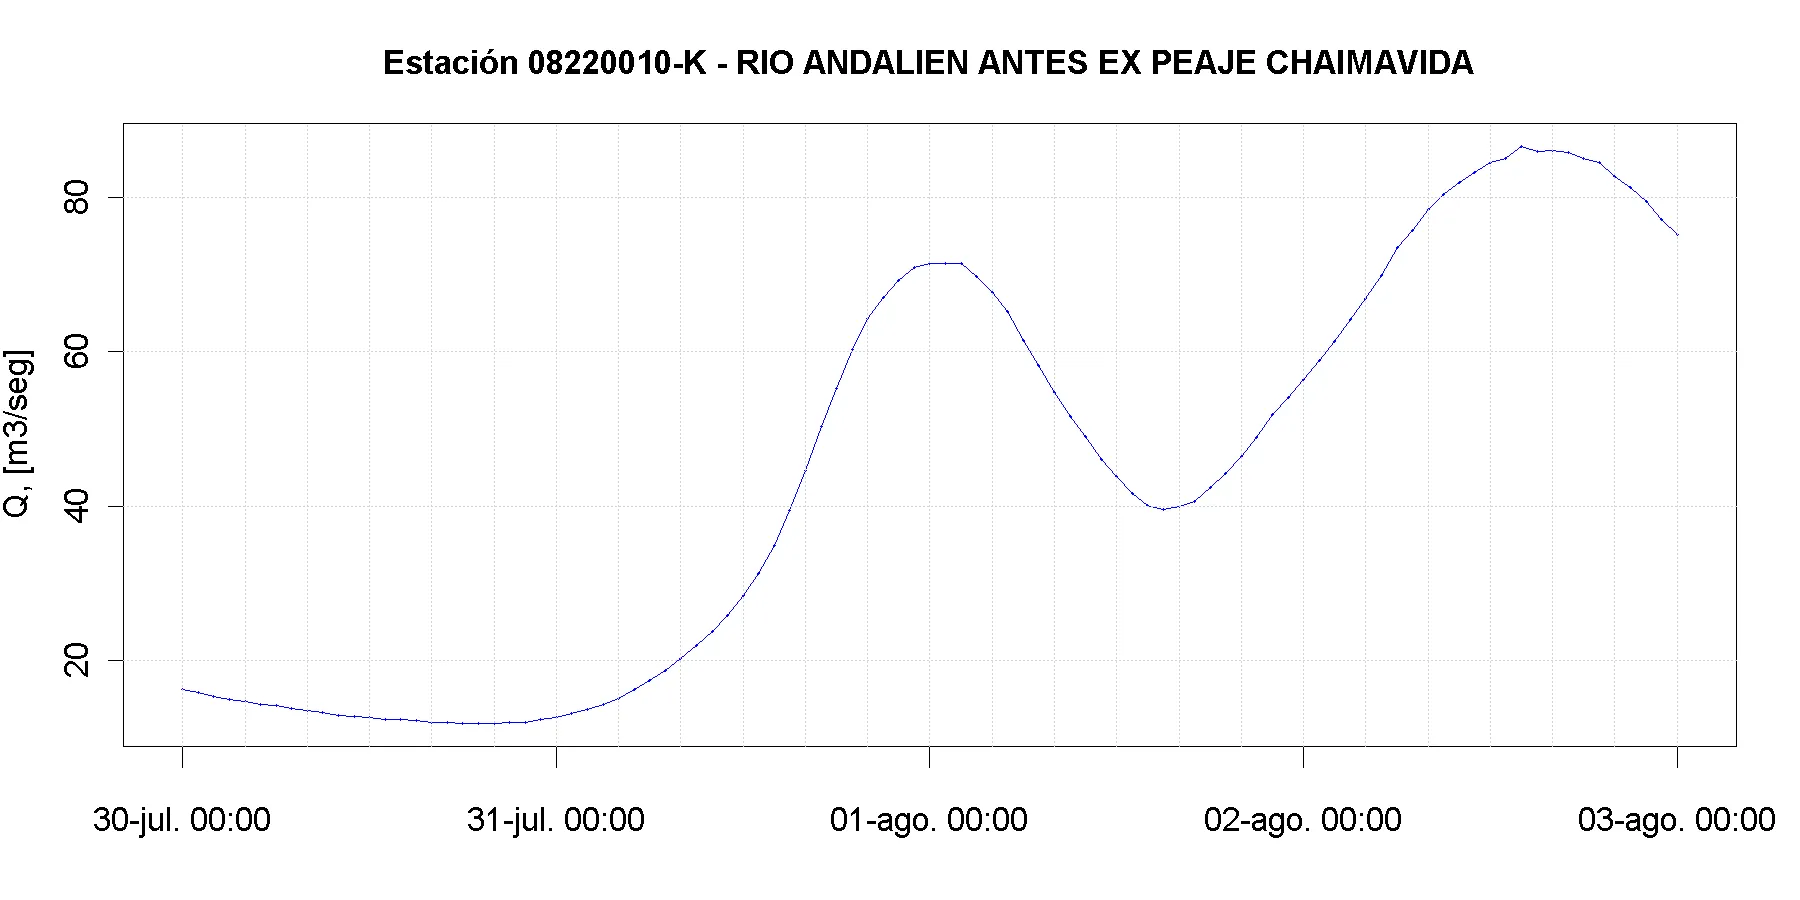
In Biobío, SENAPRED escalated the region to Red Alert on Saturday 1 August due to sustained increases in river and streamflow levels ⁶ . The main impacts were reported in Curanilahue, Cañete, Arauco, Nacimiento, Penco, Tomé, Concepción and Alto Biobío, after rainfall totals of up to 111 mm in the Nahuelbuta range, with local overflows in the Pichilo and Lía rivers in Arauco and the Andalién River in Concepción ⁷ ⁸ ⁹ .
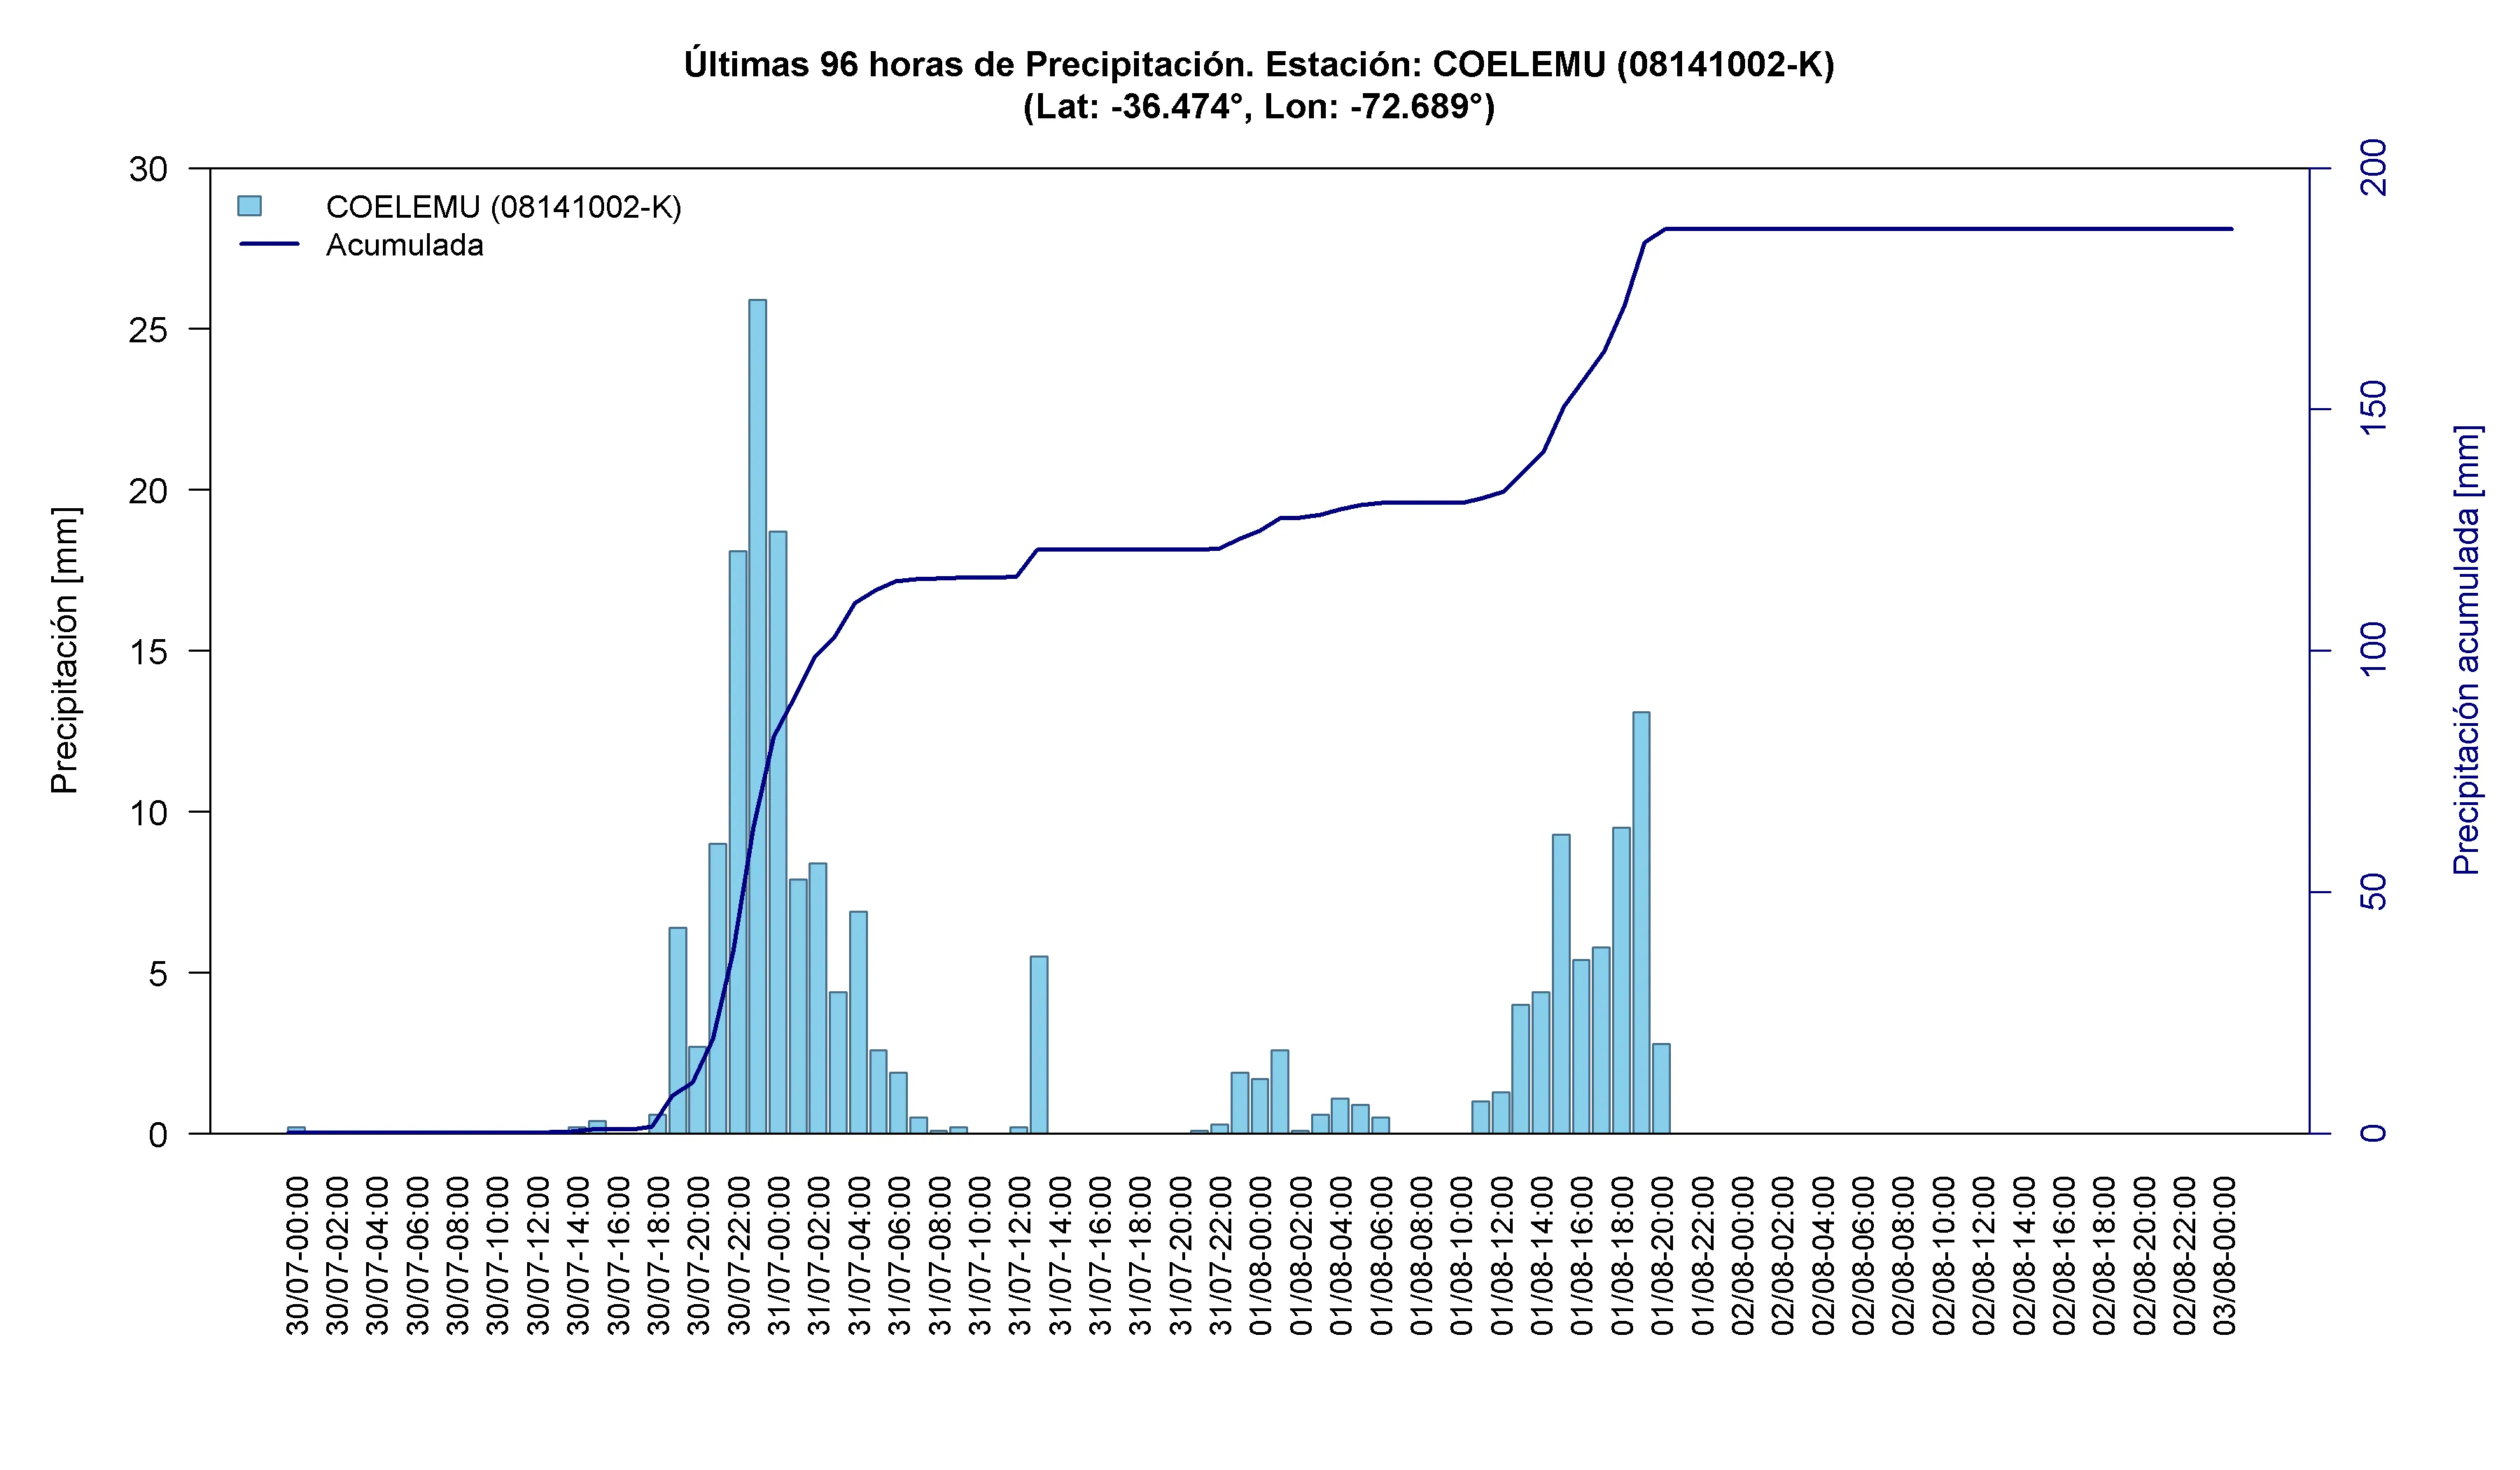
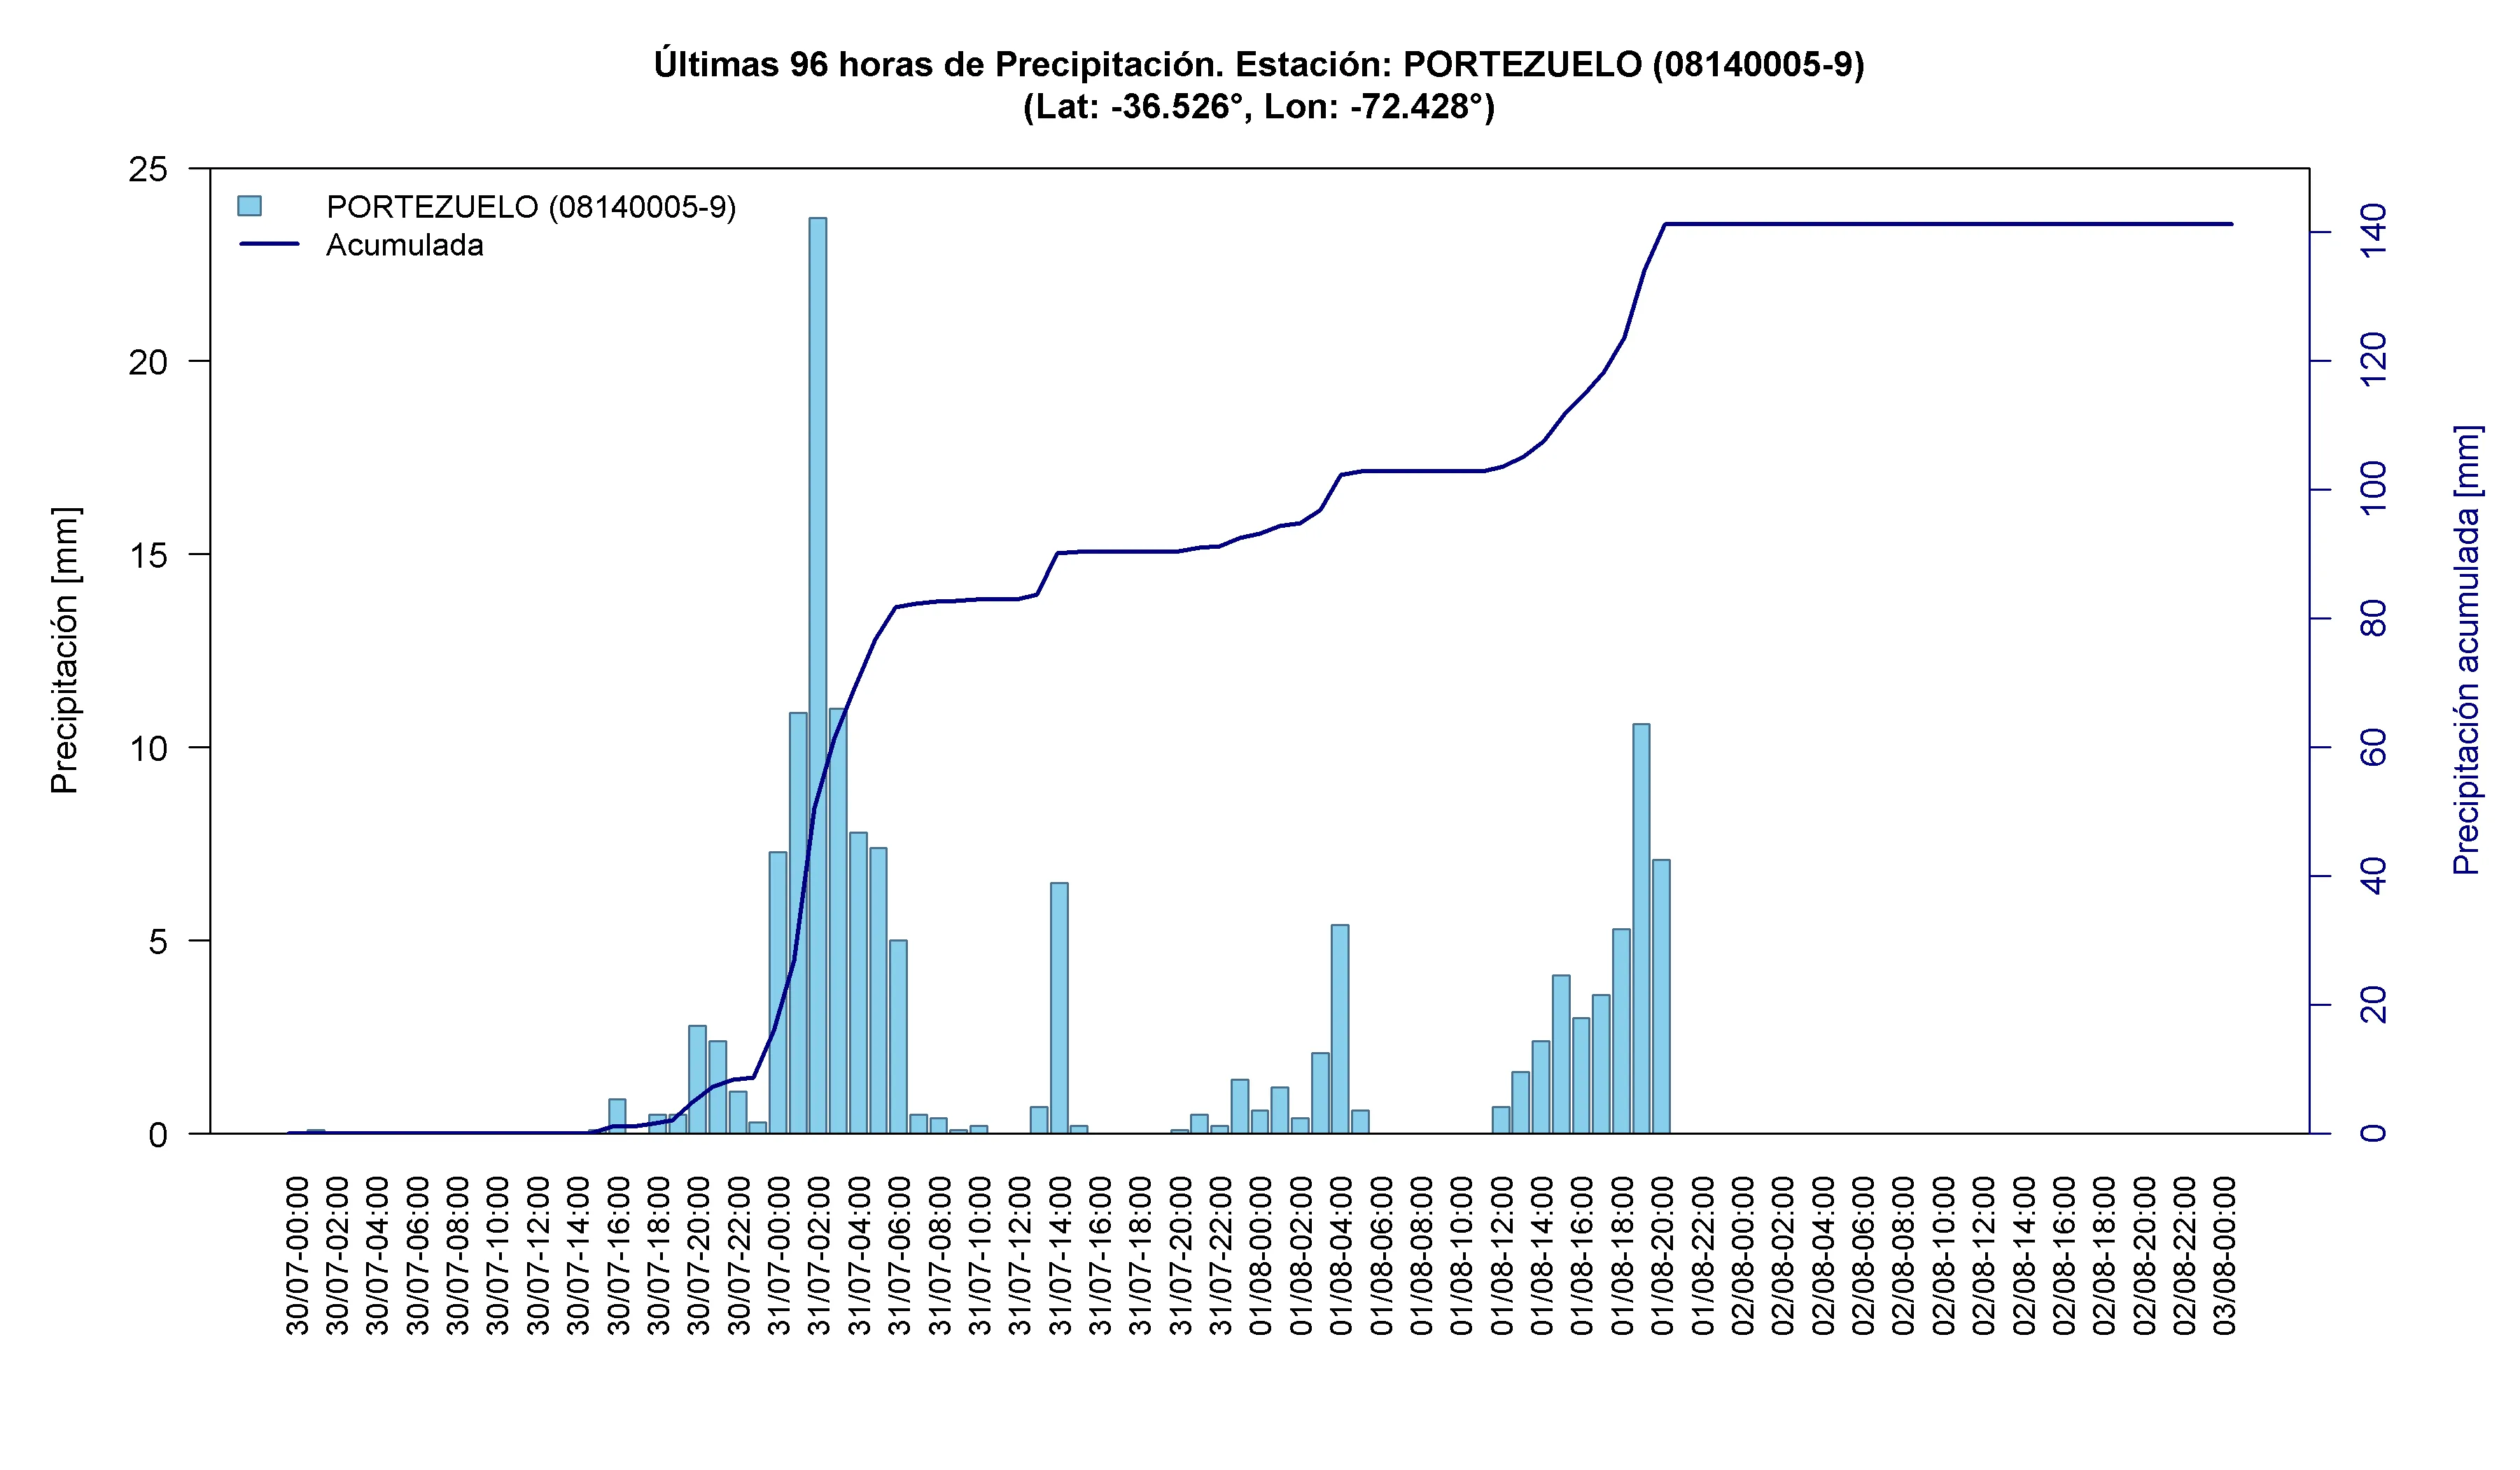
In Ñuble, the region led the national count of affected/displaced people with 172 ⁵ . Under Red Alert since 31 July, preventive evacuations focused on Coelemu and Ránquil ¹⁰ ² . In Punilla Province, local reporting counted 637 affected people and 77 affected/displaced people, while a washout in San Carlos forced reinforcement of three riverside sectors ¹¹ . Eight of the eleven affected roads in the region were left without connectivity ¹² .
The rainfall hazard was compounded by wind and convective instability. On Saturday 1 August, the Chilean Meteorological Directorate warned of clouds with tornado-like characteristics between La Araucanía, Los Ríos and Los Lagos, while maritime authorities warned of waterspouts between Maule and Los Ríos ¹⁸ ²⁰ .
Los Ríos Region
Los Ríos was the scene of the fatal Panguipulli accident. The region also contributed 55 affected/displaced people to the national balance, the fourth-highest regional count ⁵ , and reported a collapsed bridge in Panguipulli plus roads made impassable by flooding ¹⁶ .
Map 1. Location of the rain-gauge stations analyzed in Los Ríos during the 30 July-2 August 2026 frontal system. Source: own elaboration based on data from the Visualizador Meteorológico (VisMet) .
Table 1. Accumulated precipitation at rain-gauge stations in Los Ríos between 30 July and 2 August 2026. Source: own elaboration based on VisMet data.
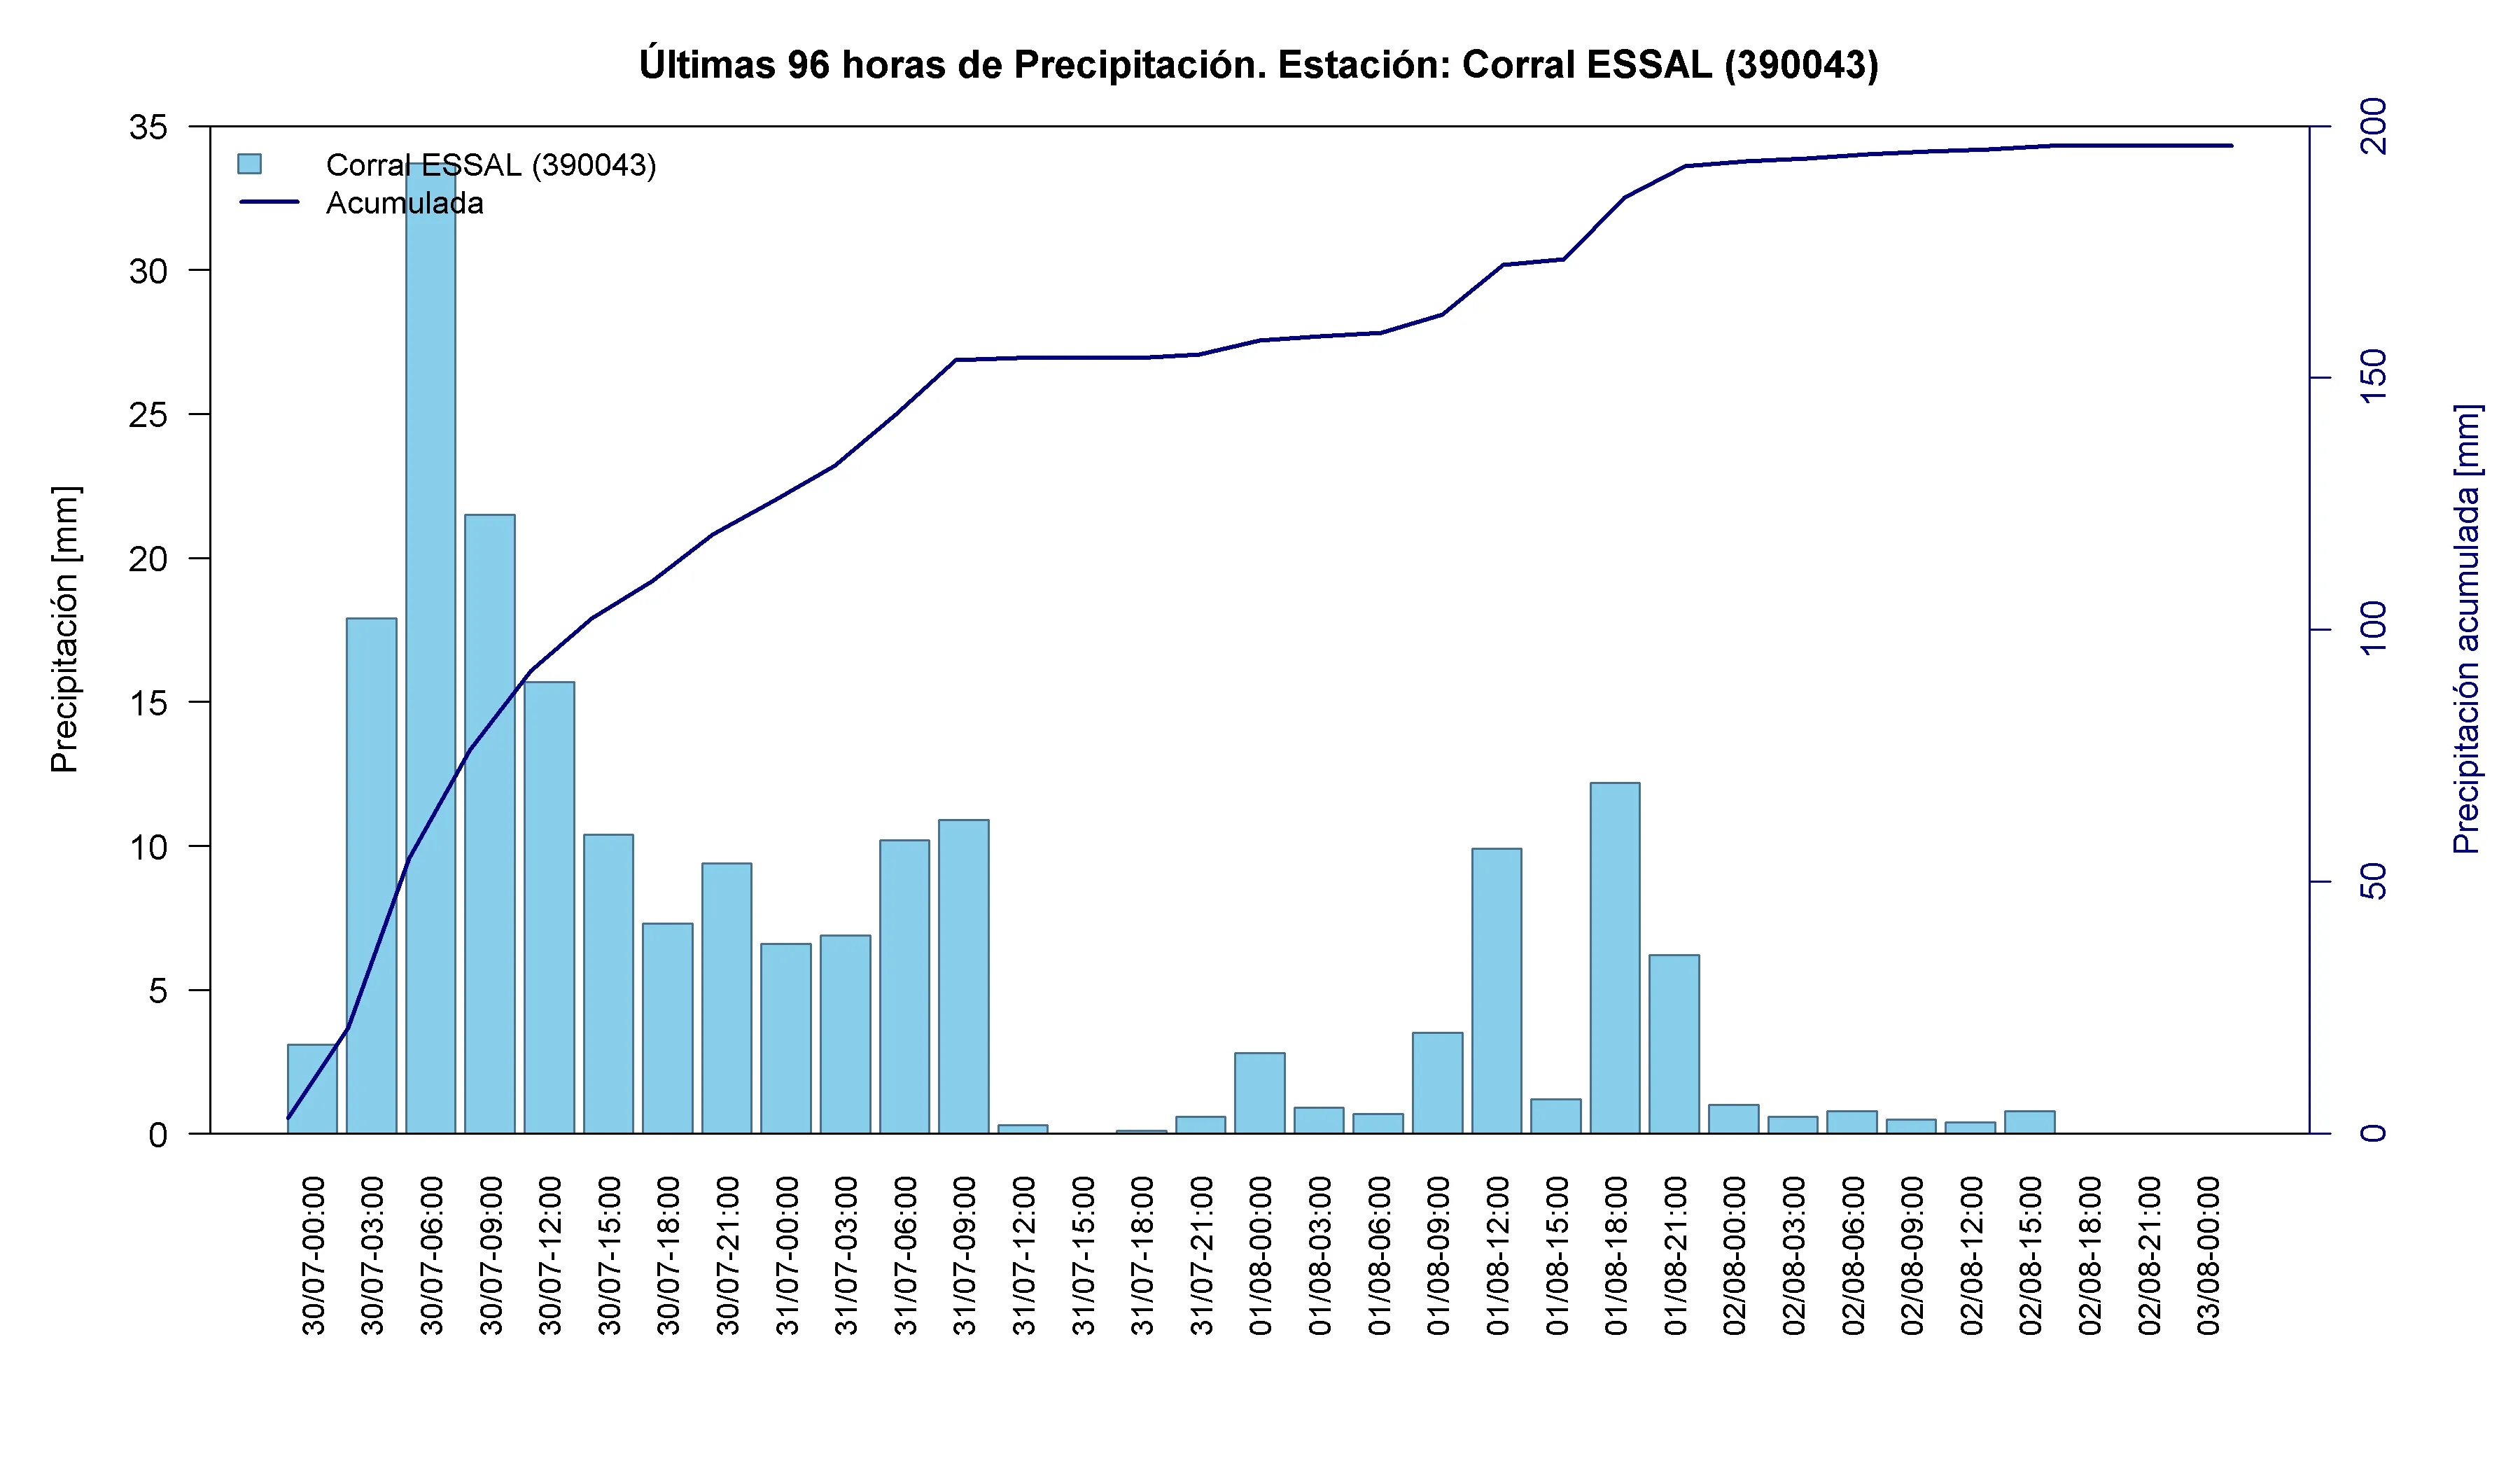
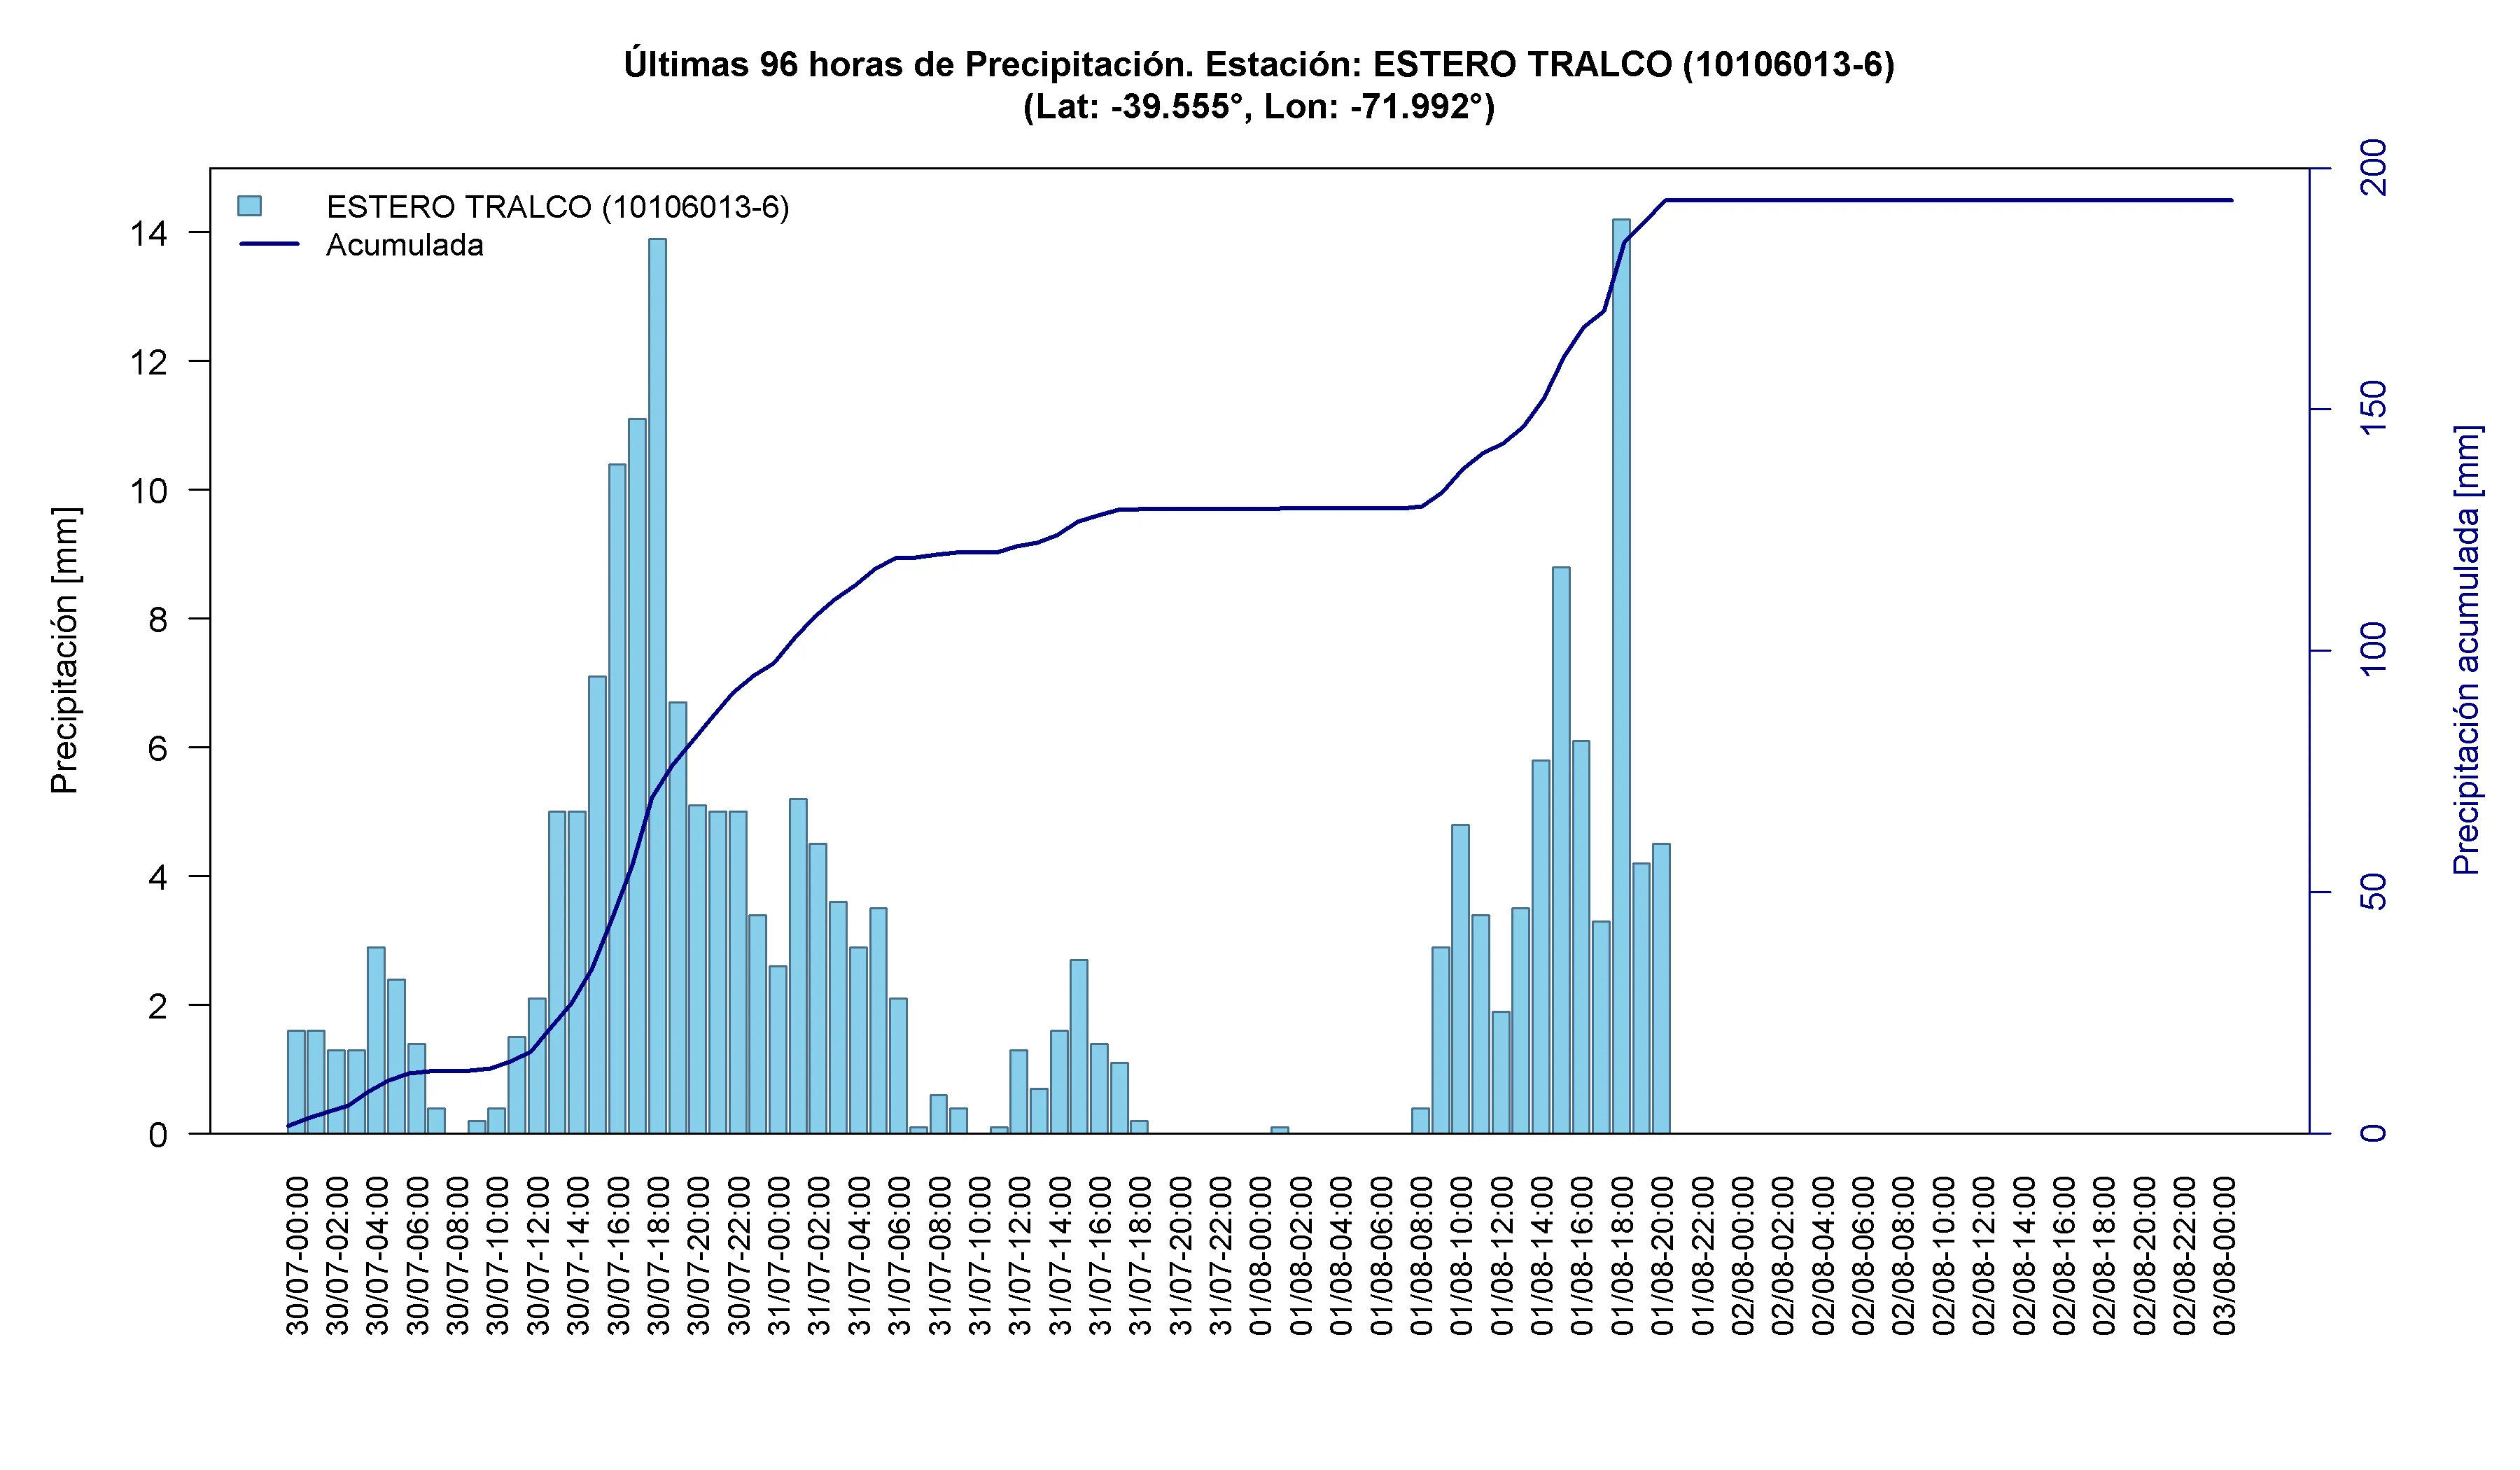
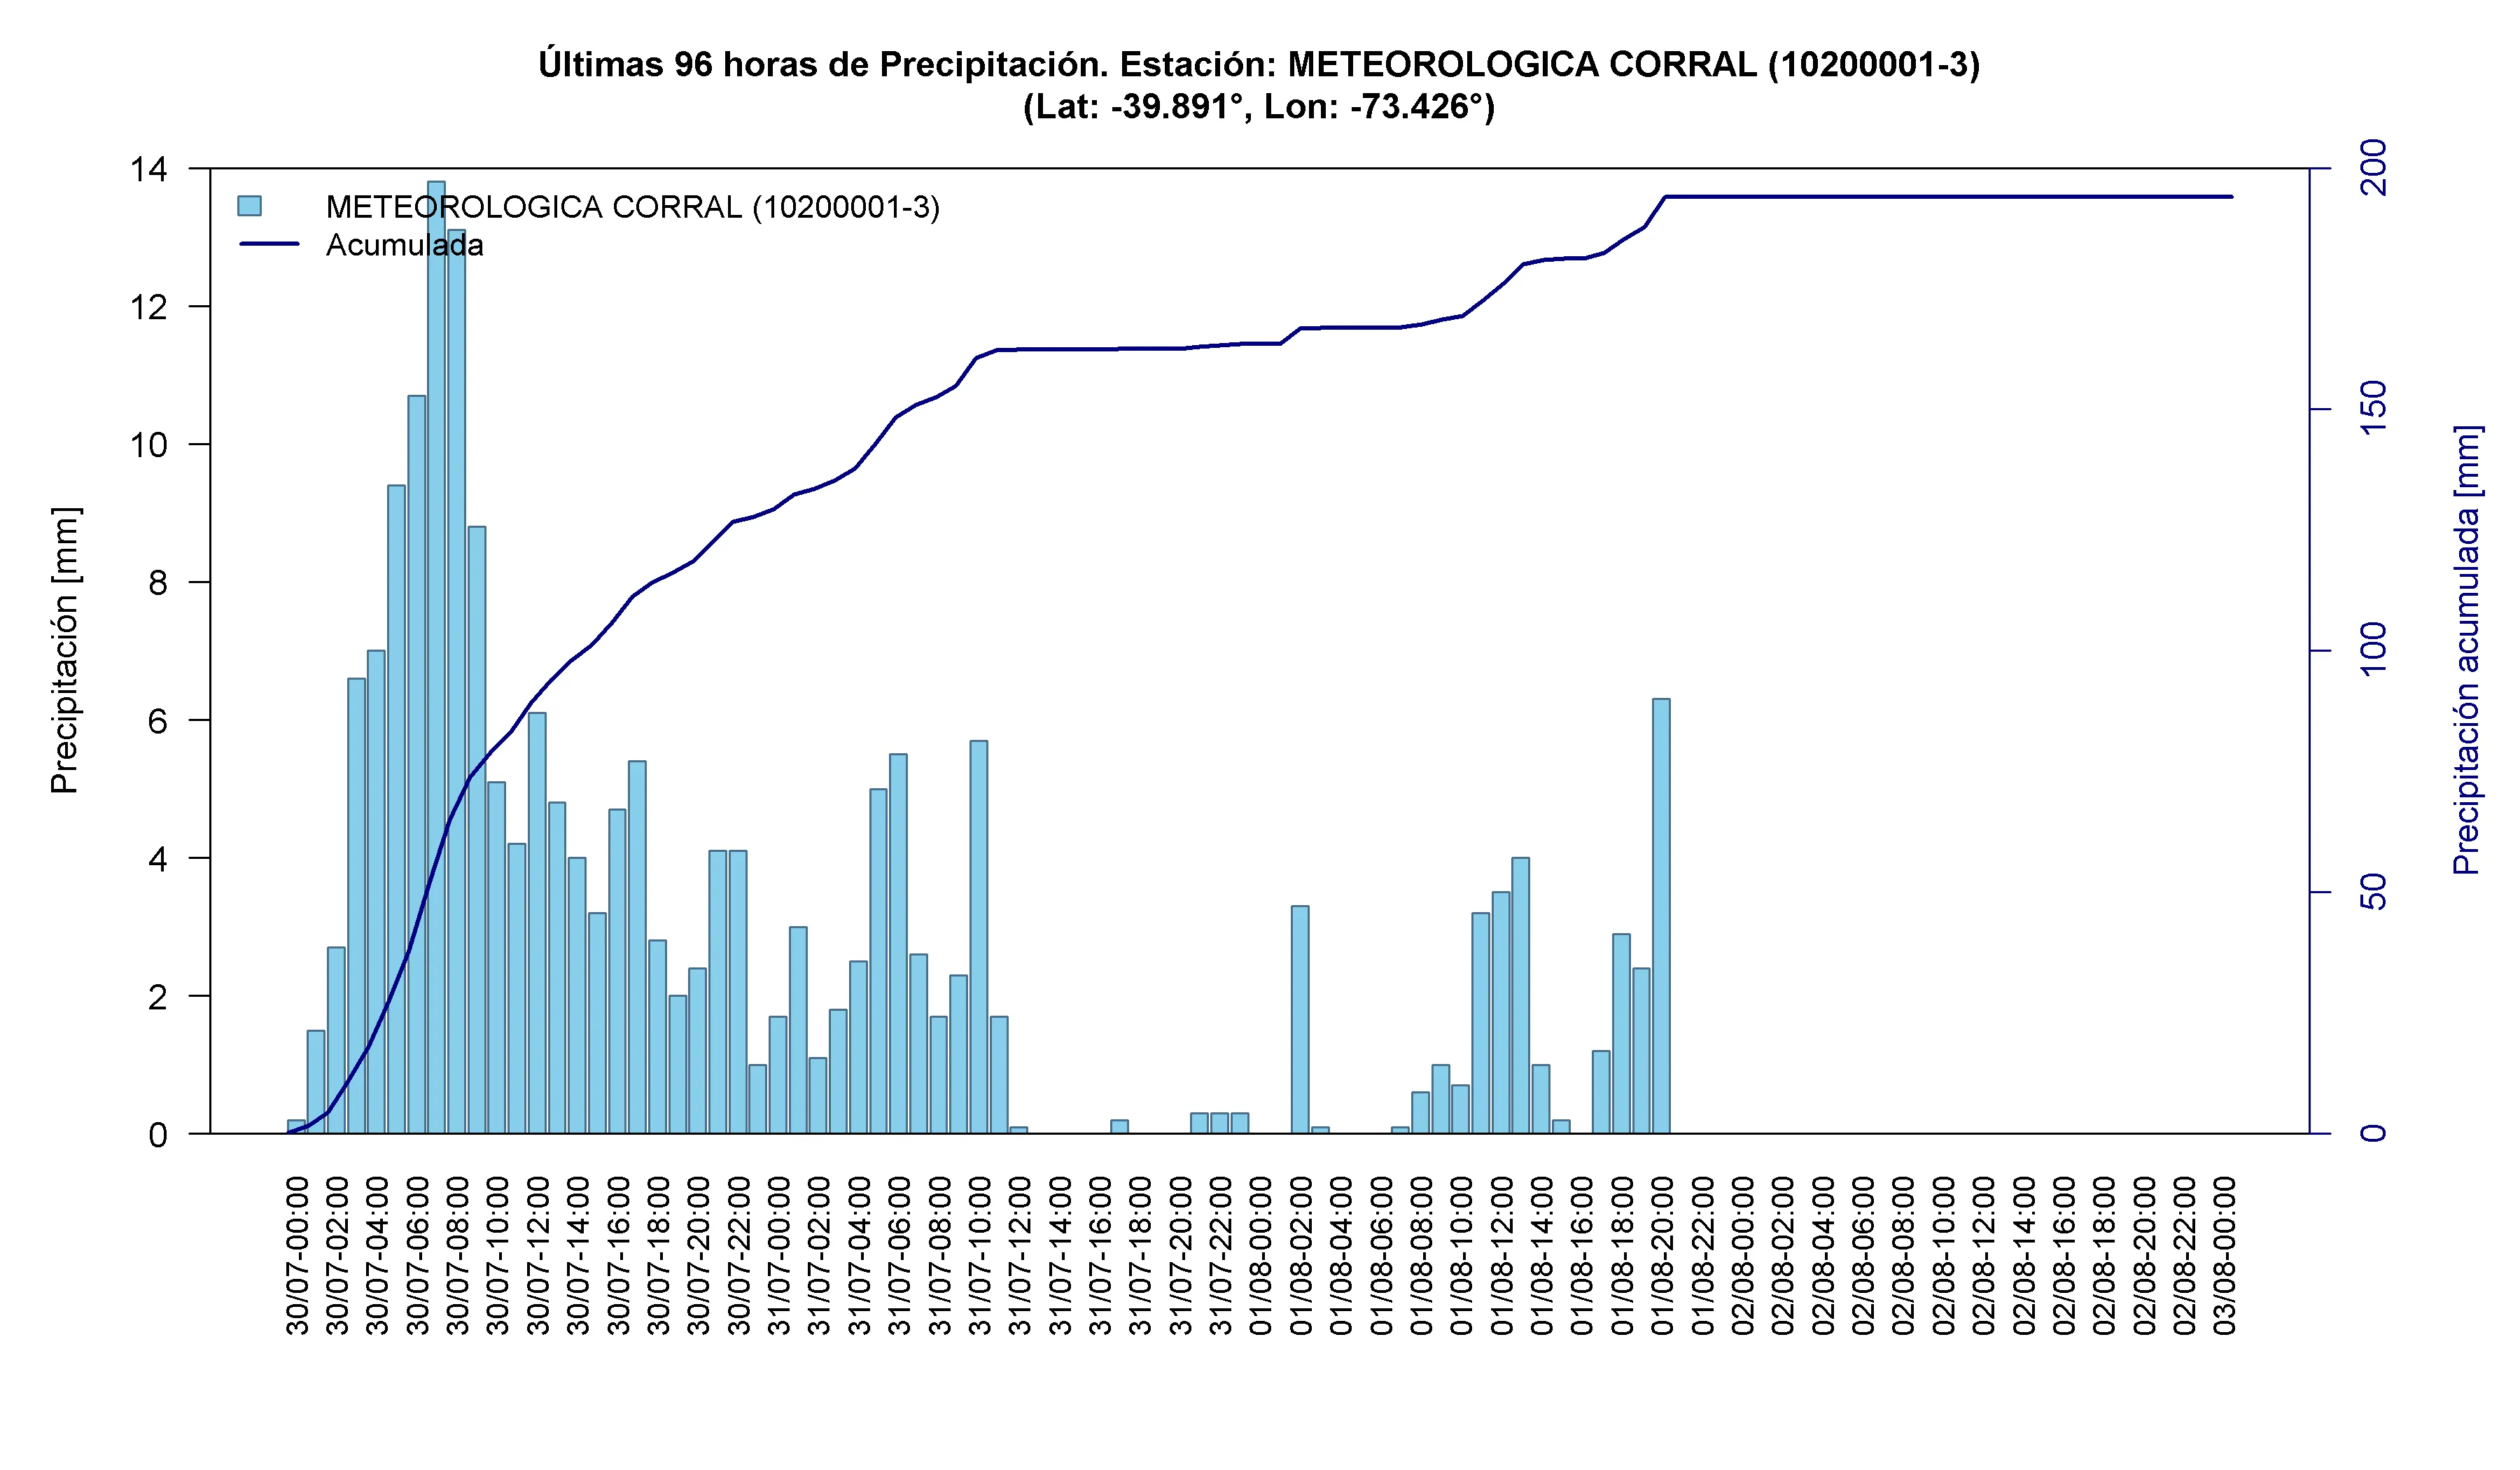
Time series: highest accumulated precipitation stations
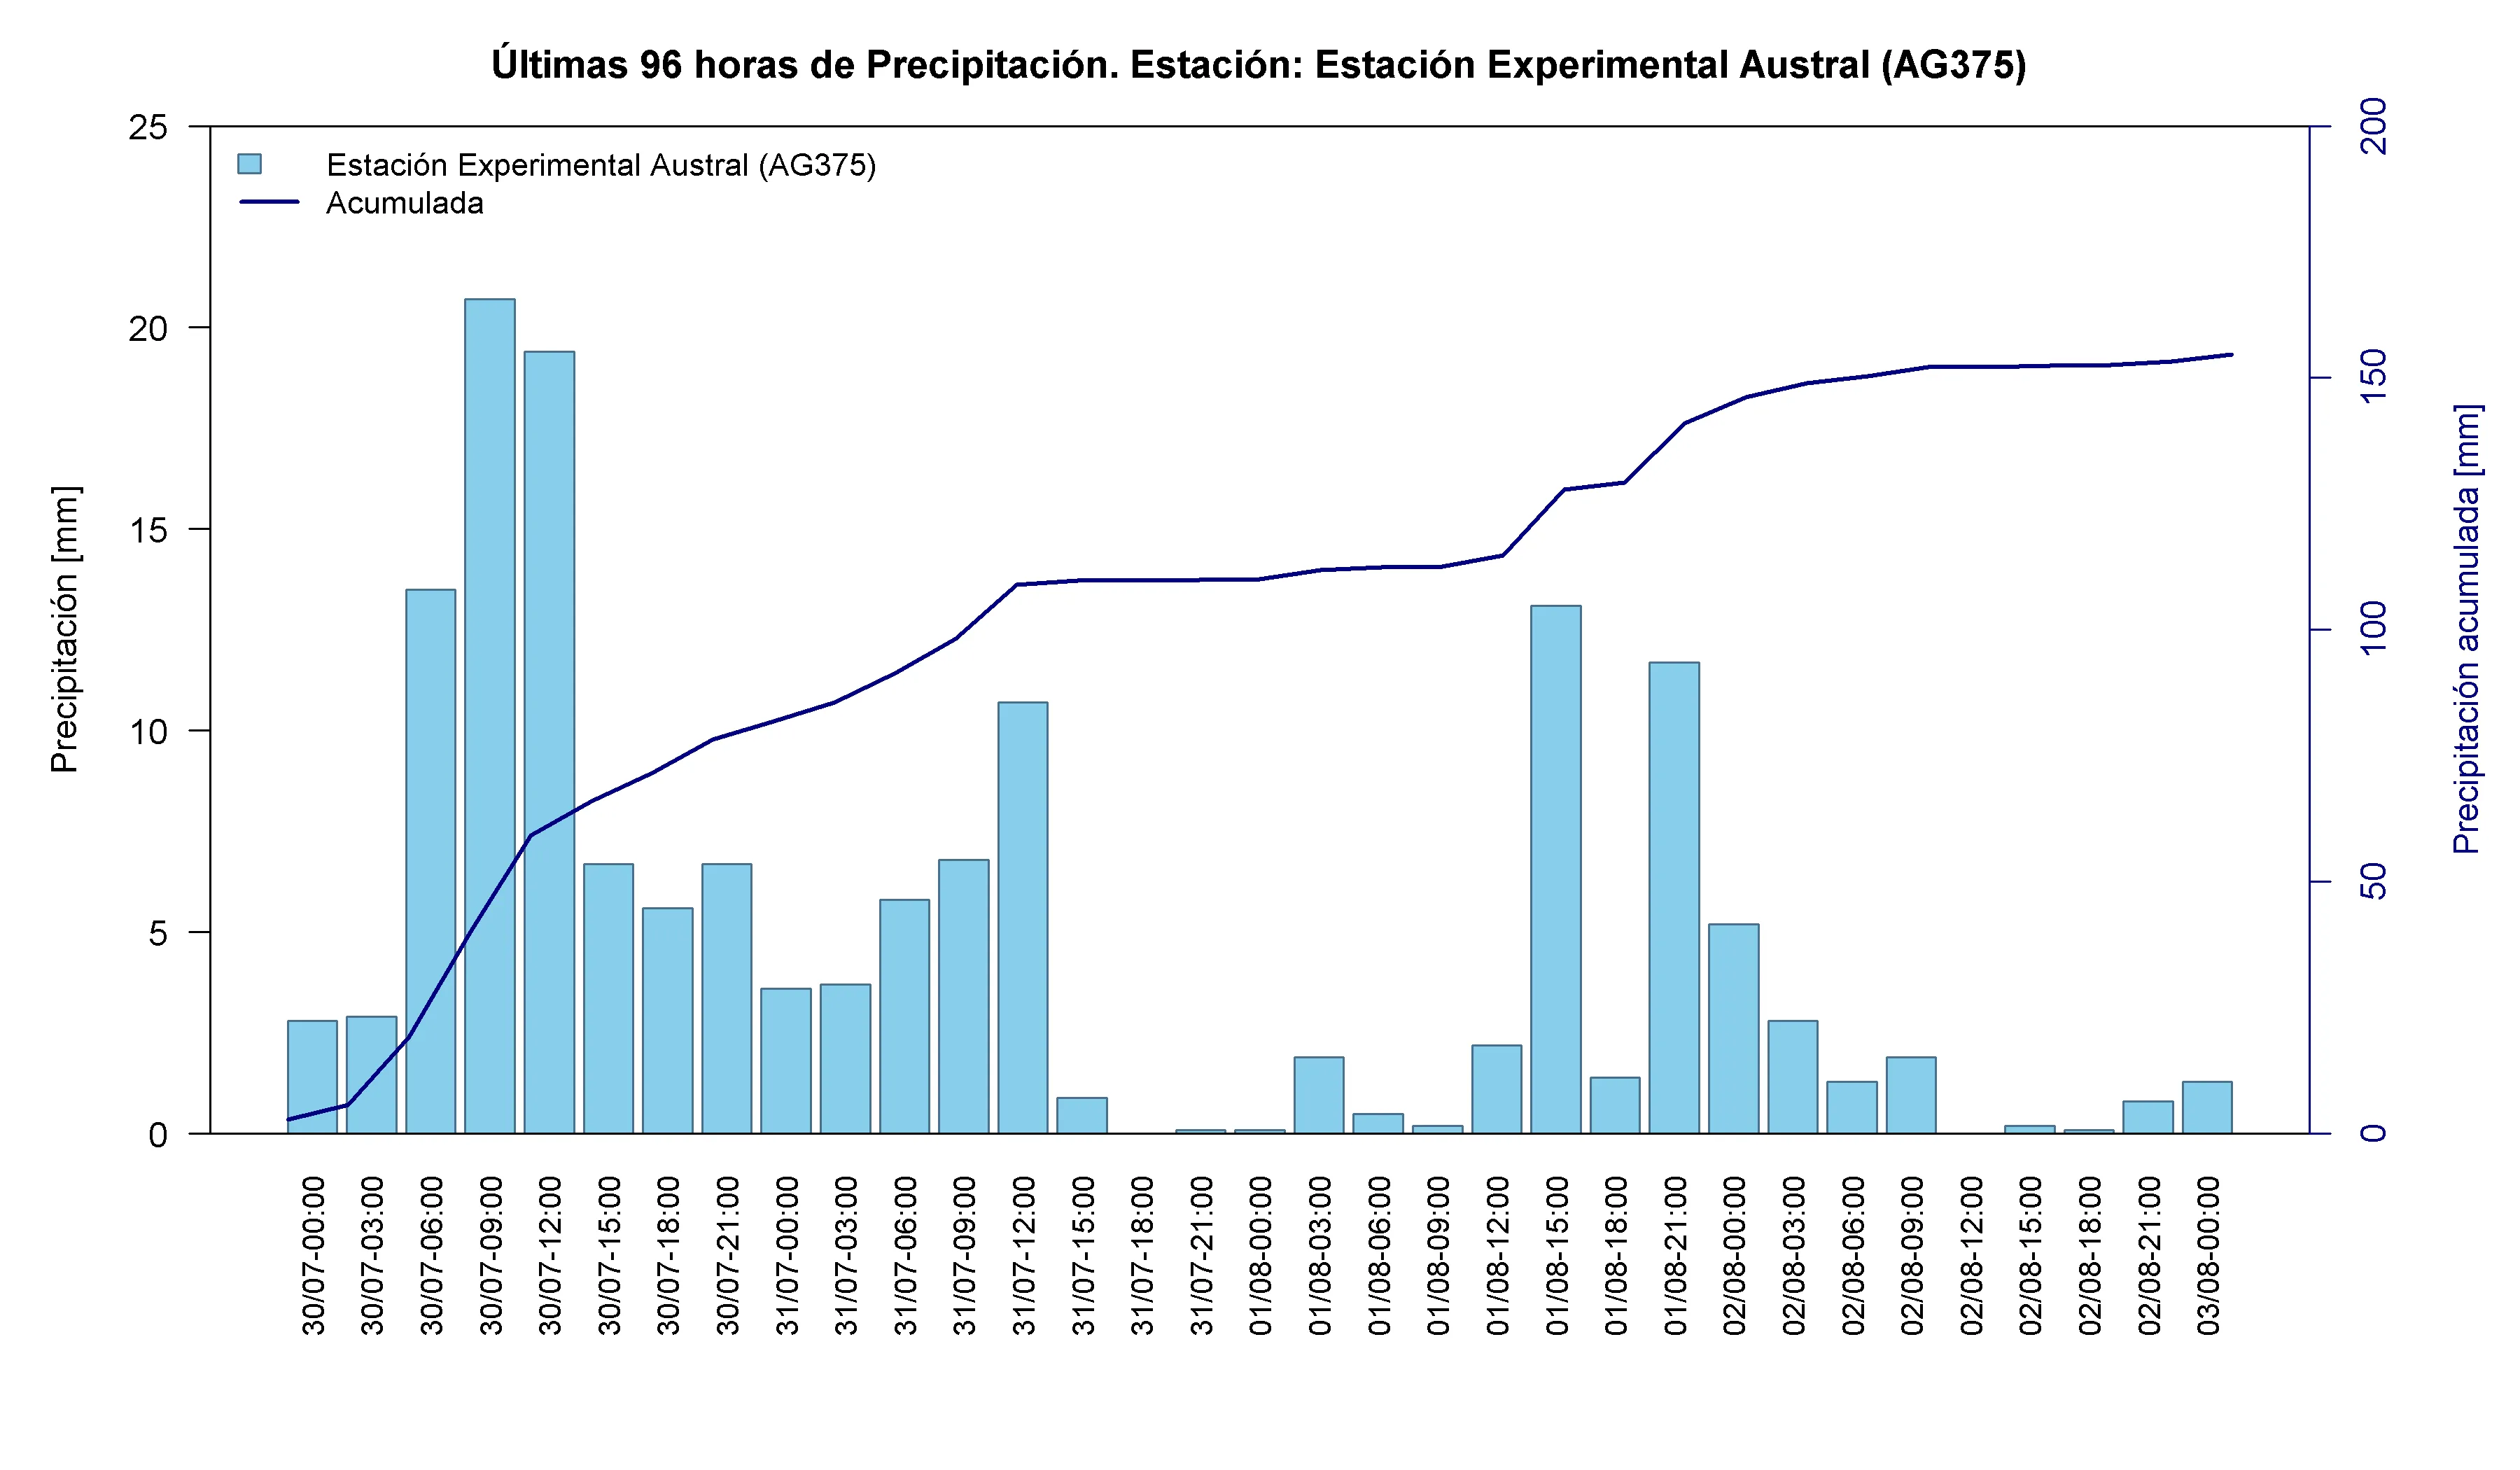
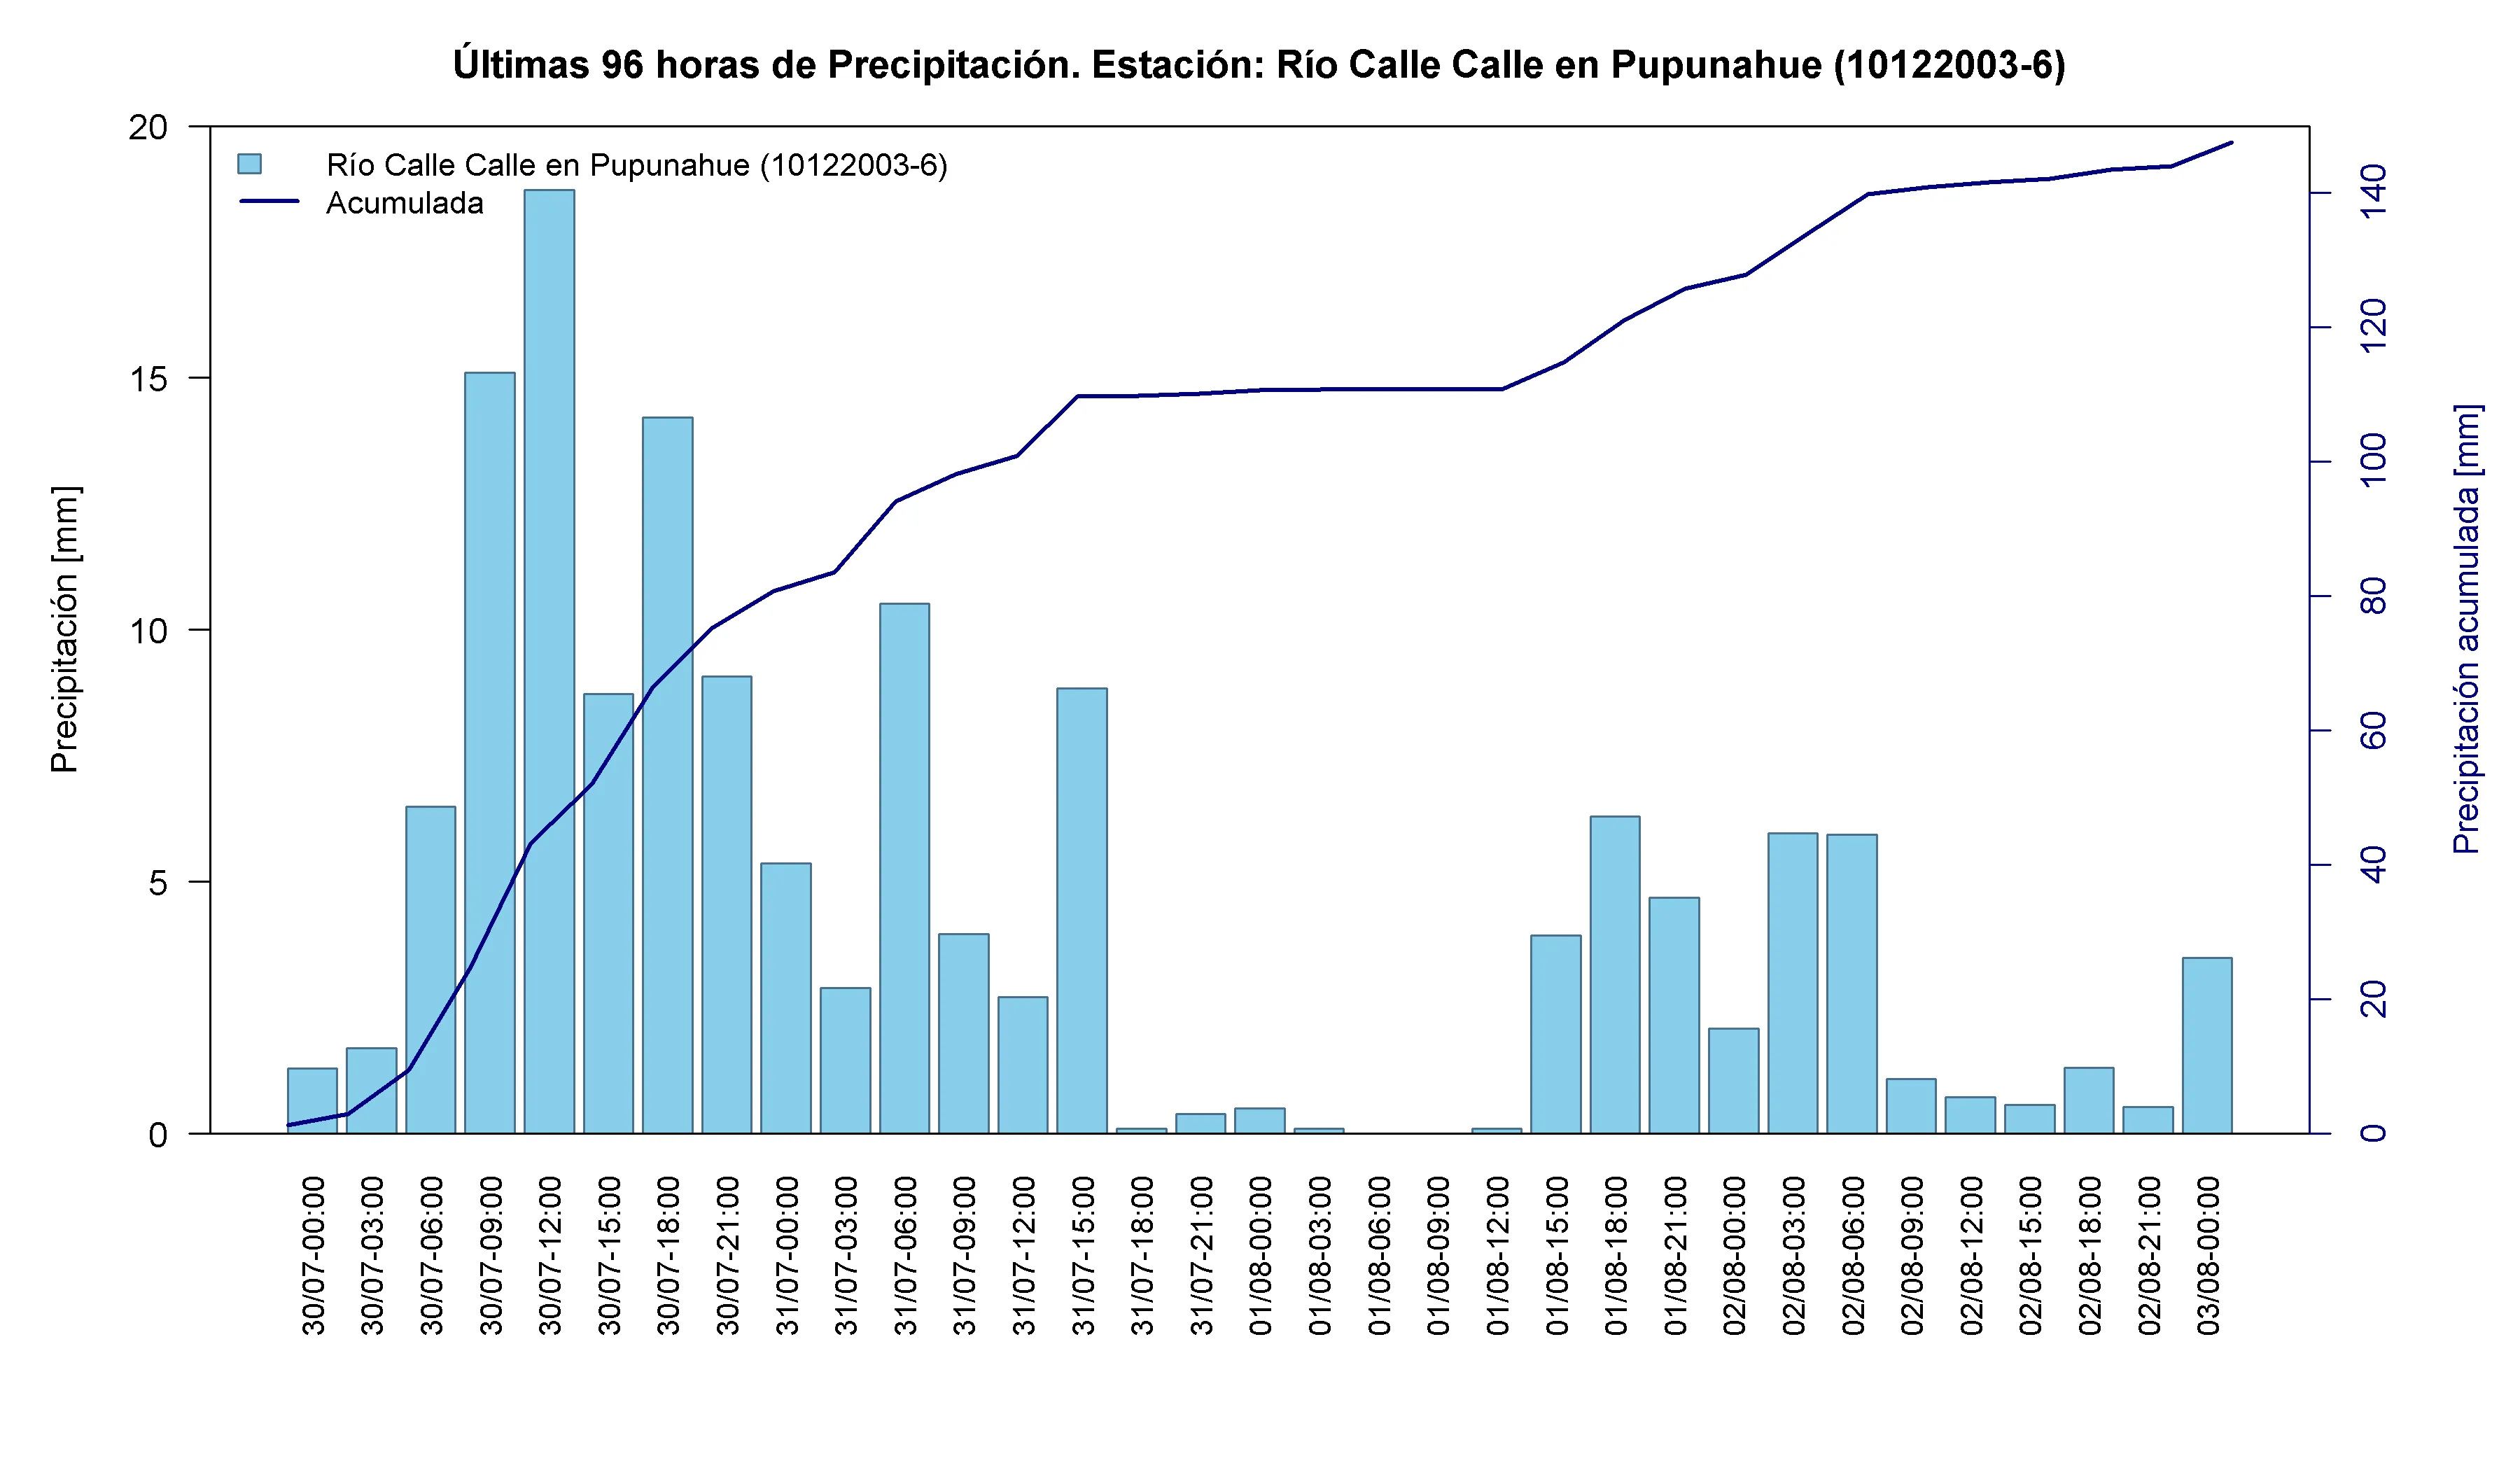
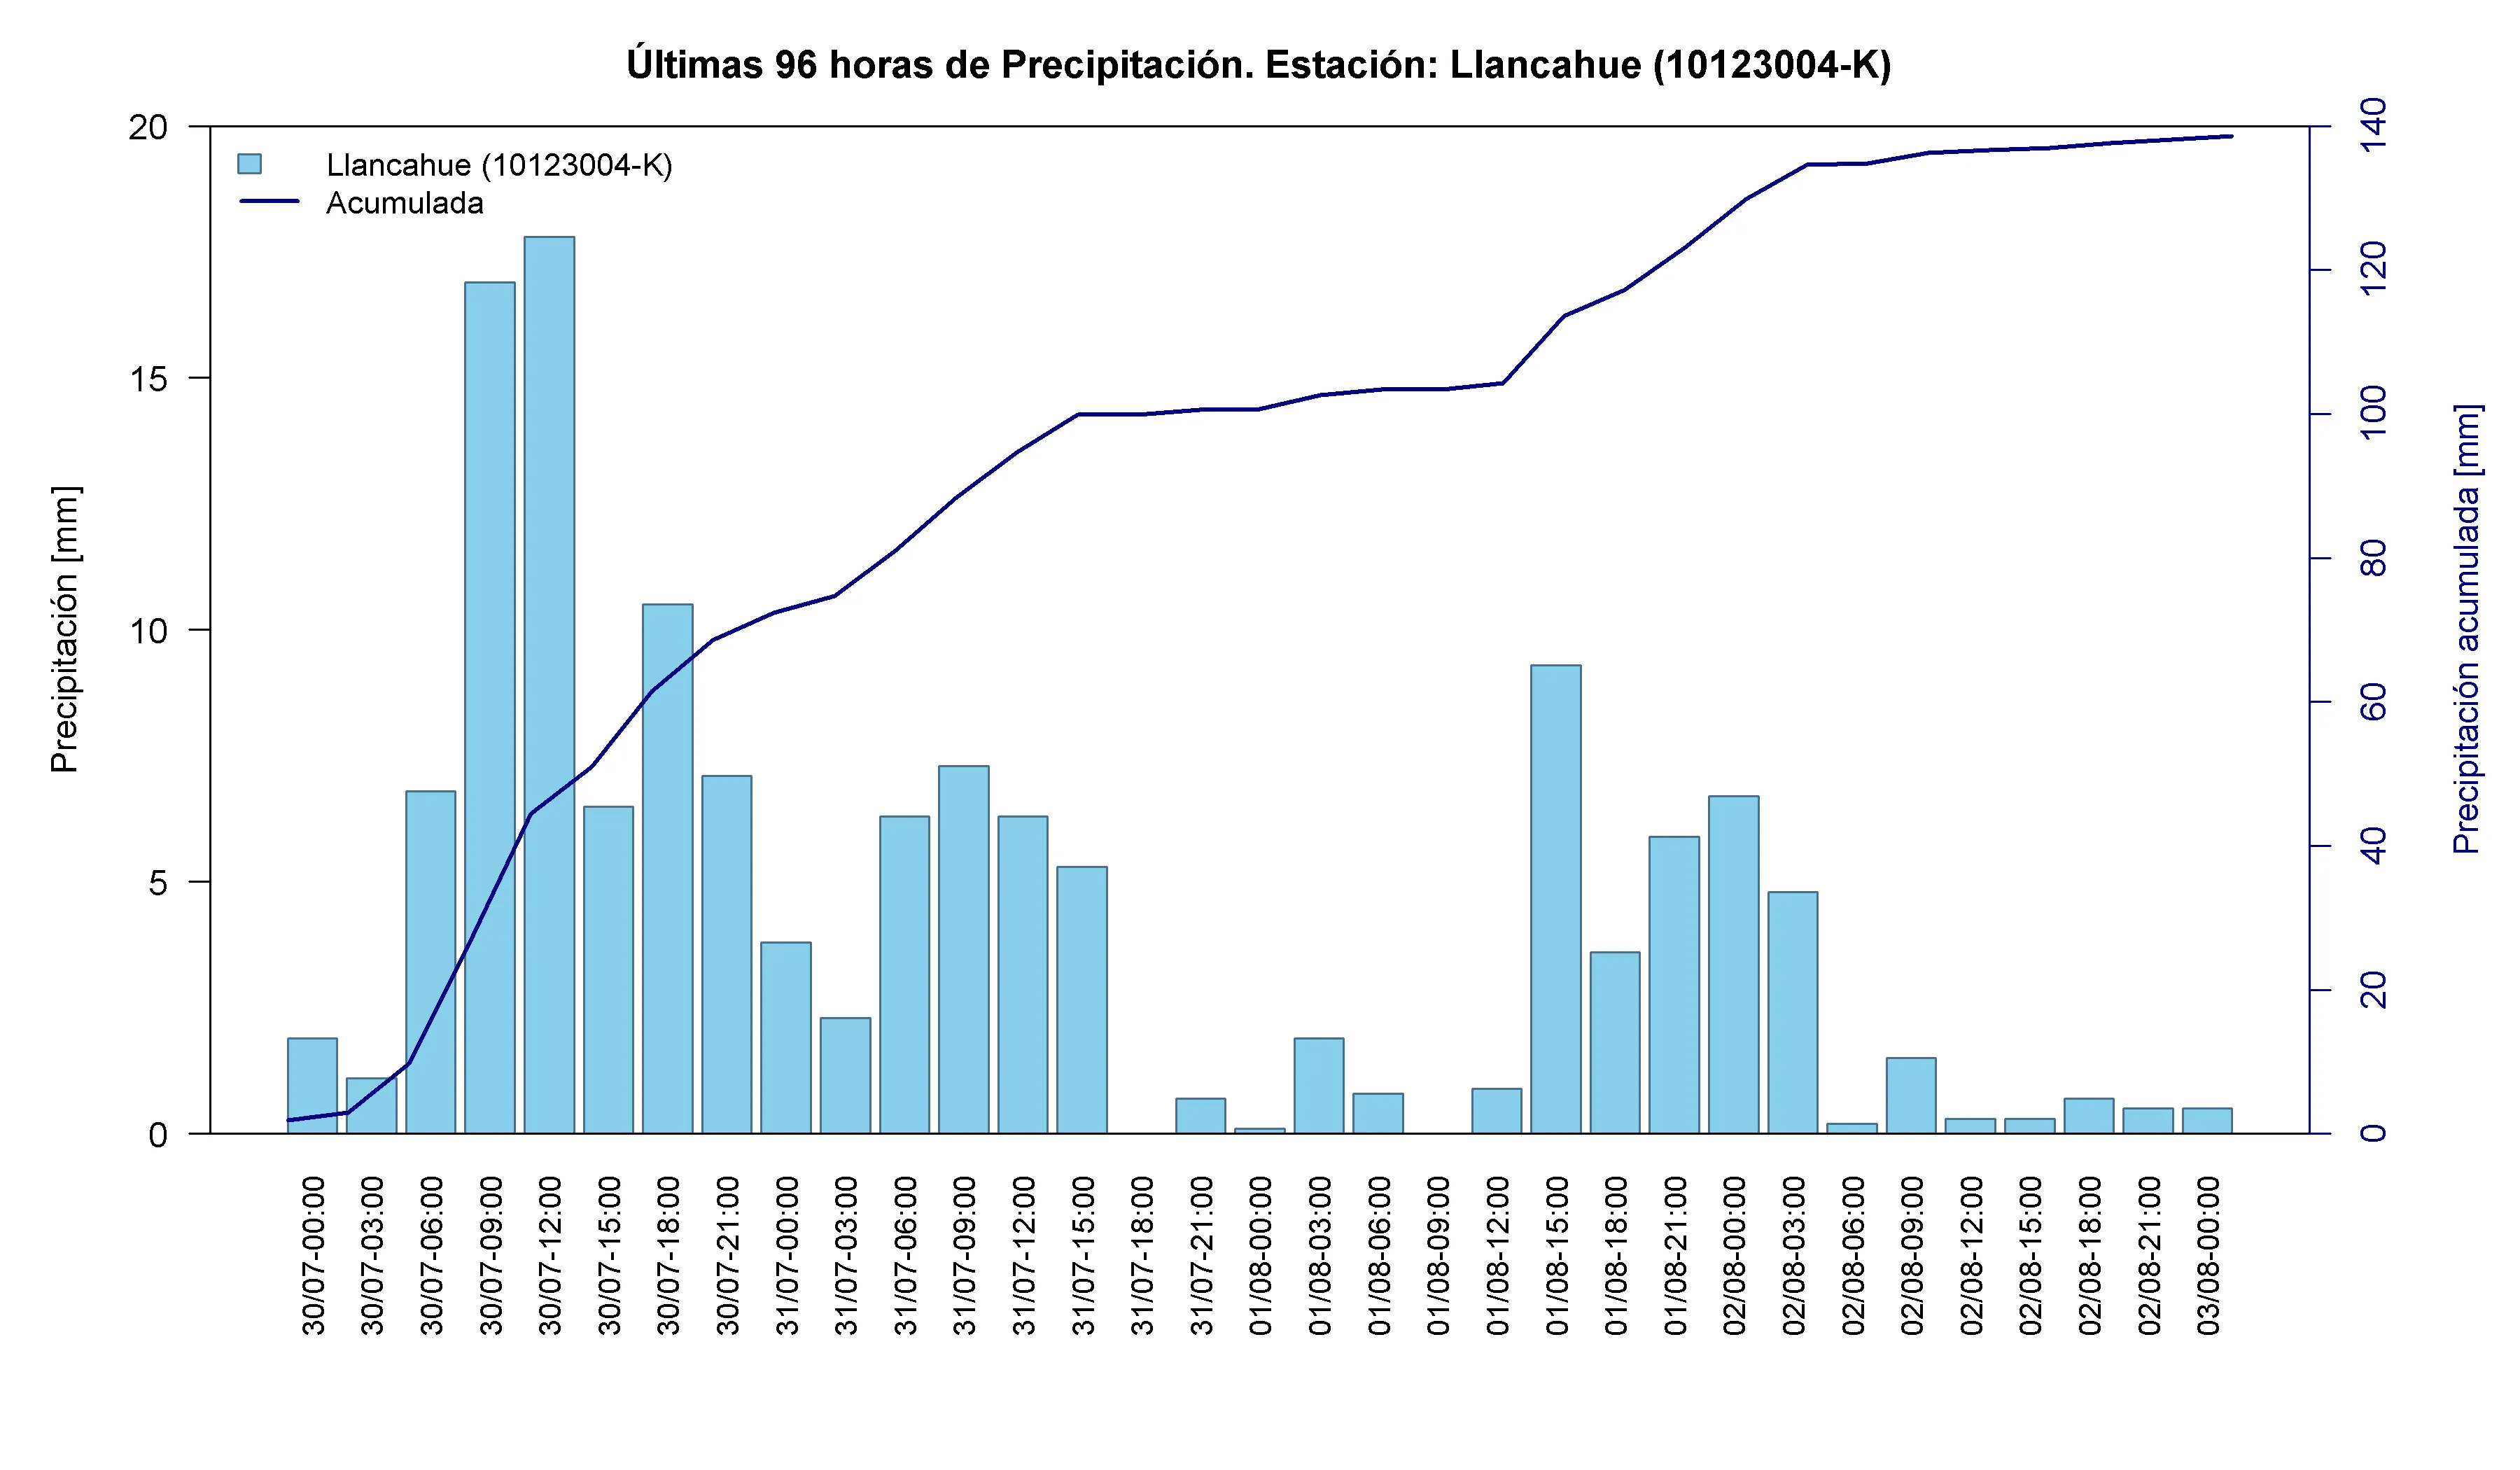

Nearby DGA stations
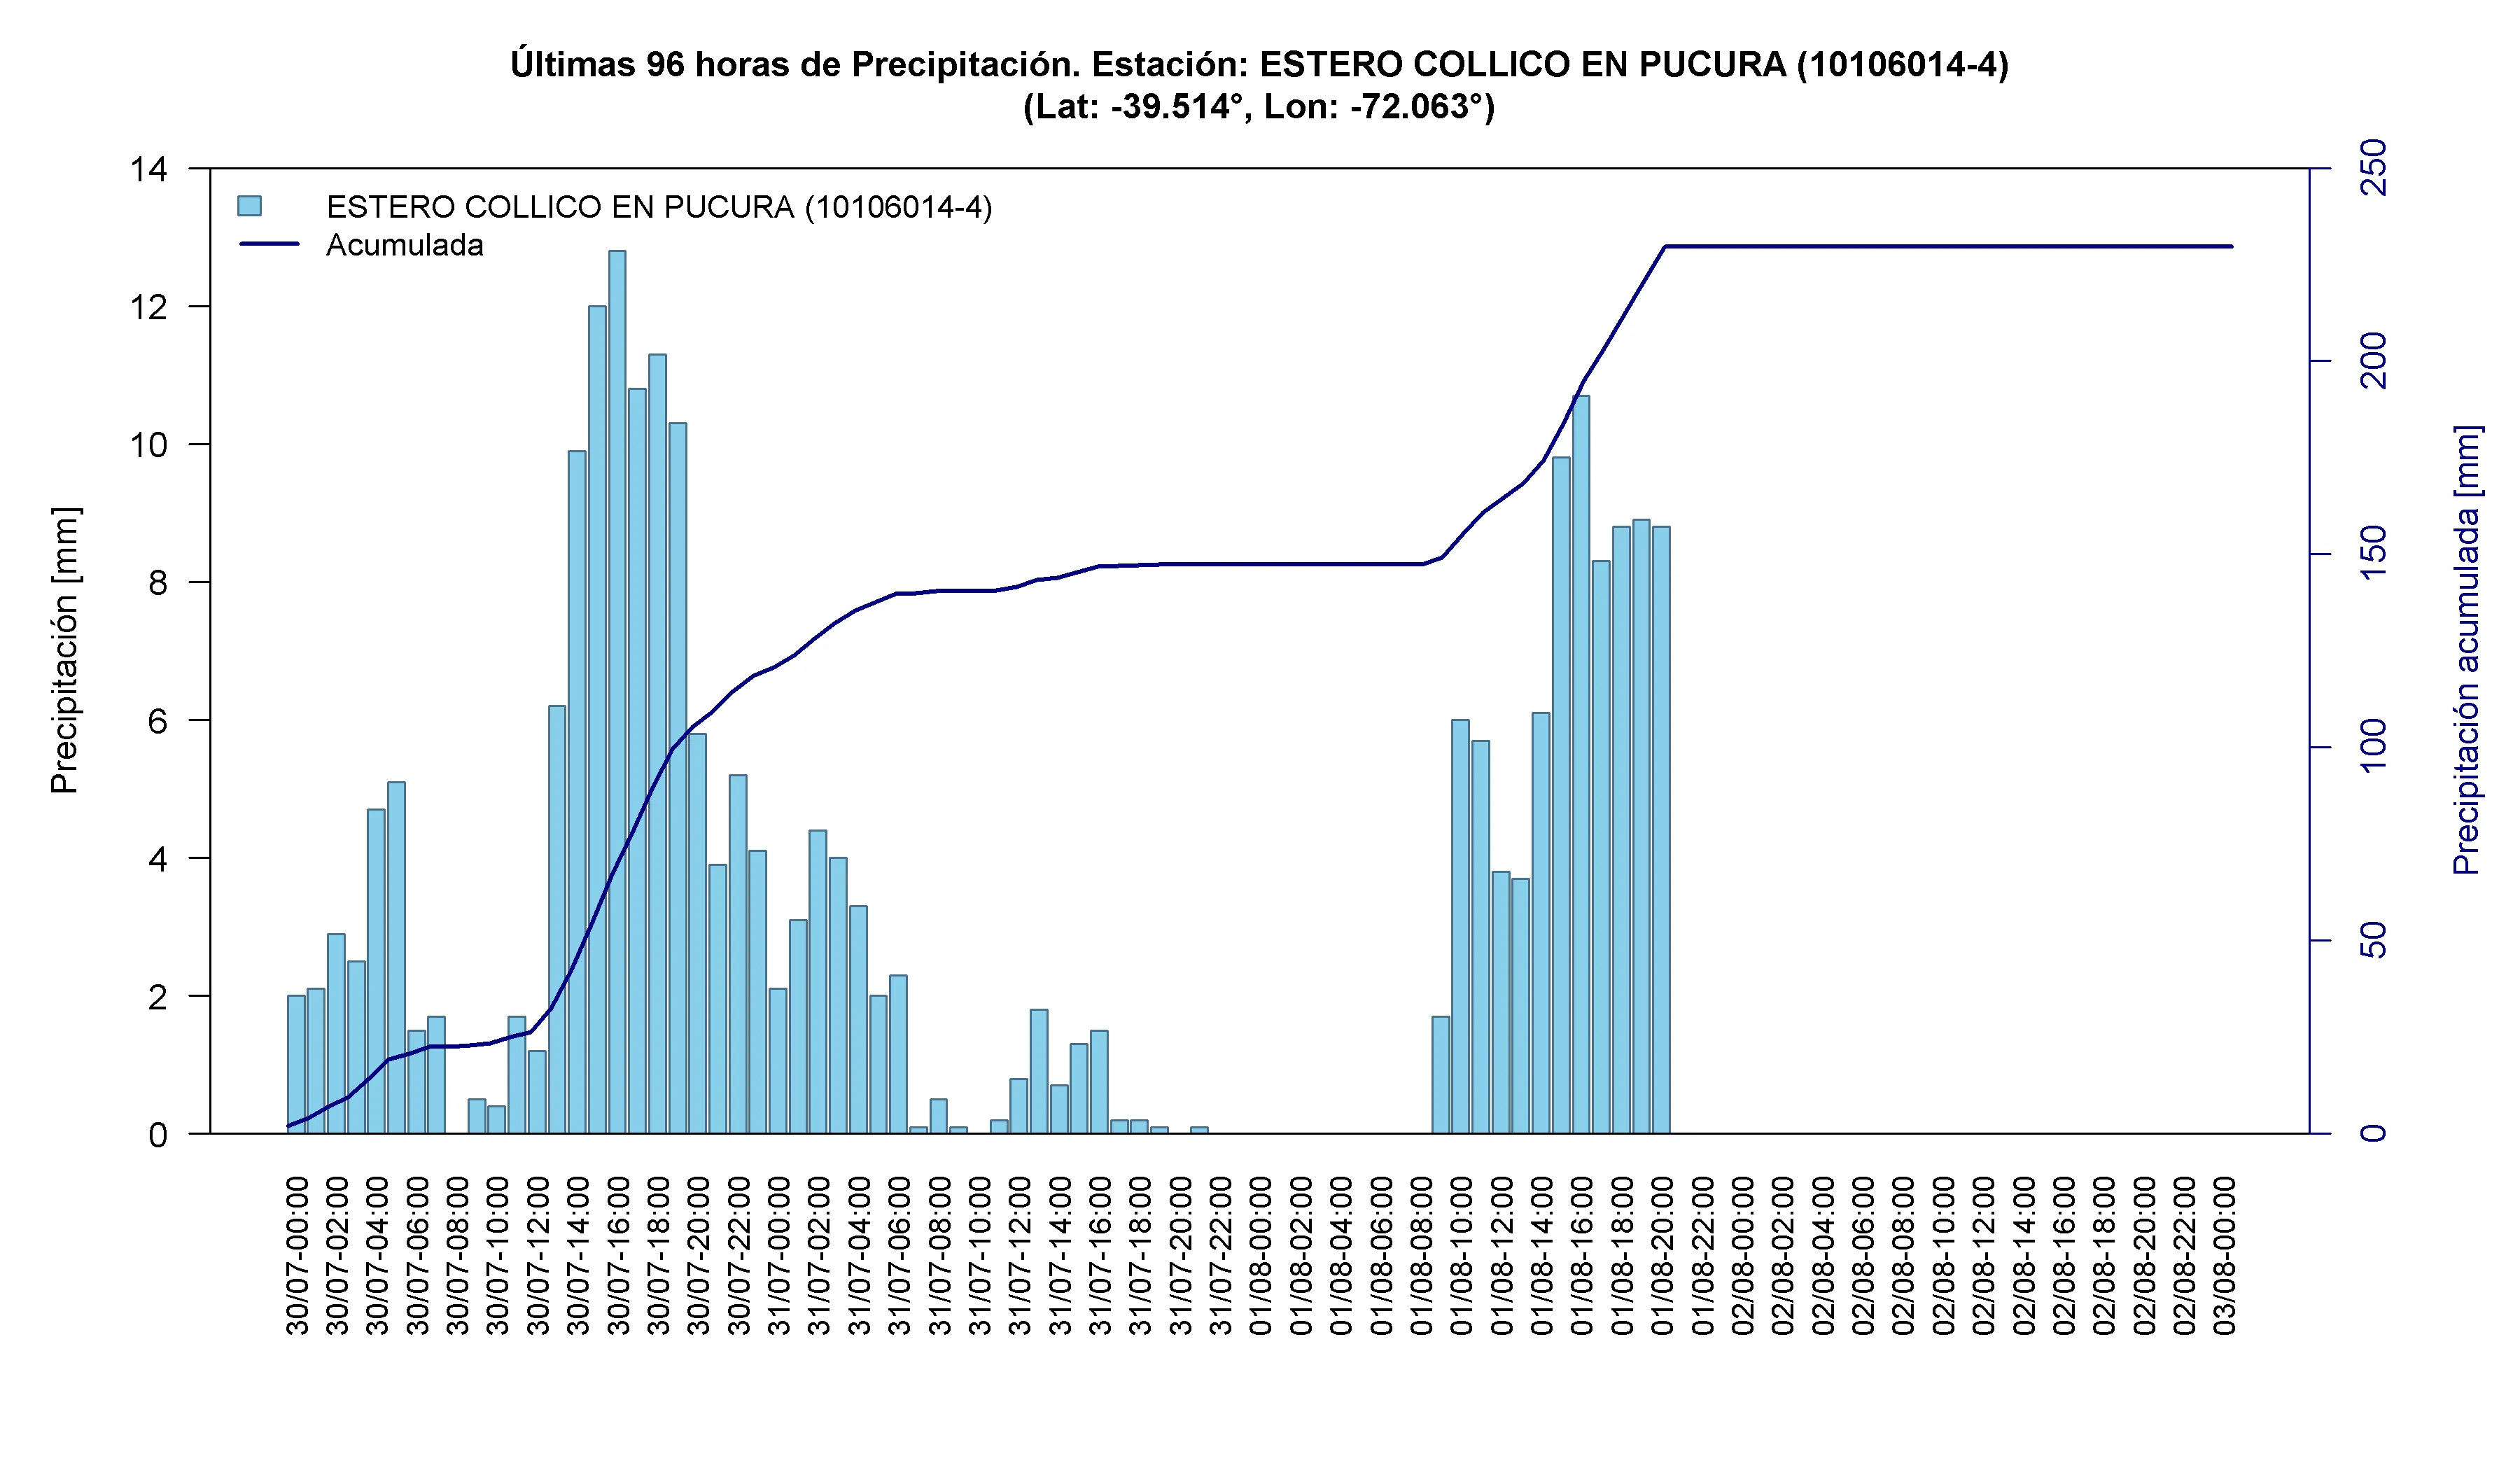
The DGA stations below complement VisMet with records close to Panguipulli and the coastal sector affected by the frontal system.
La Araucanía Region
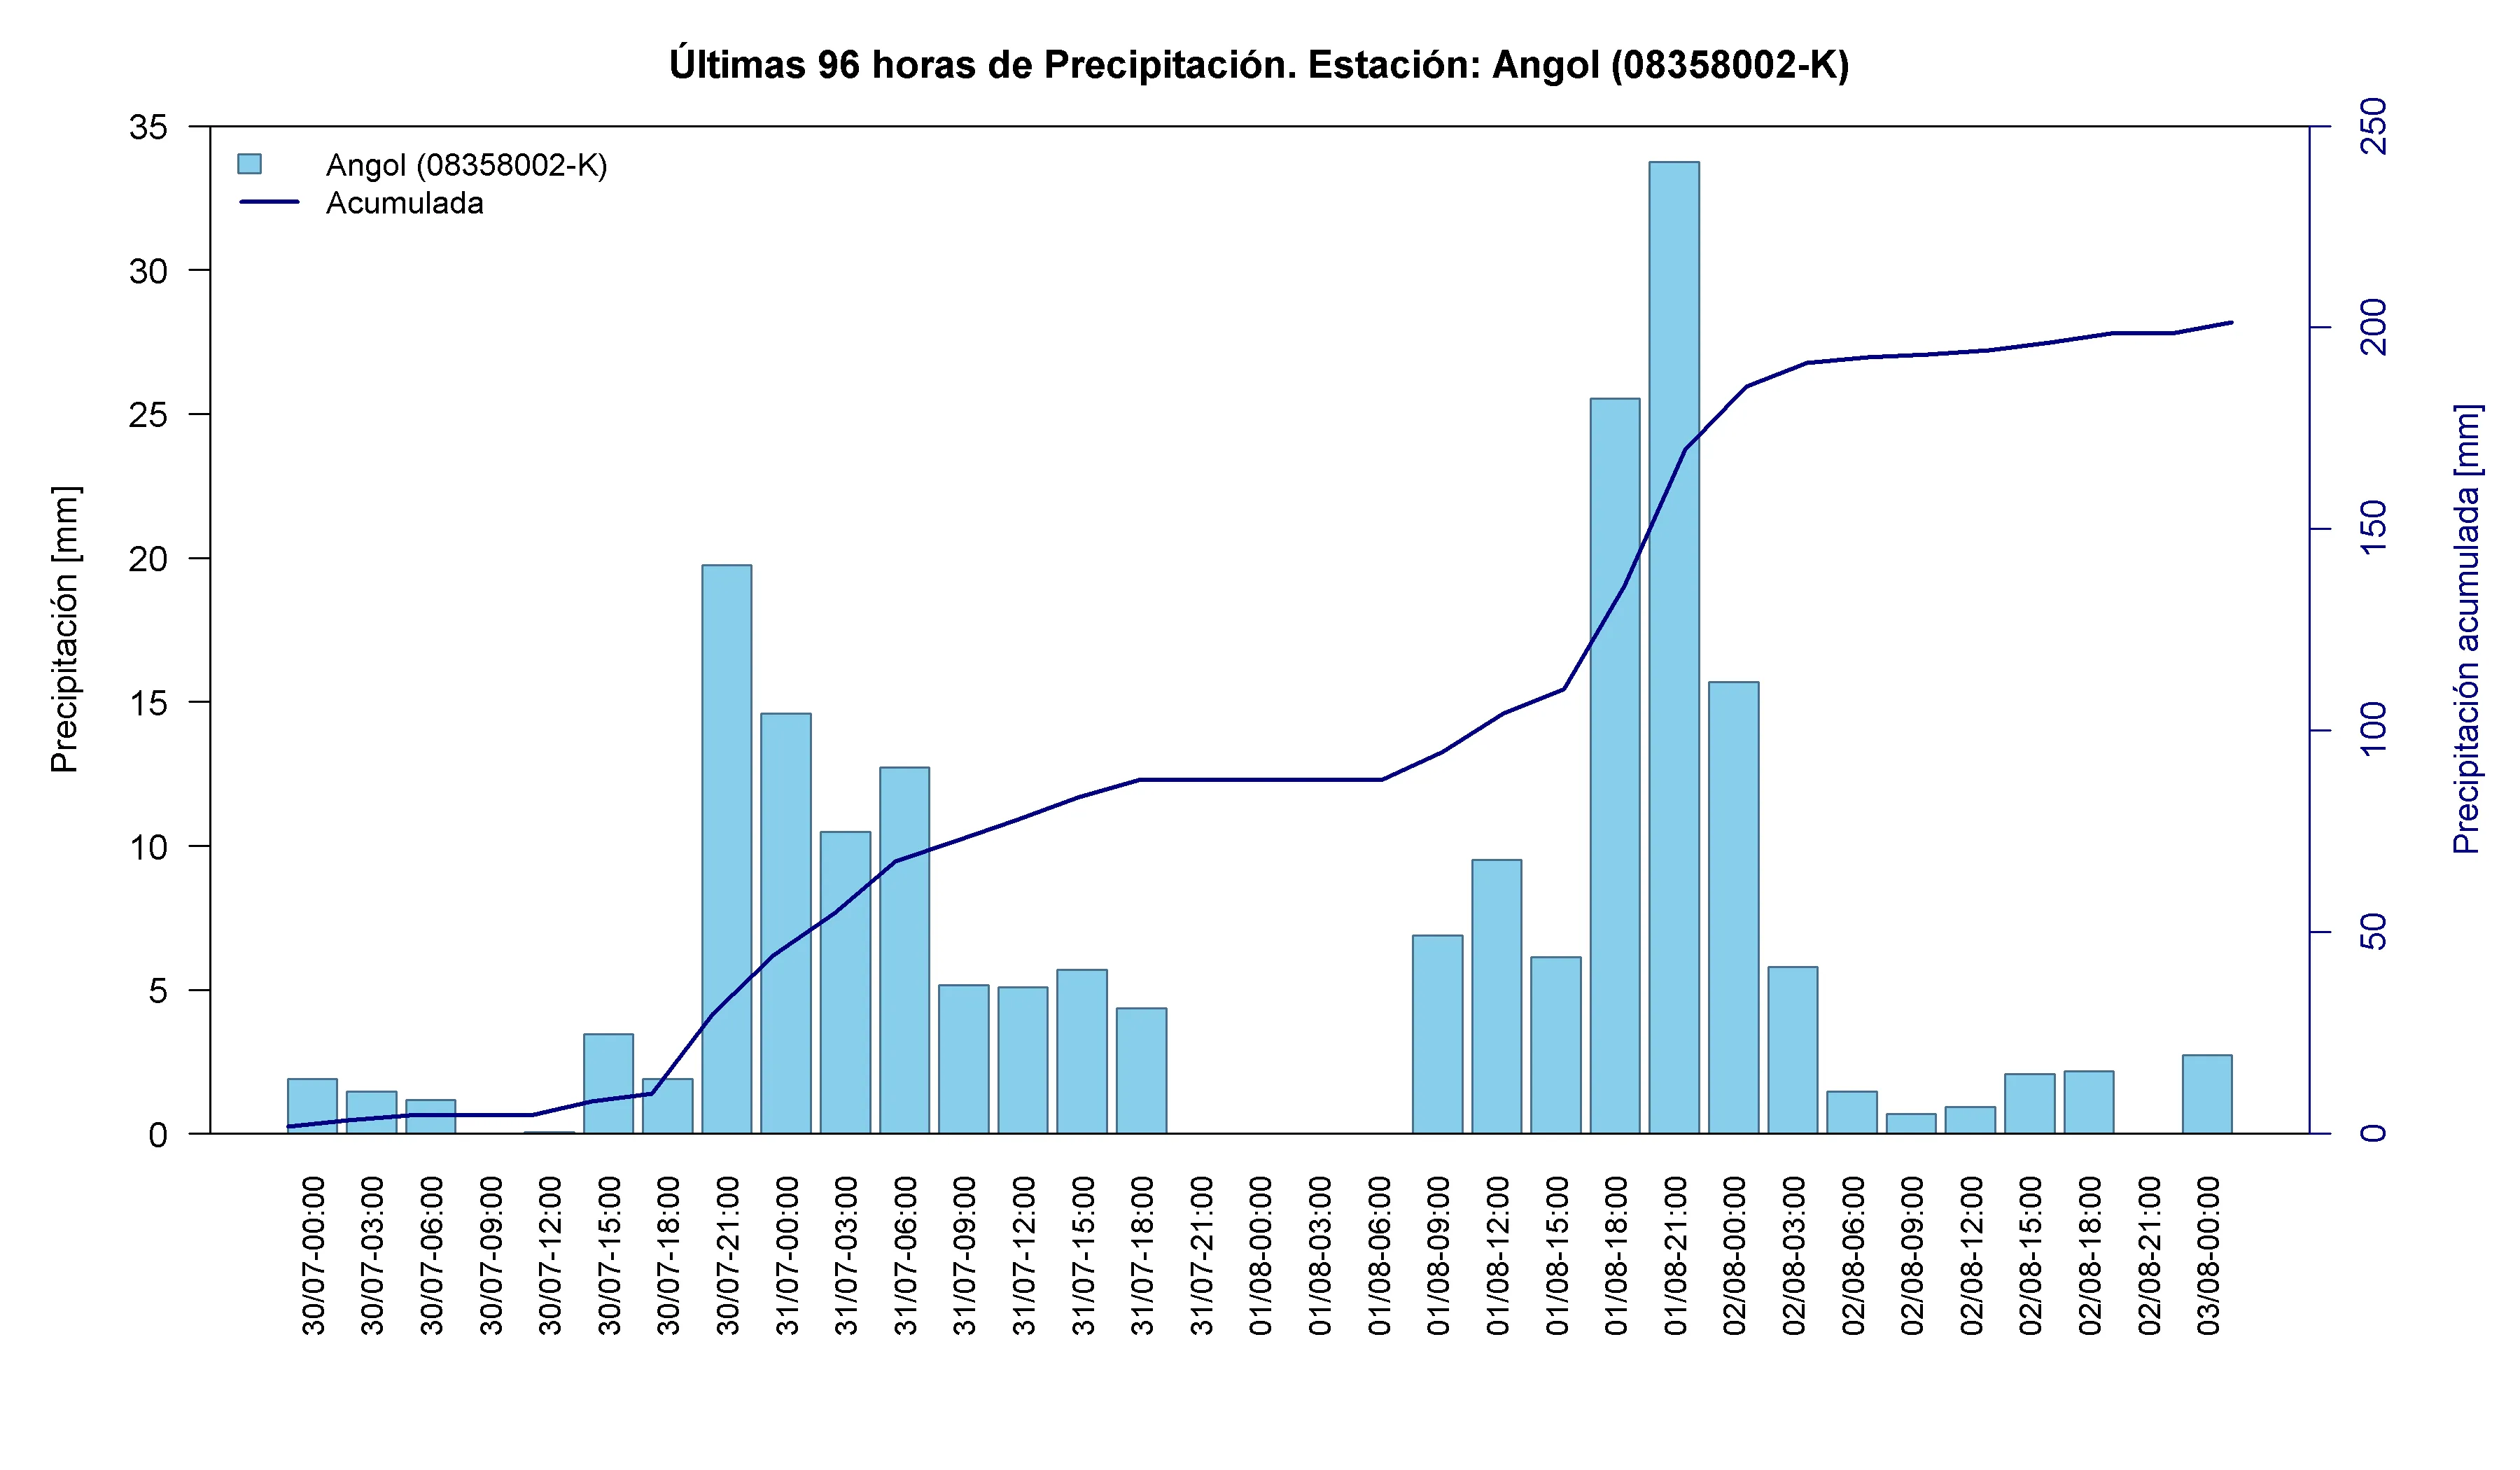
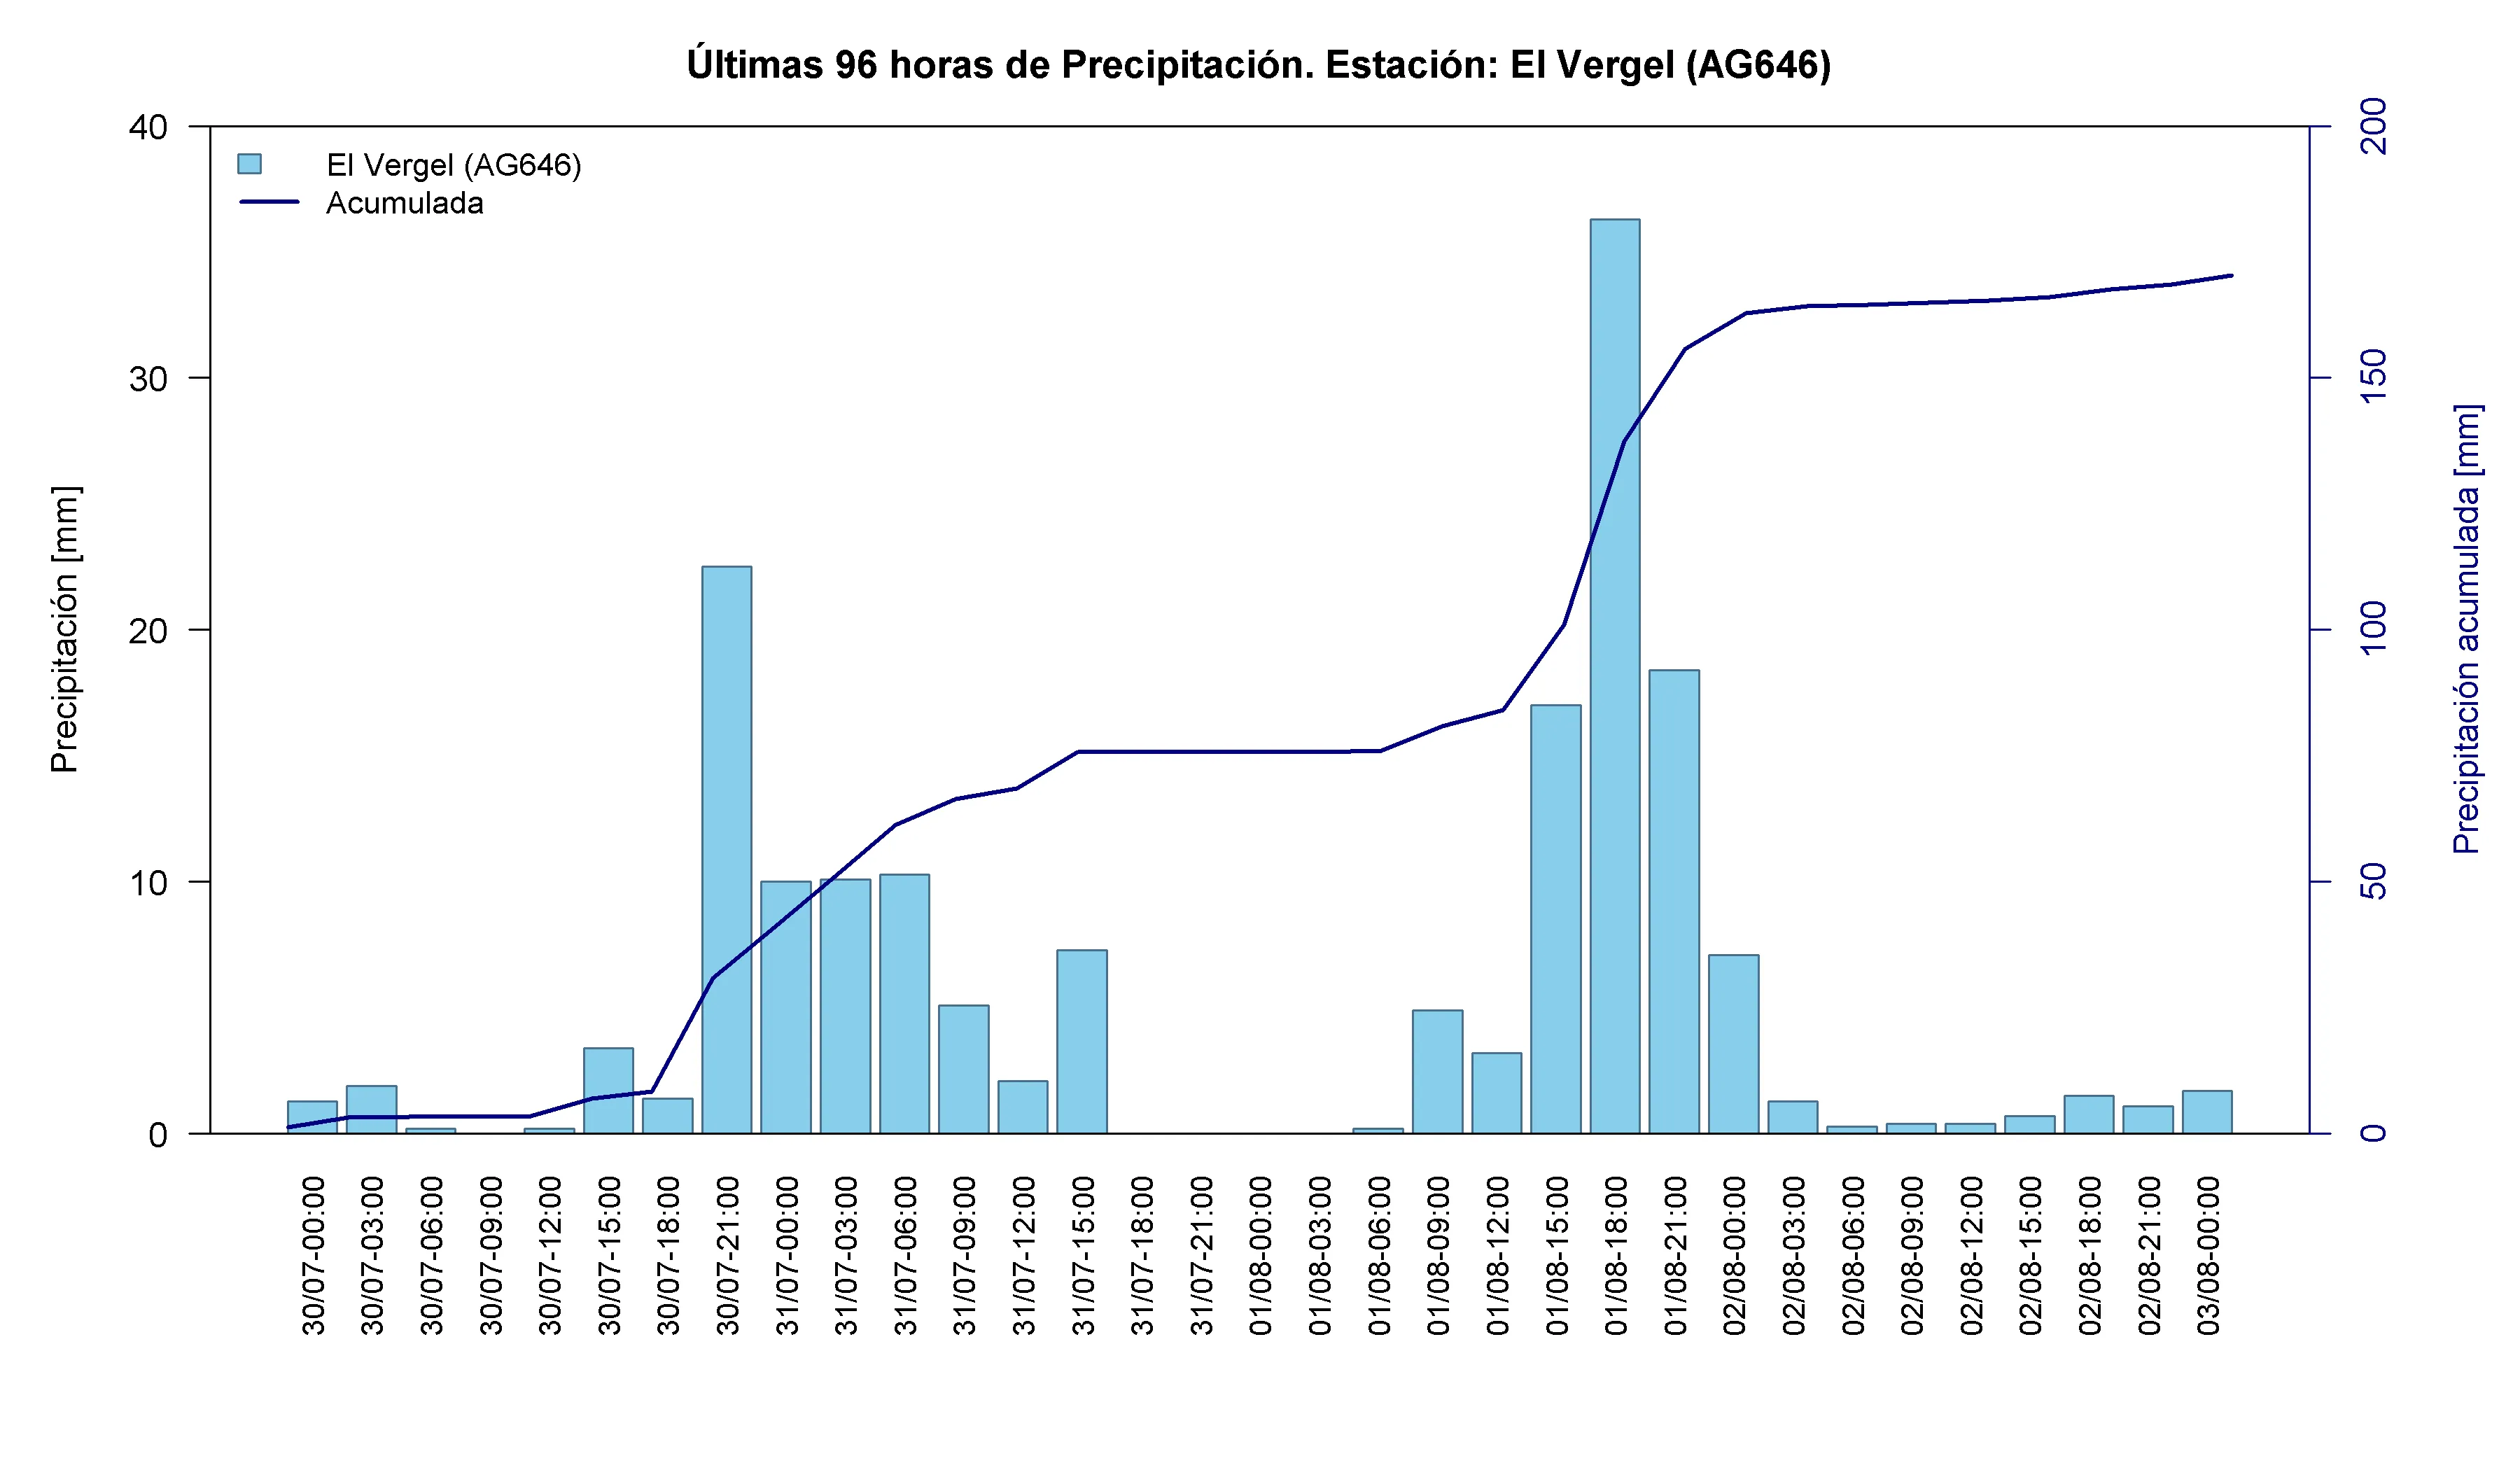
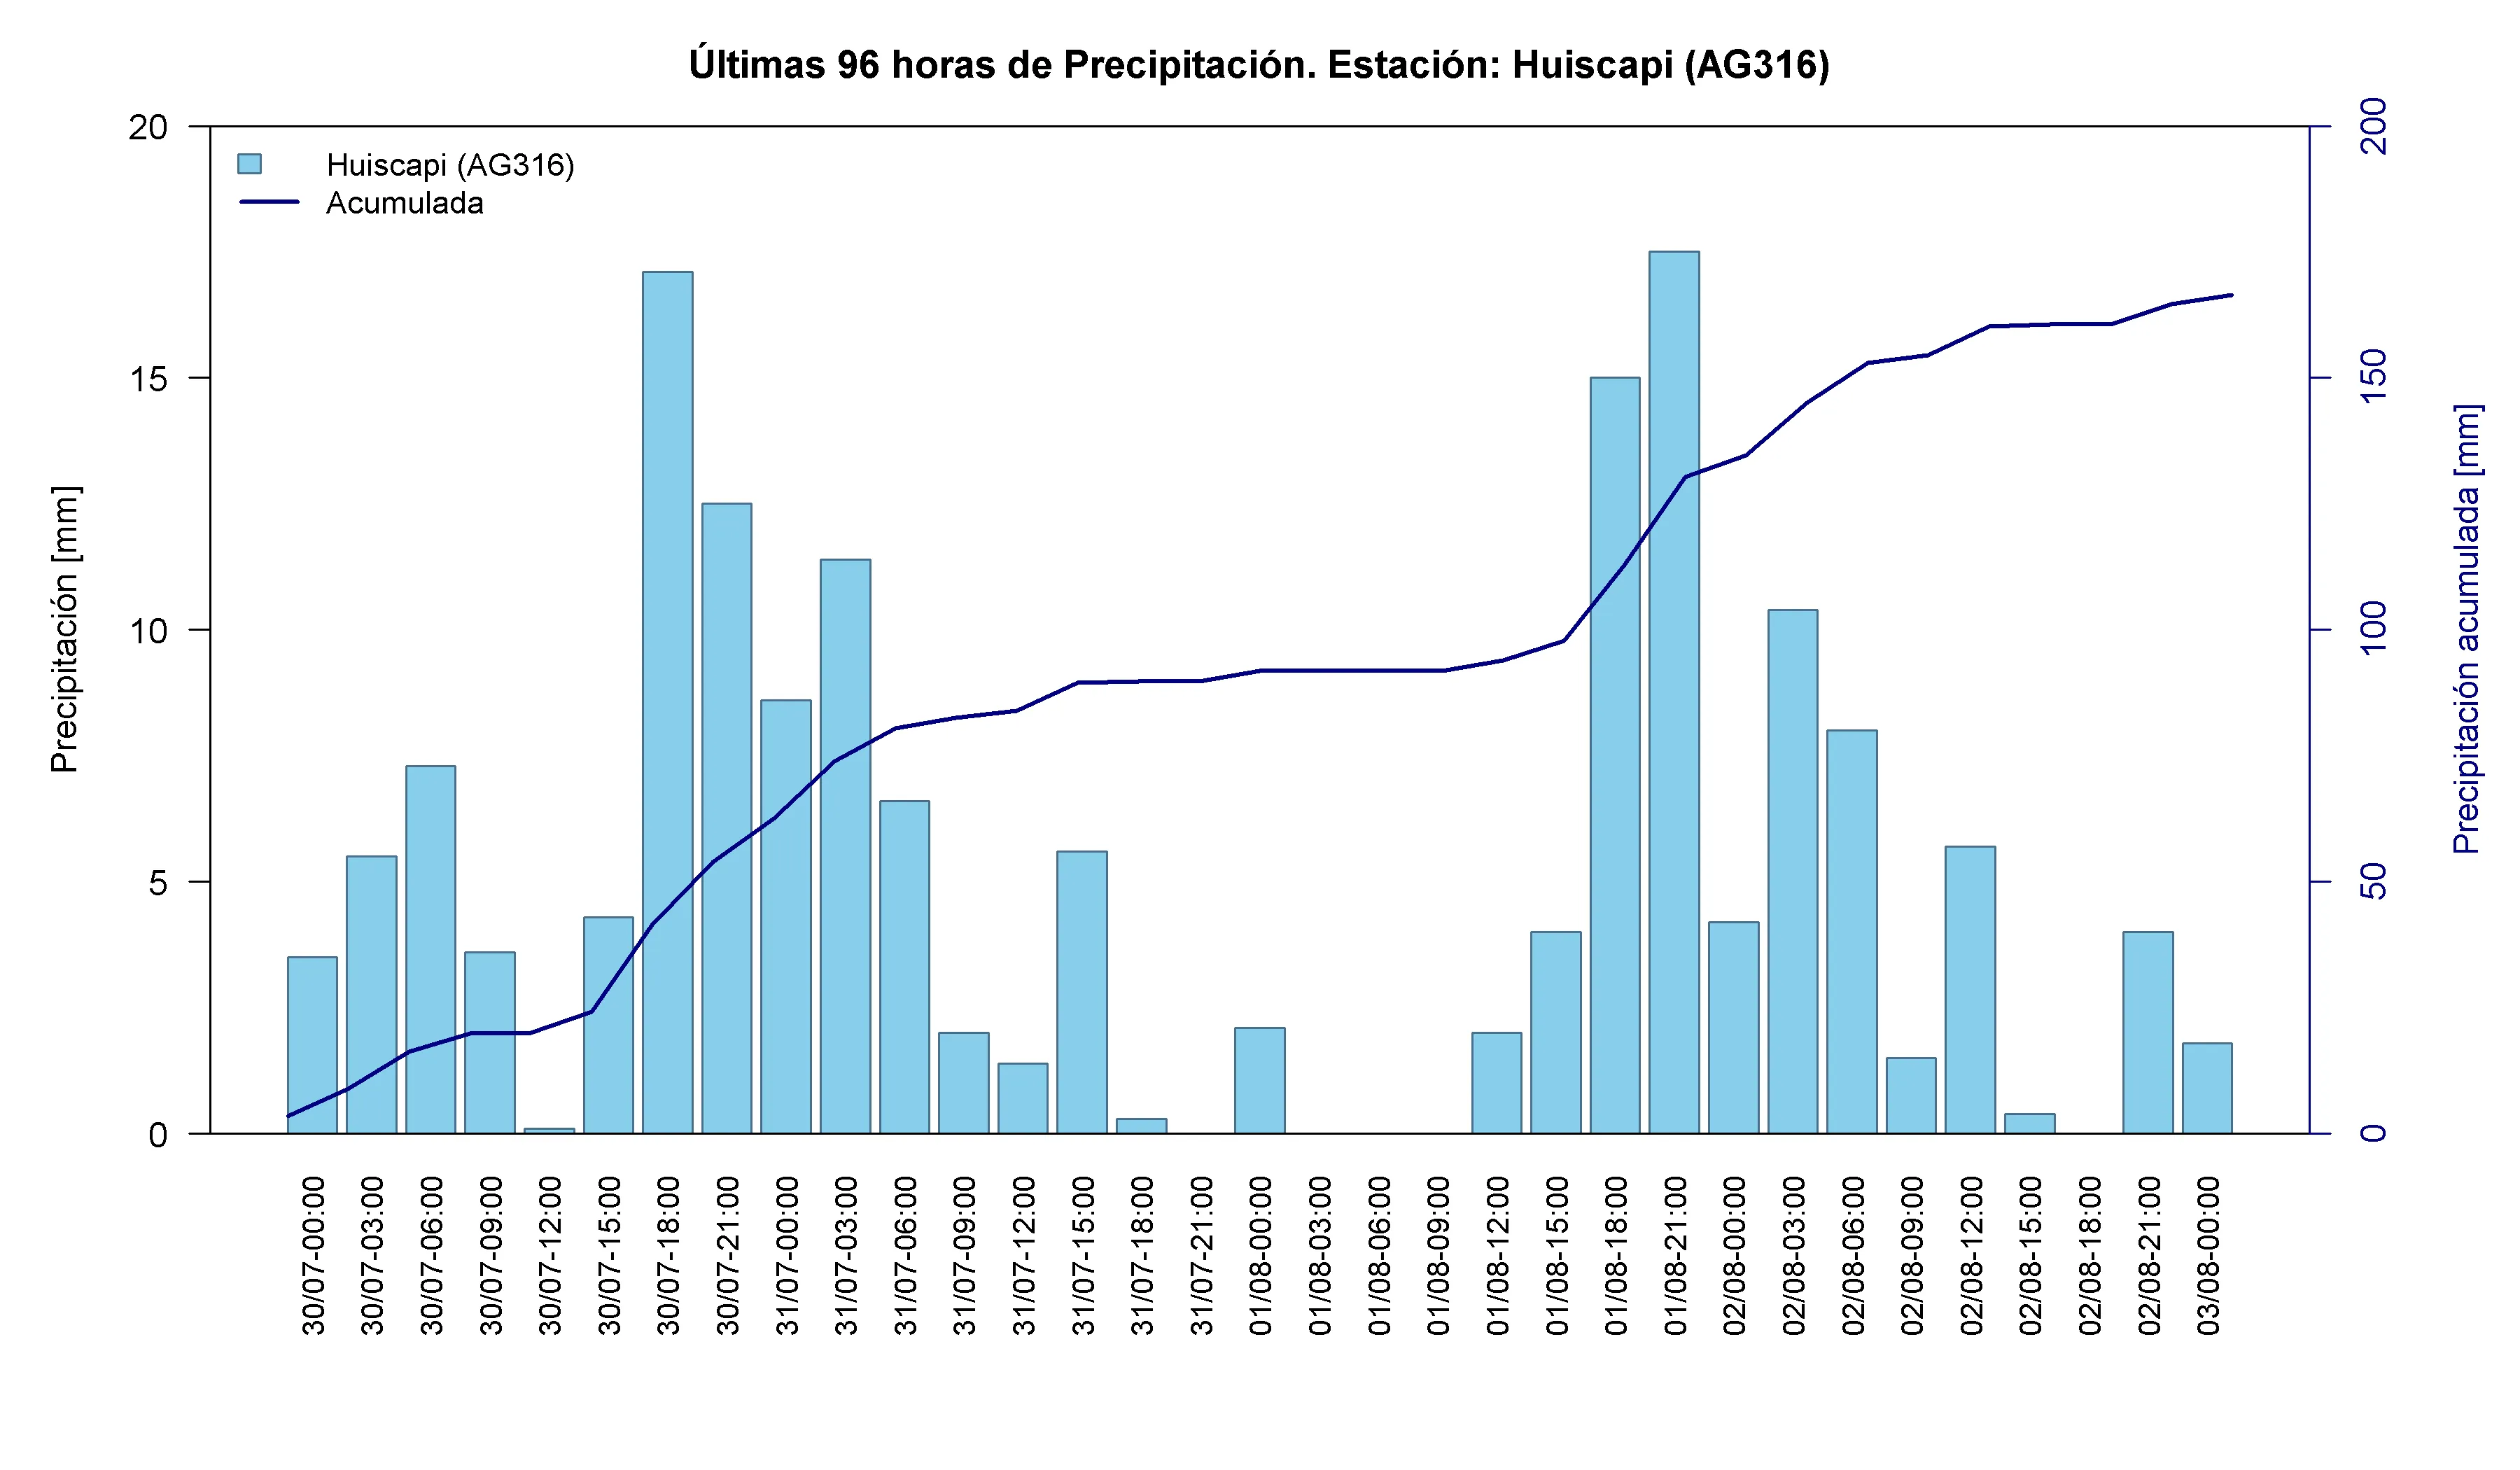
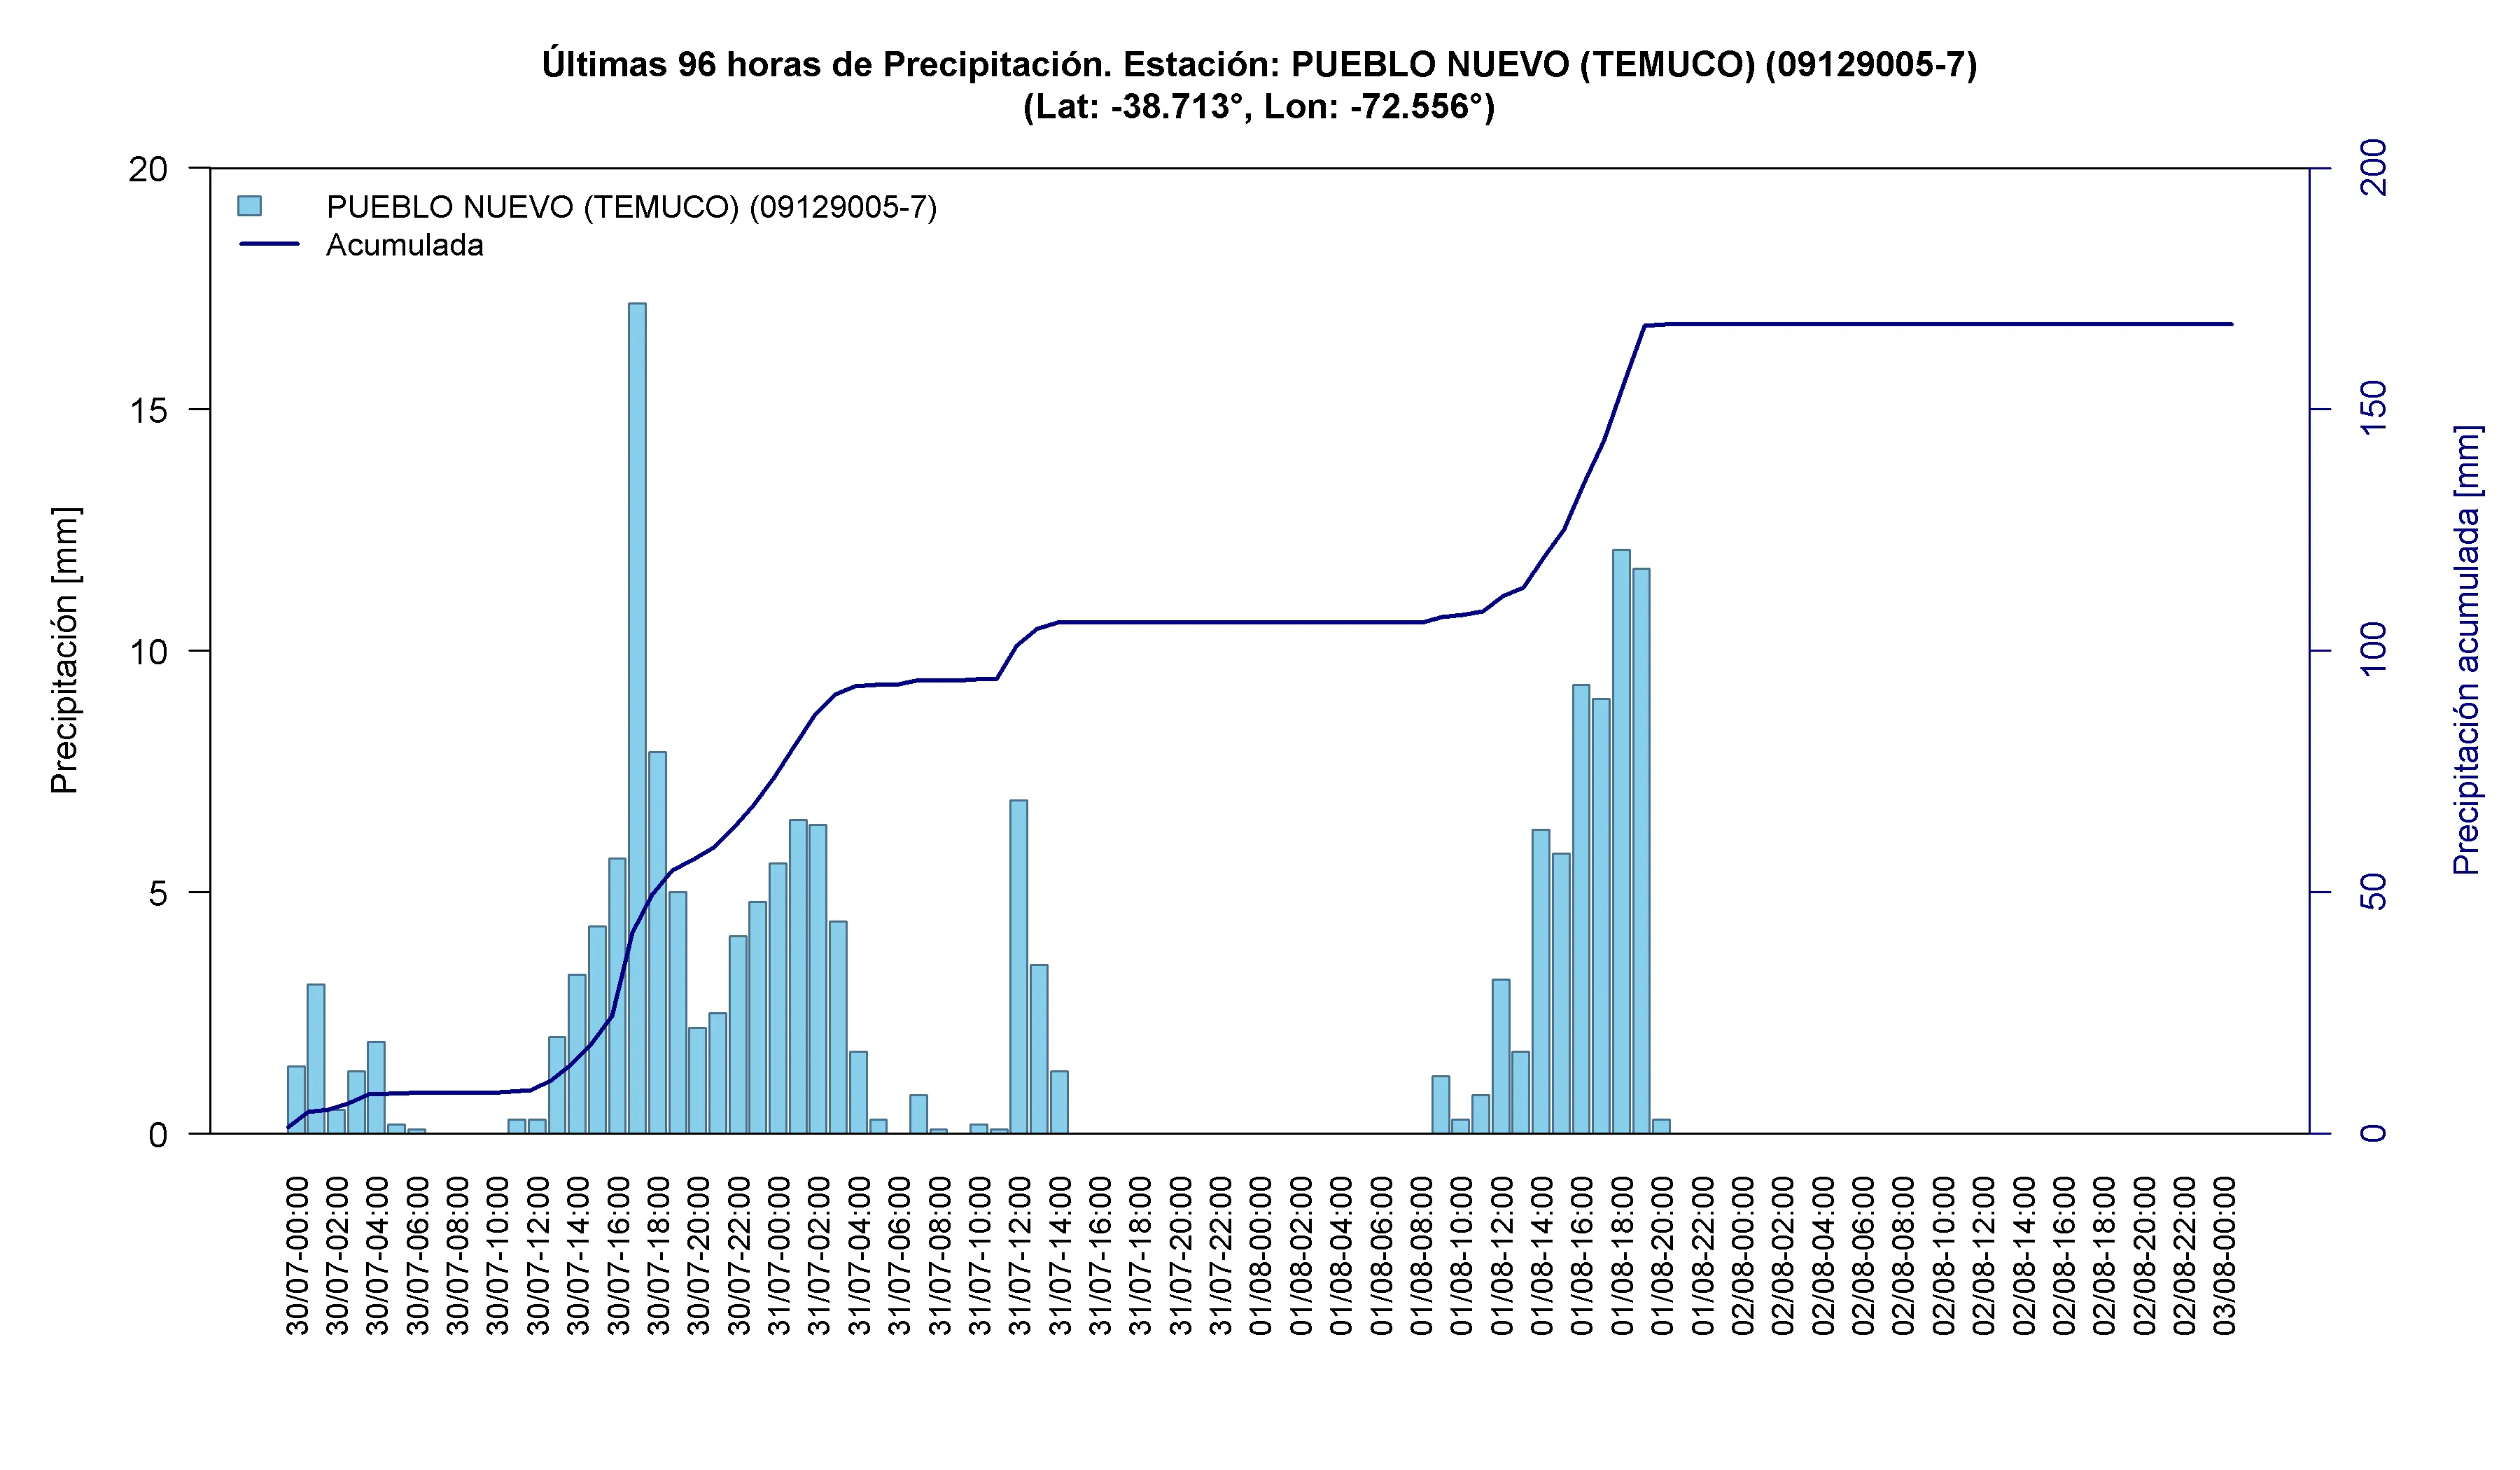
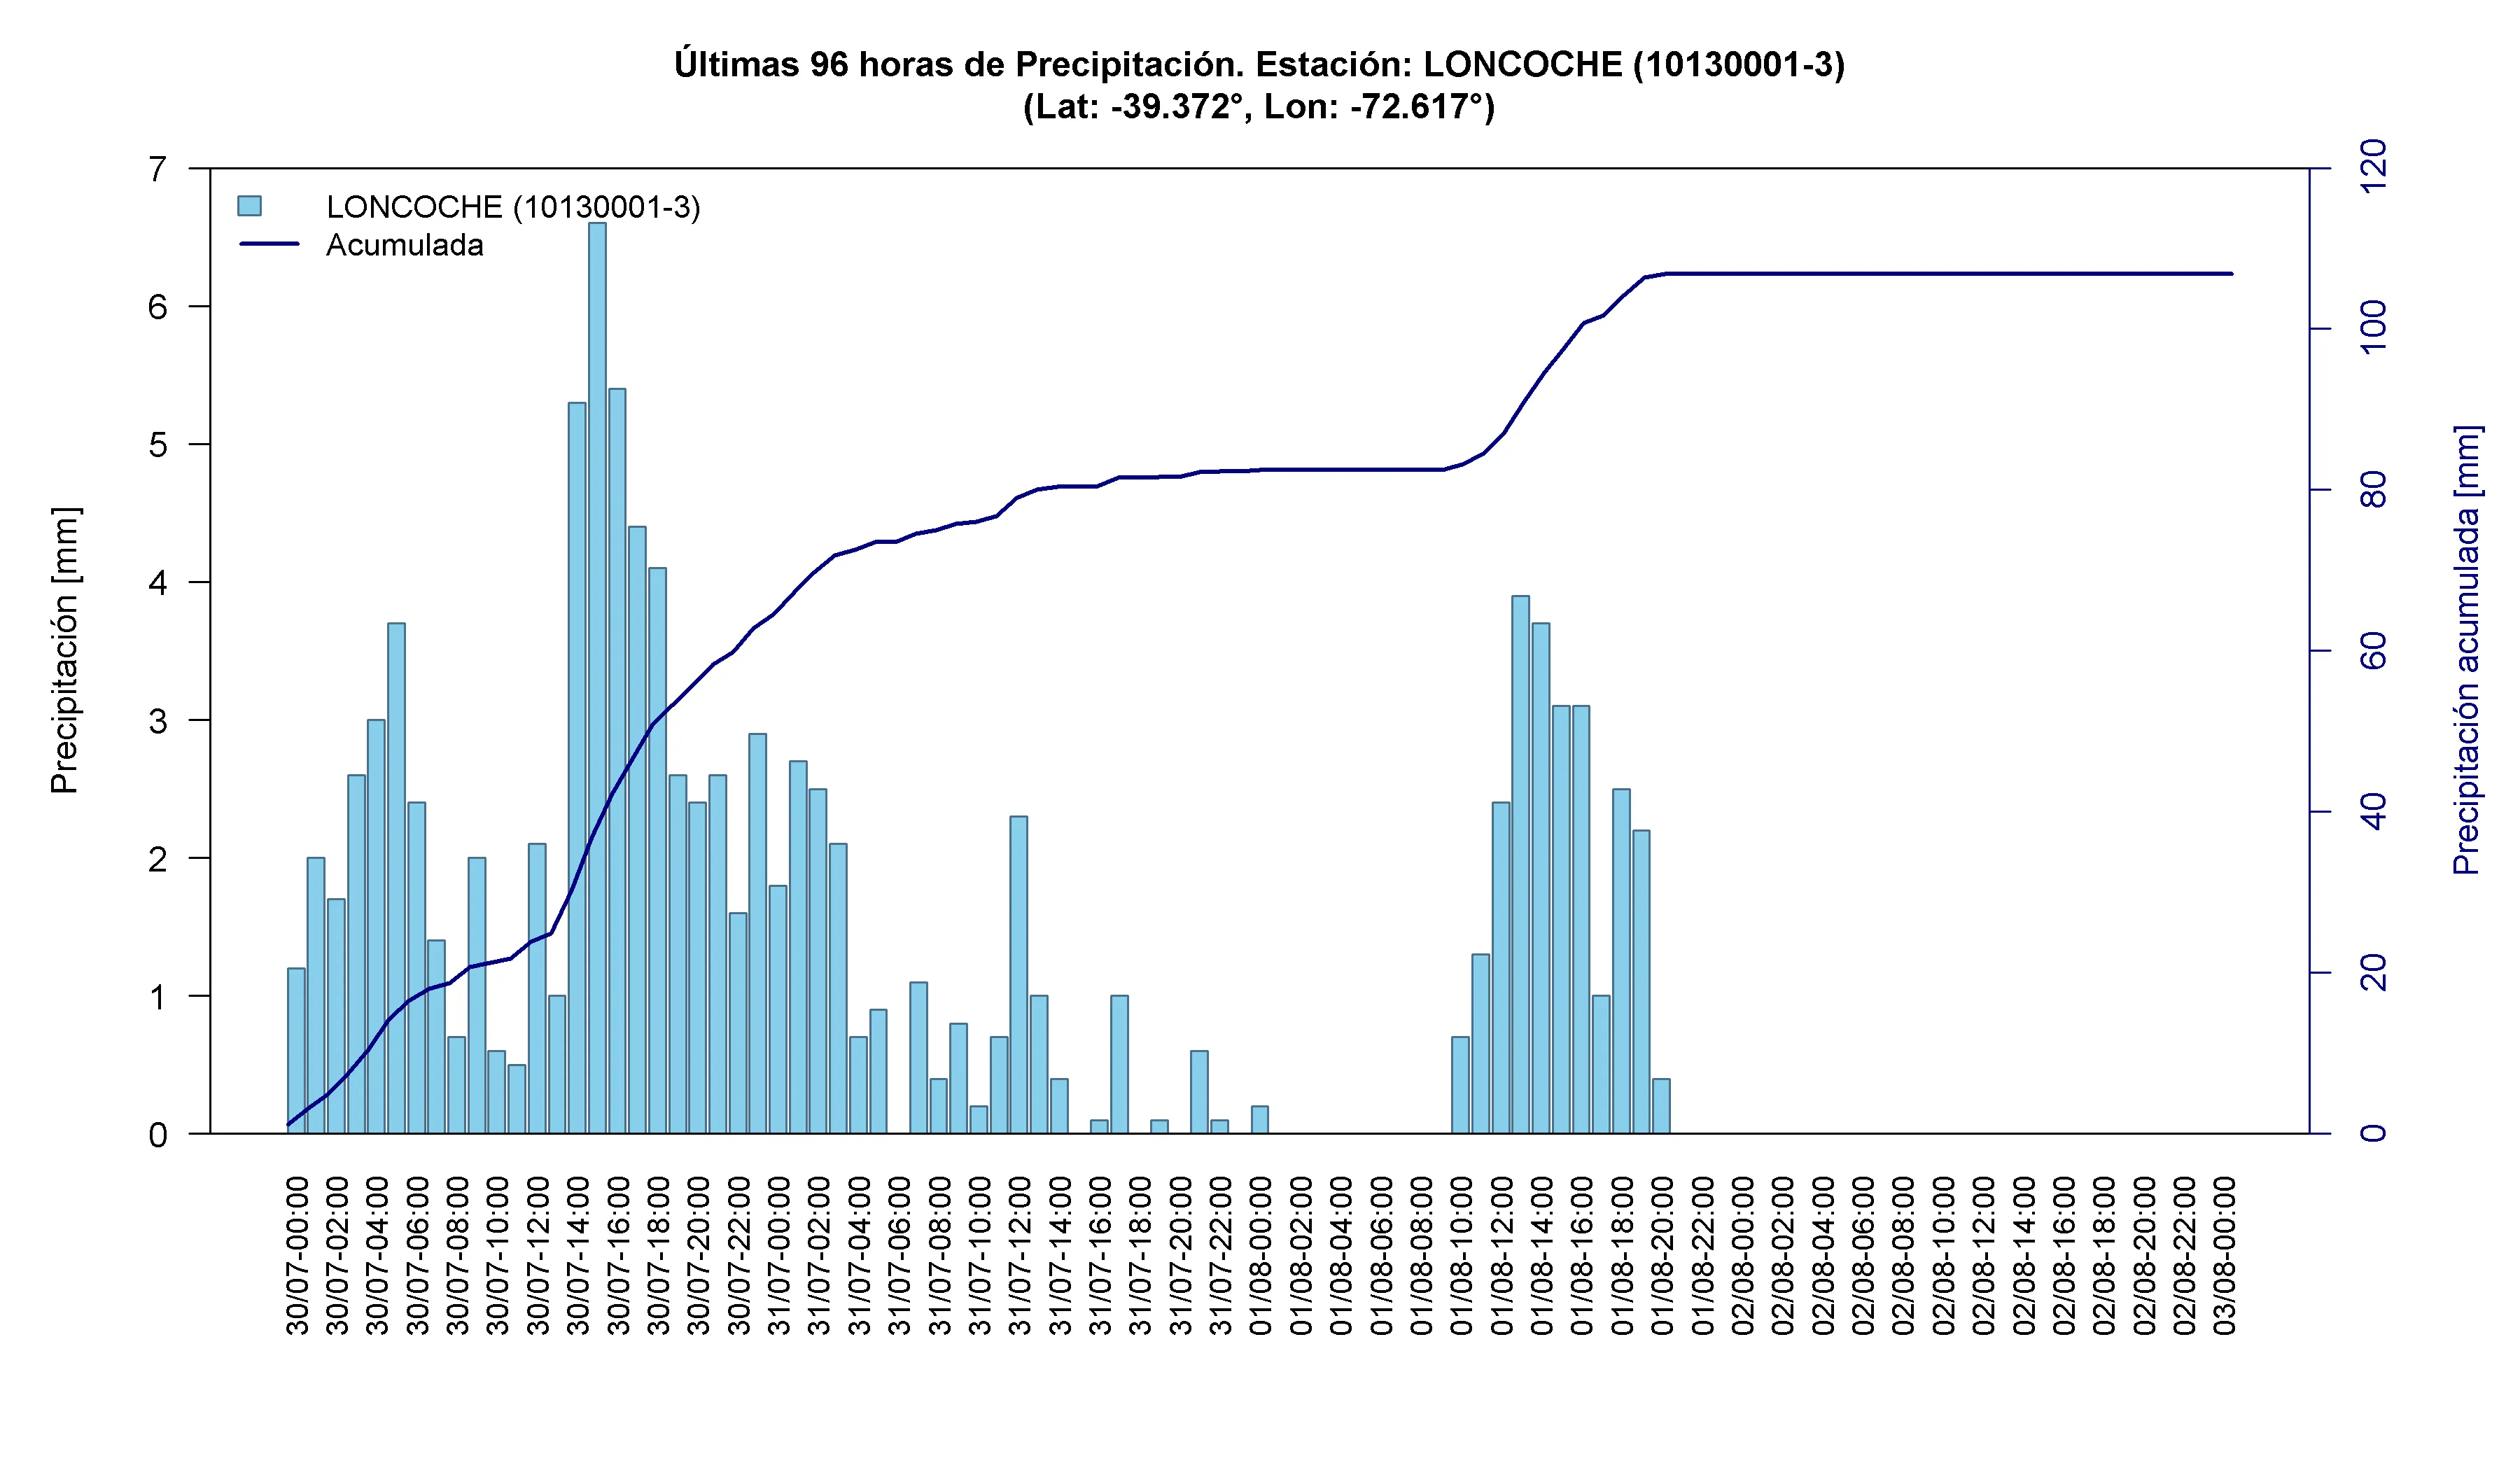
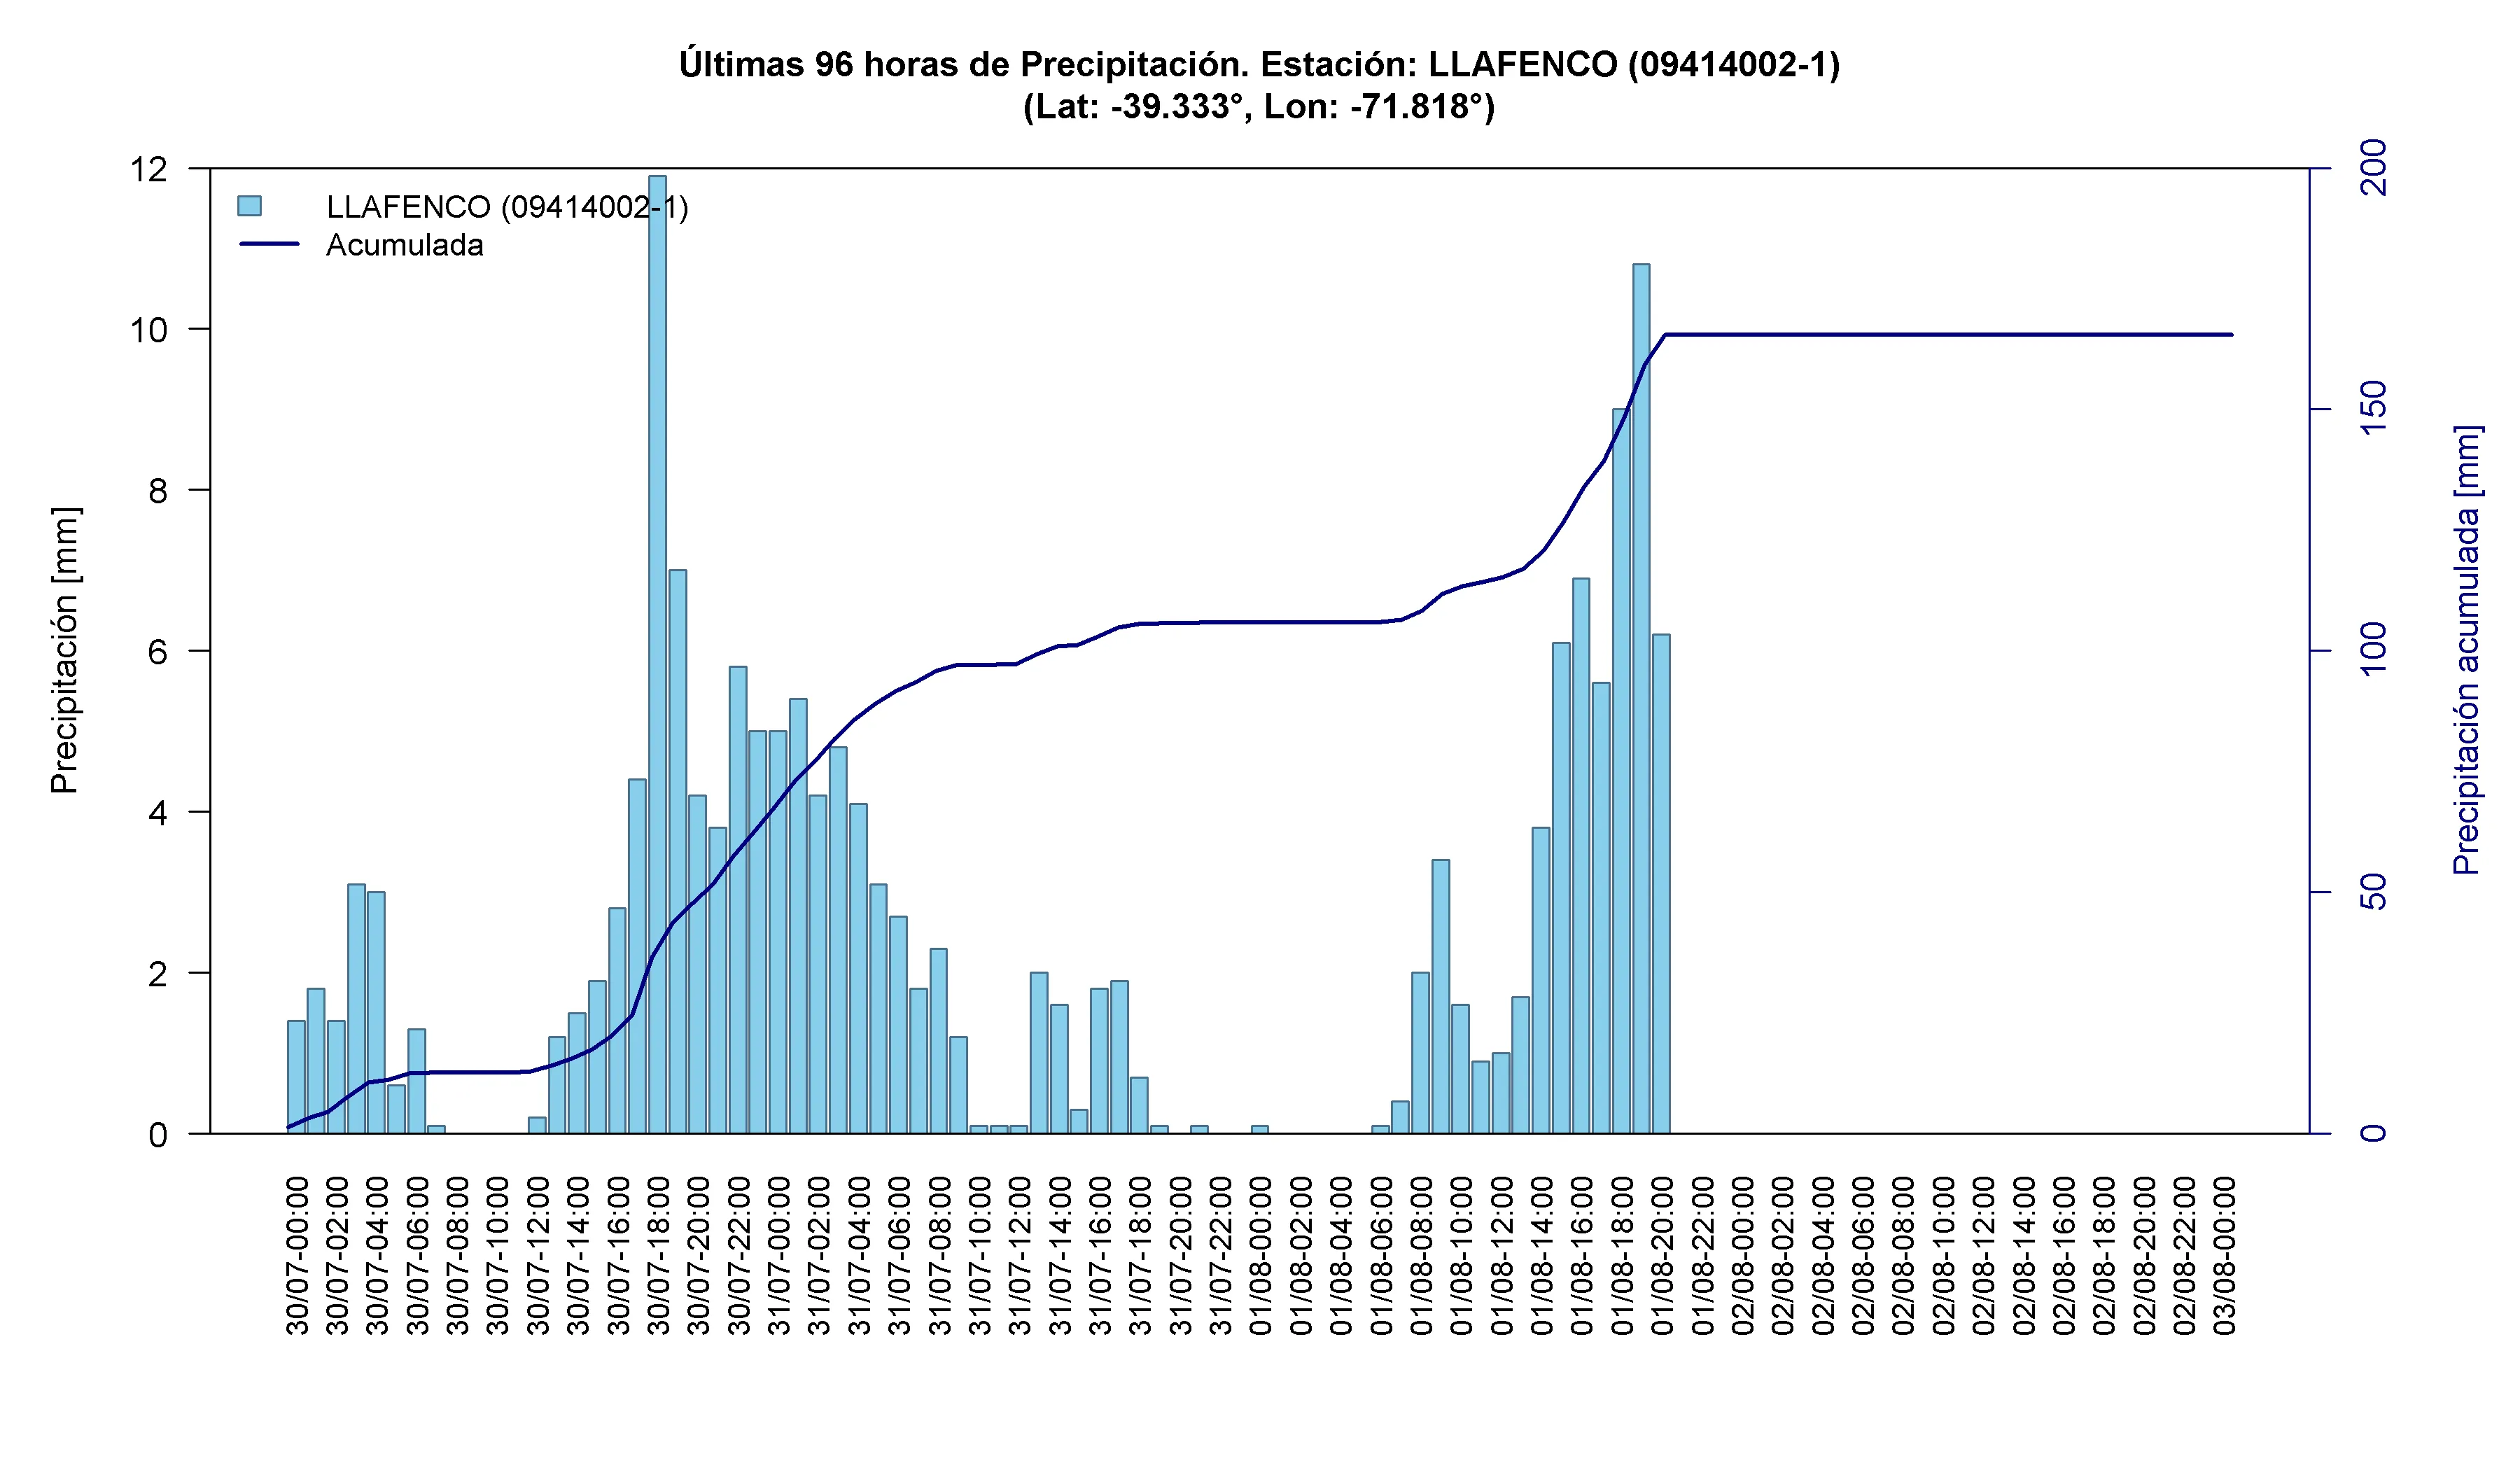
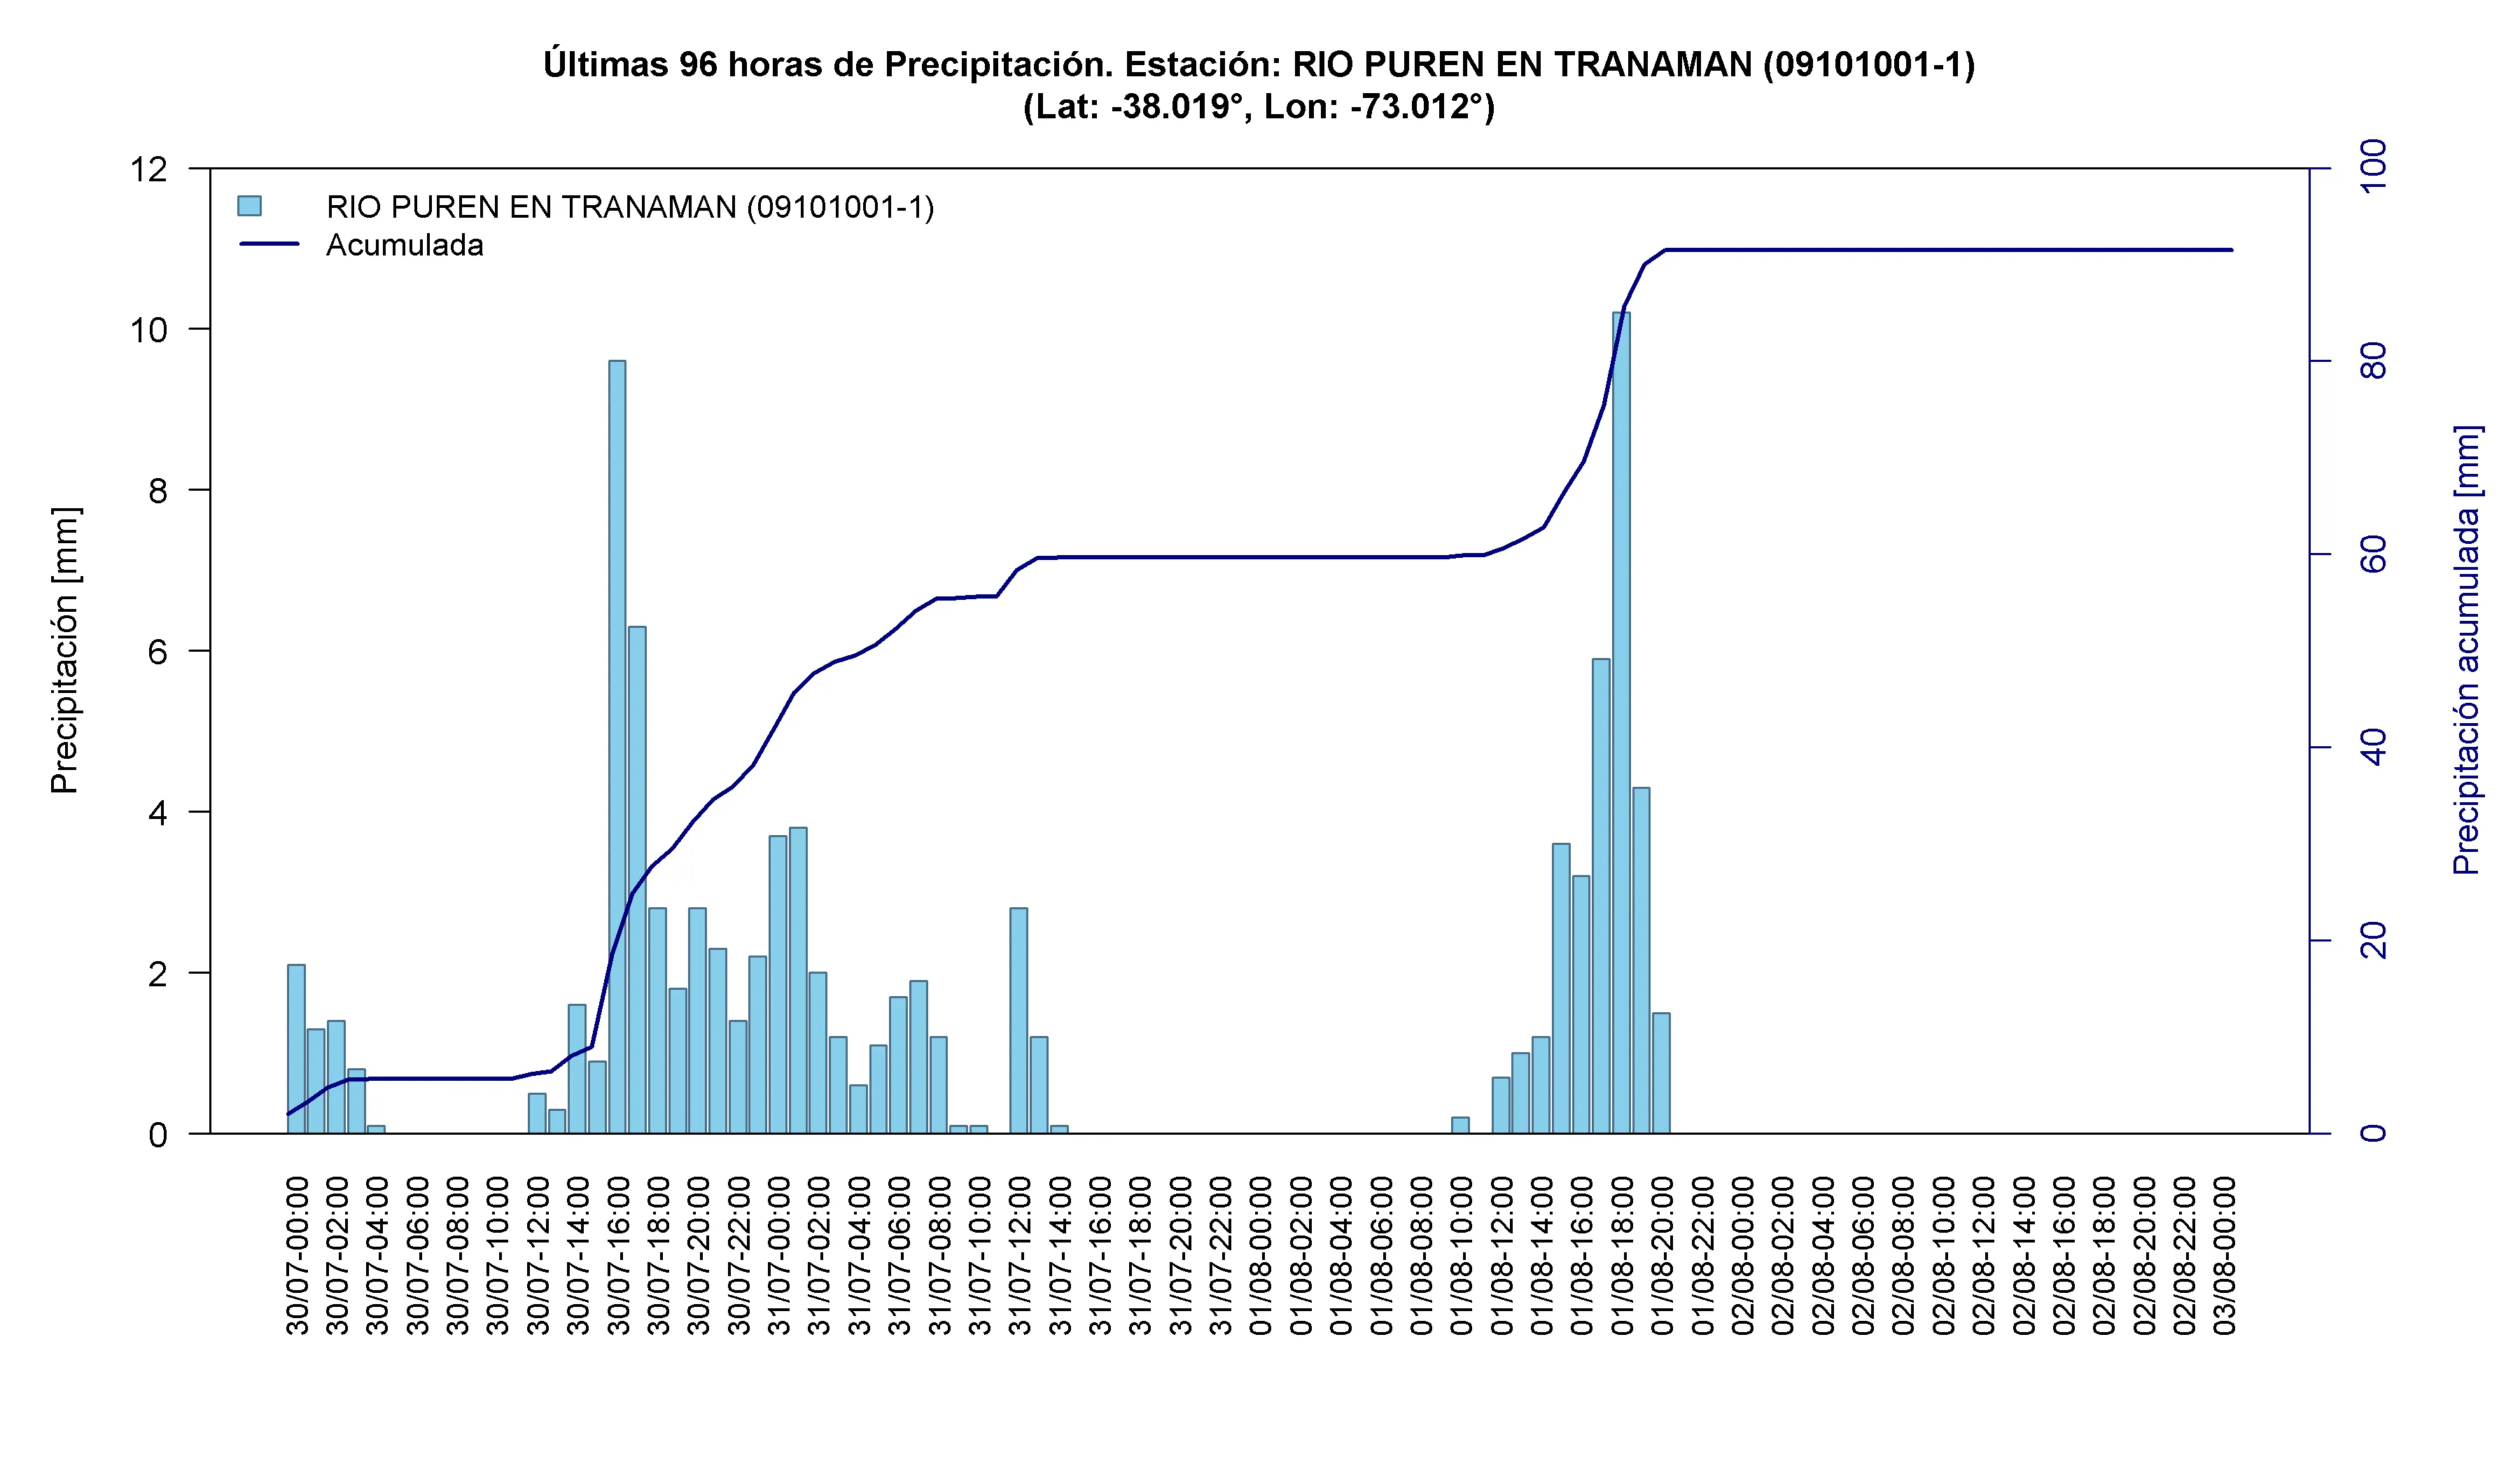
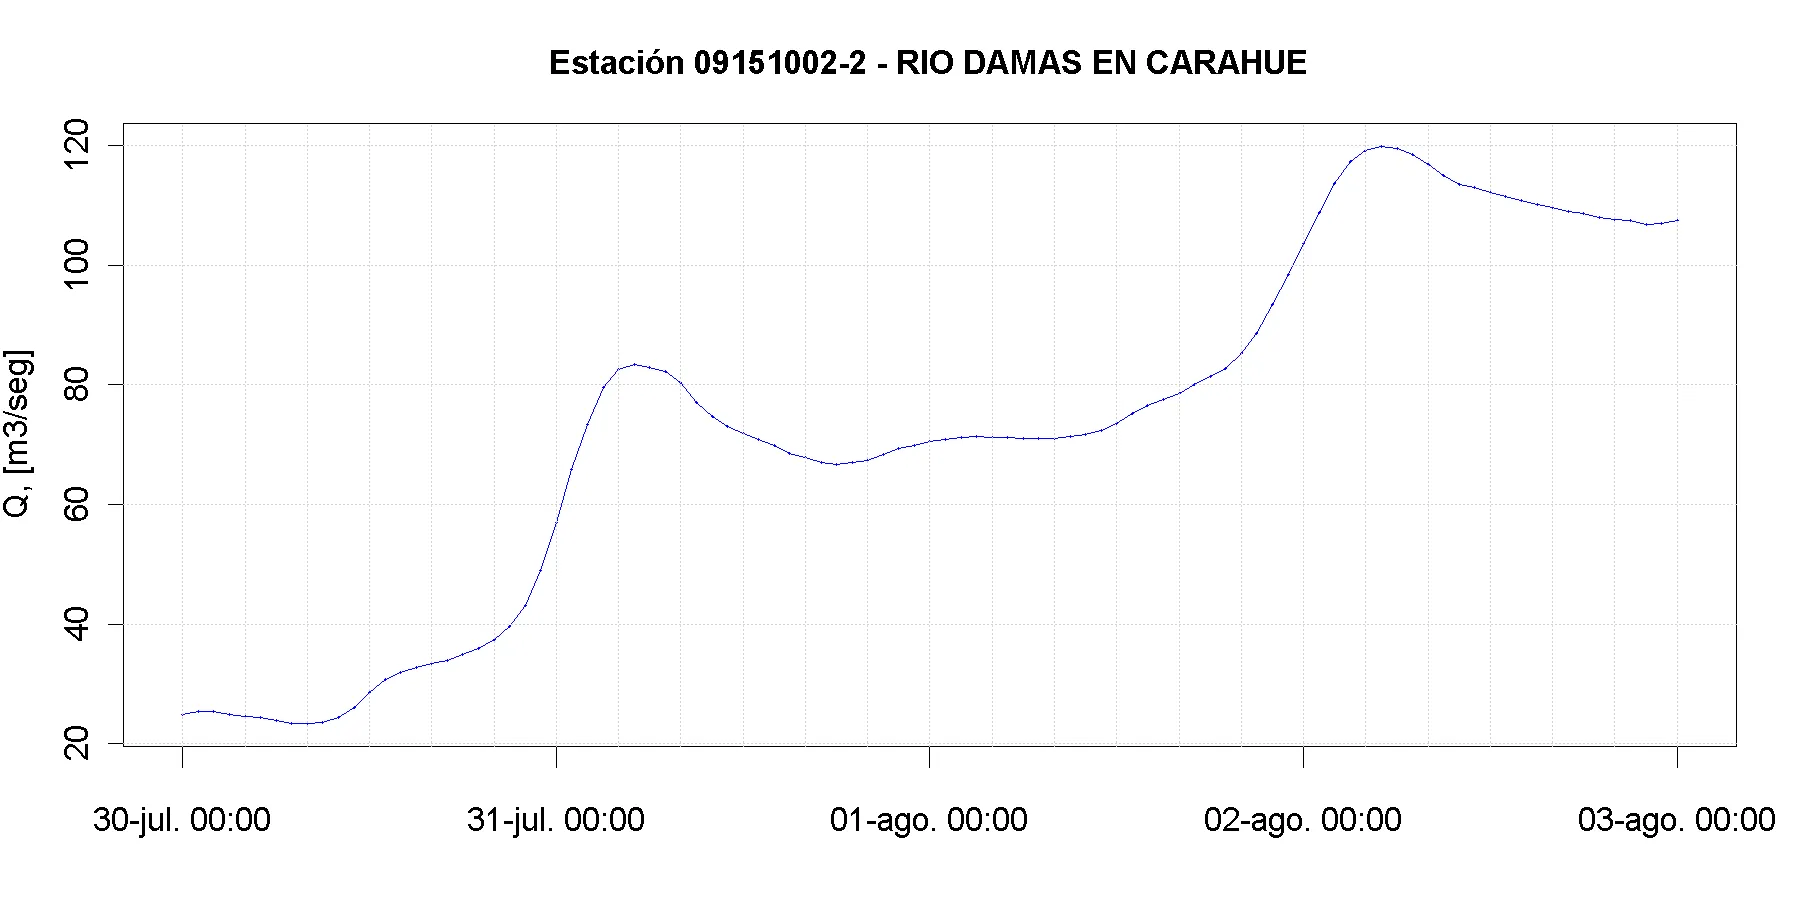
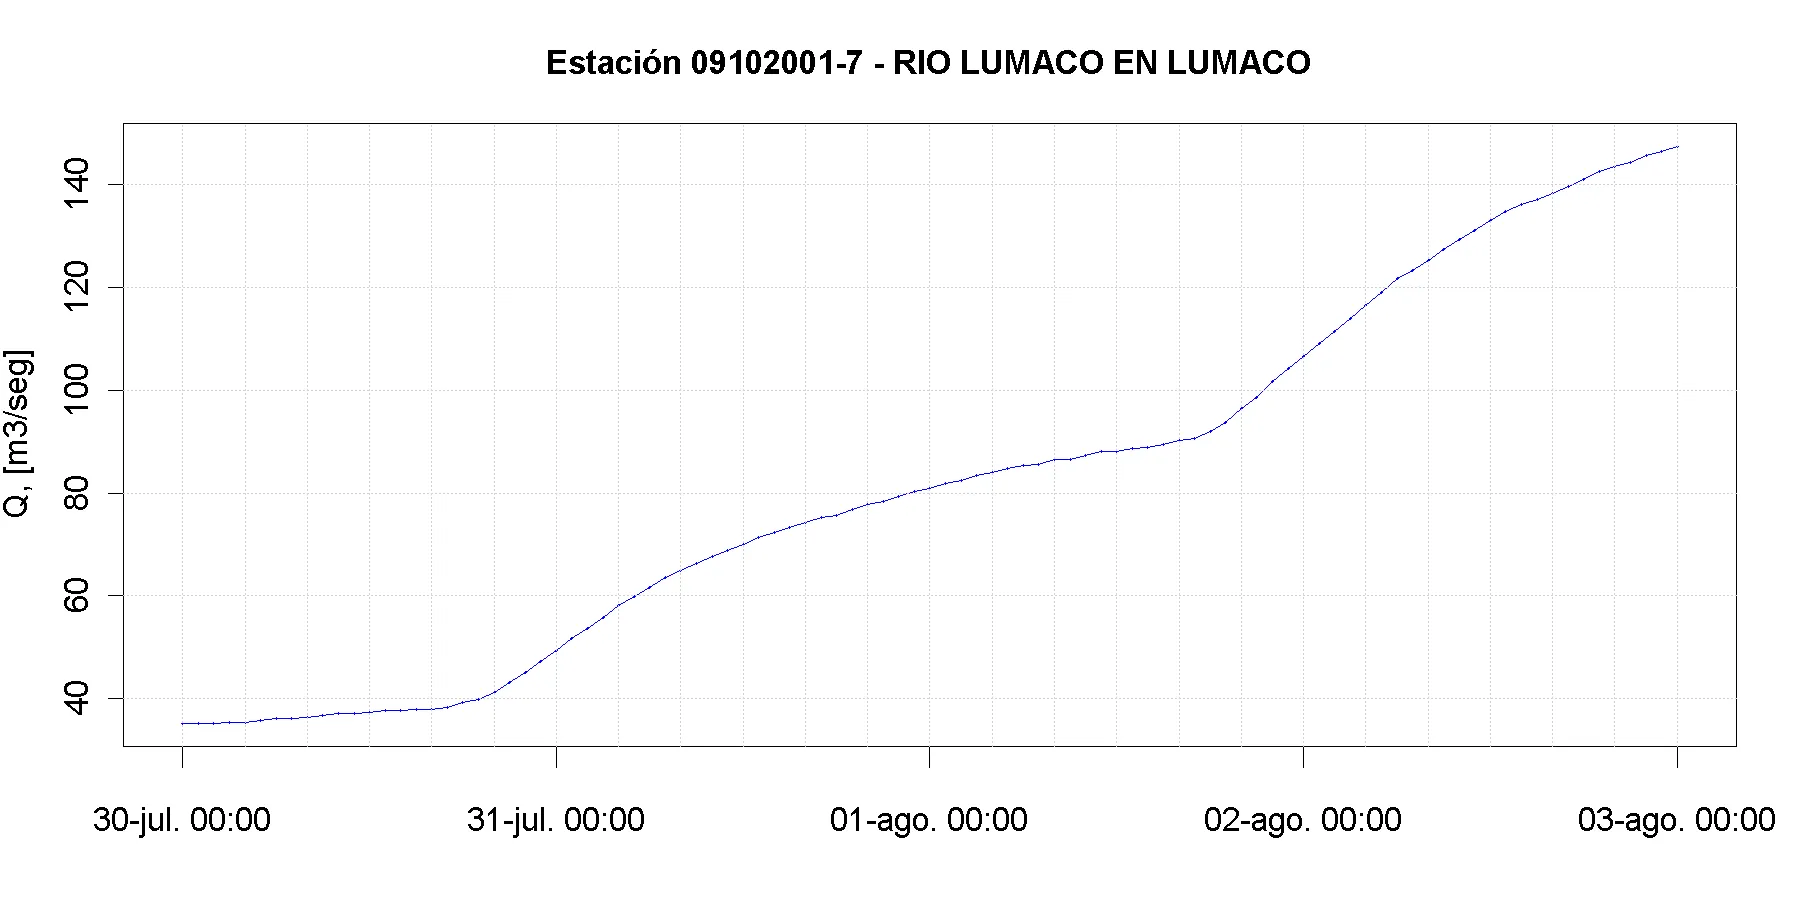
La Araucanía was the region with the highest isolation burden in the country: 5,032 isolated people ⁵ . That figure points to a rural road network highly exposed to washouts, landslides, saturated slopes and fast rises in small channels.
Map 2. Location of the rain-gauge stations analyzed in La Araucanía during the frontal system. Source: own elaboration based on VisMet data.
Table 2. Accumulated precipitation at rain-gauge stations in La Araucanía between 30 July and 2 August 2026.
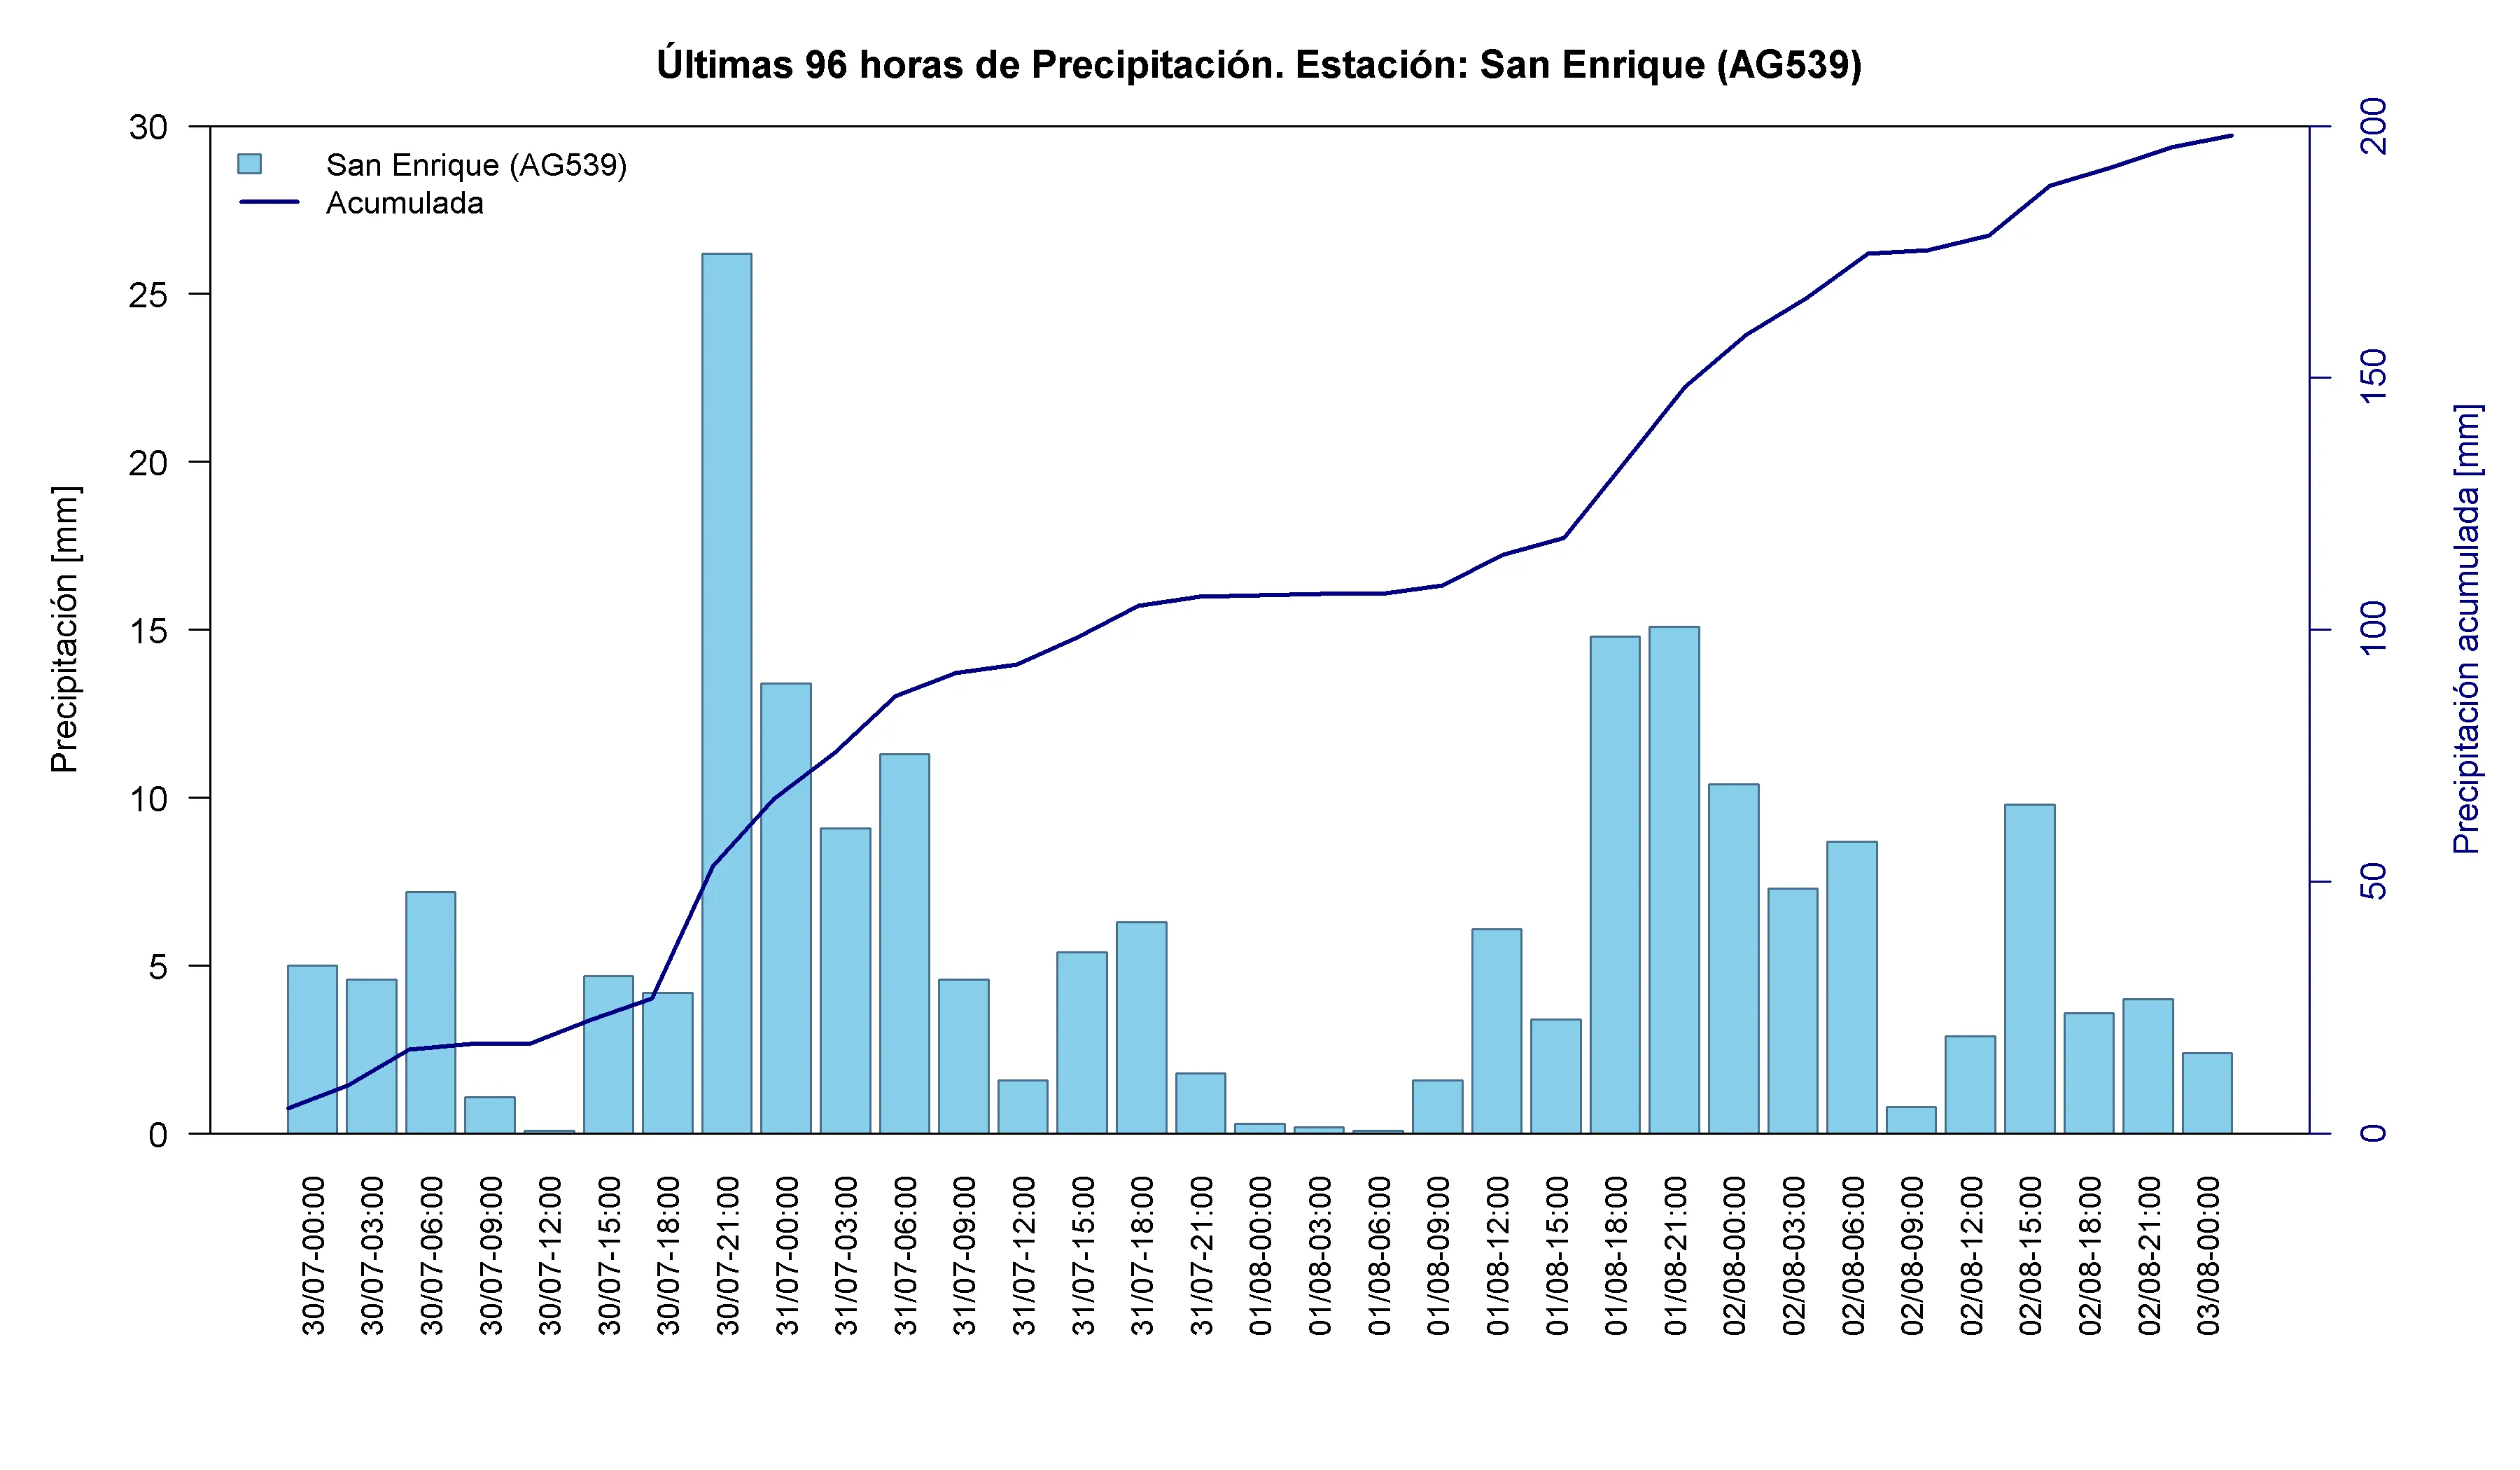
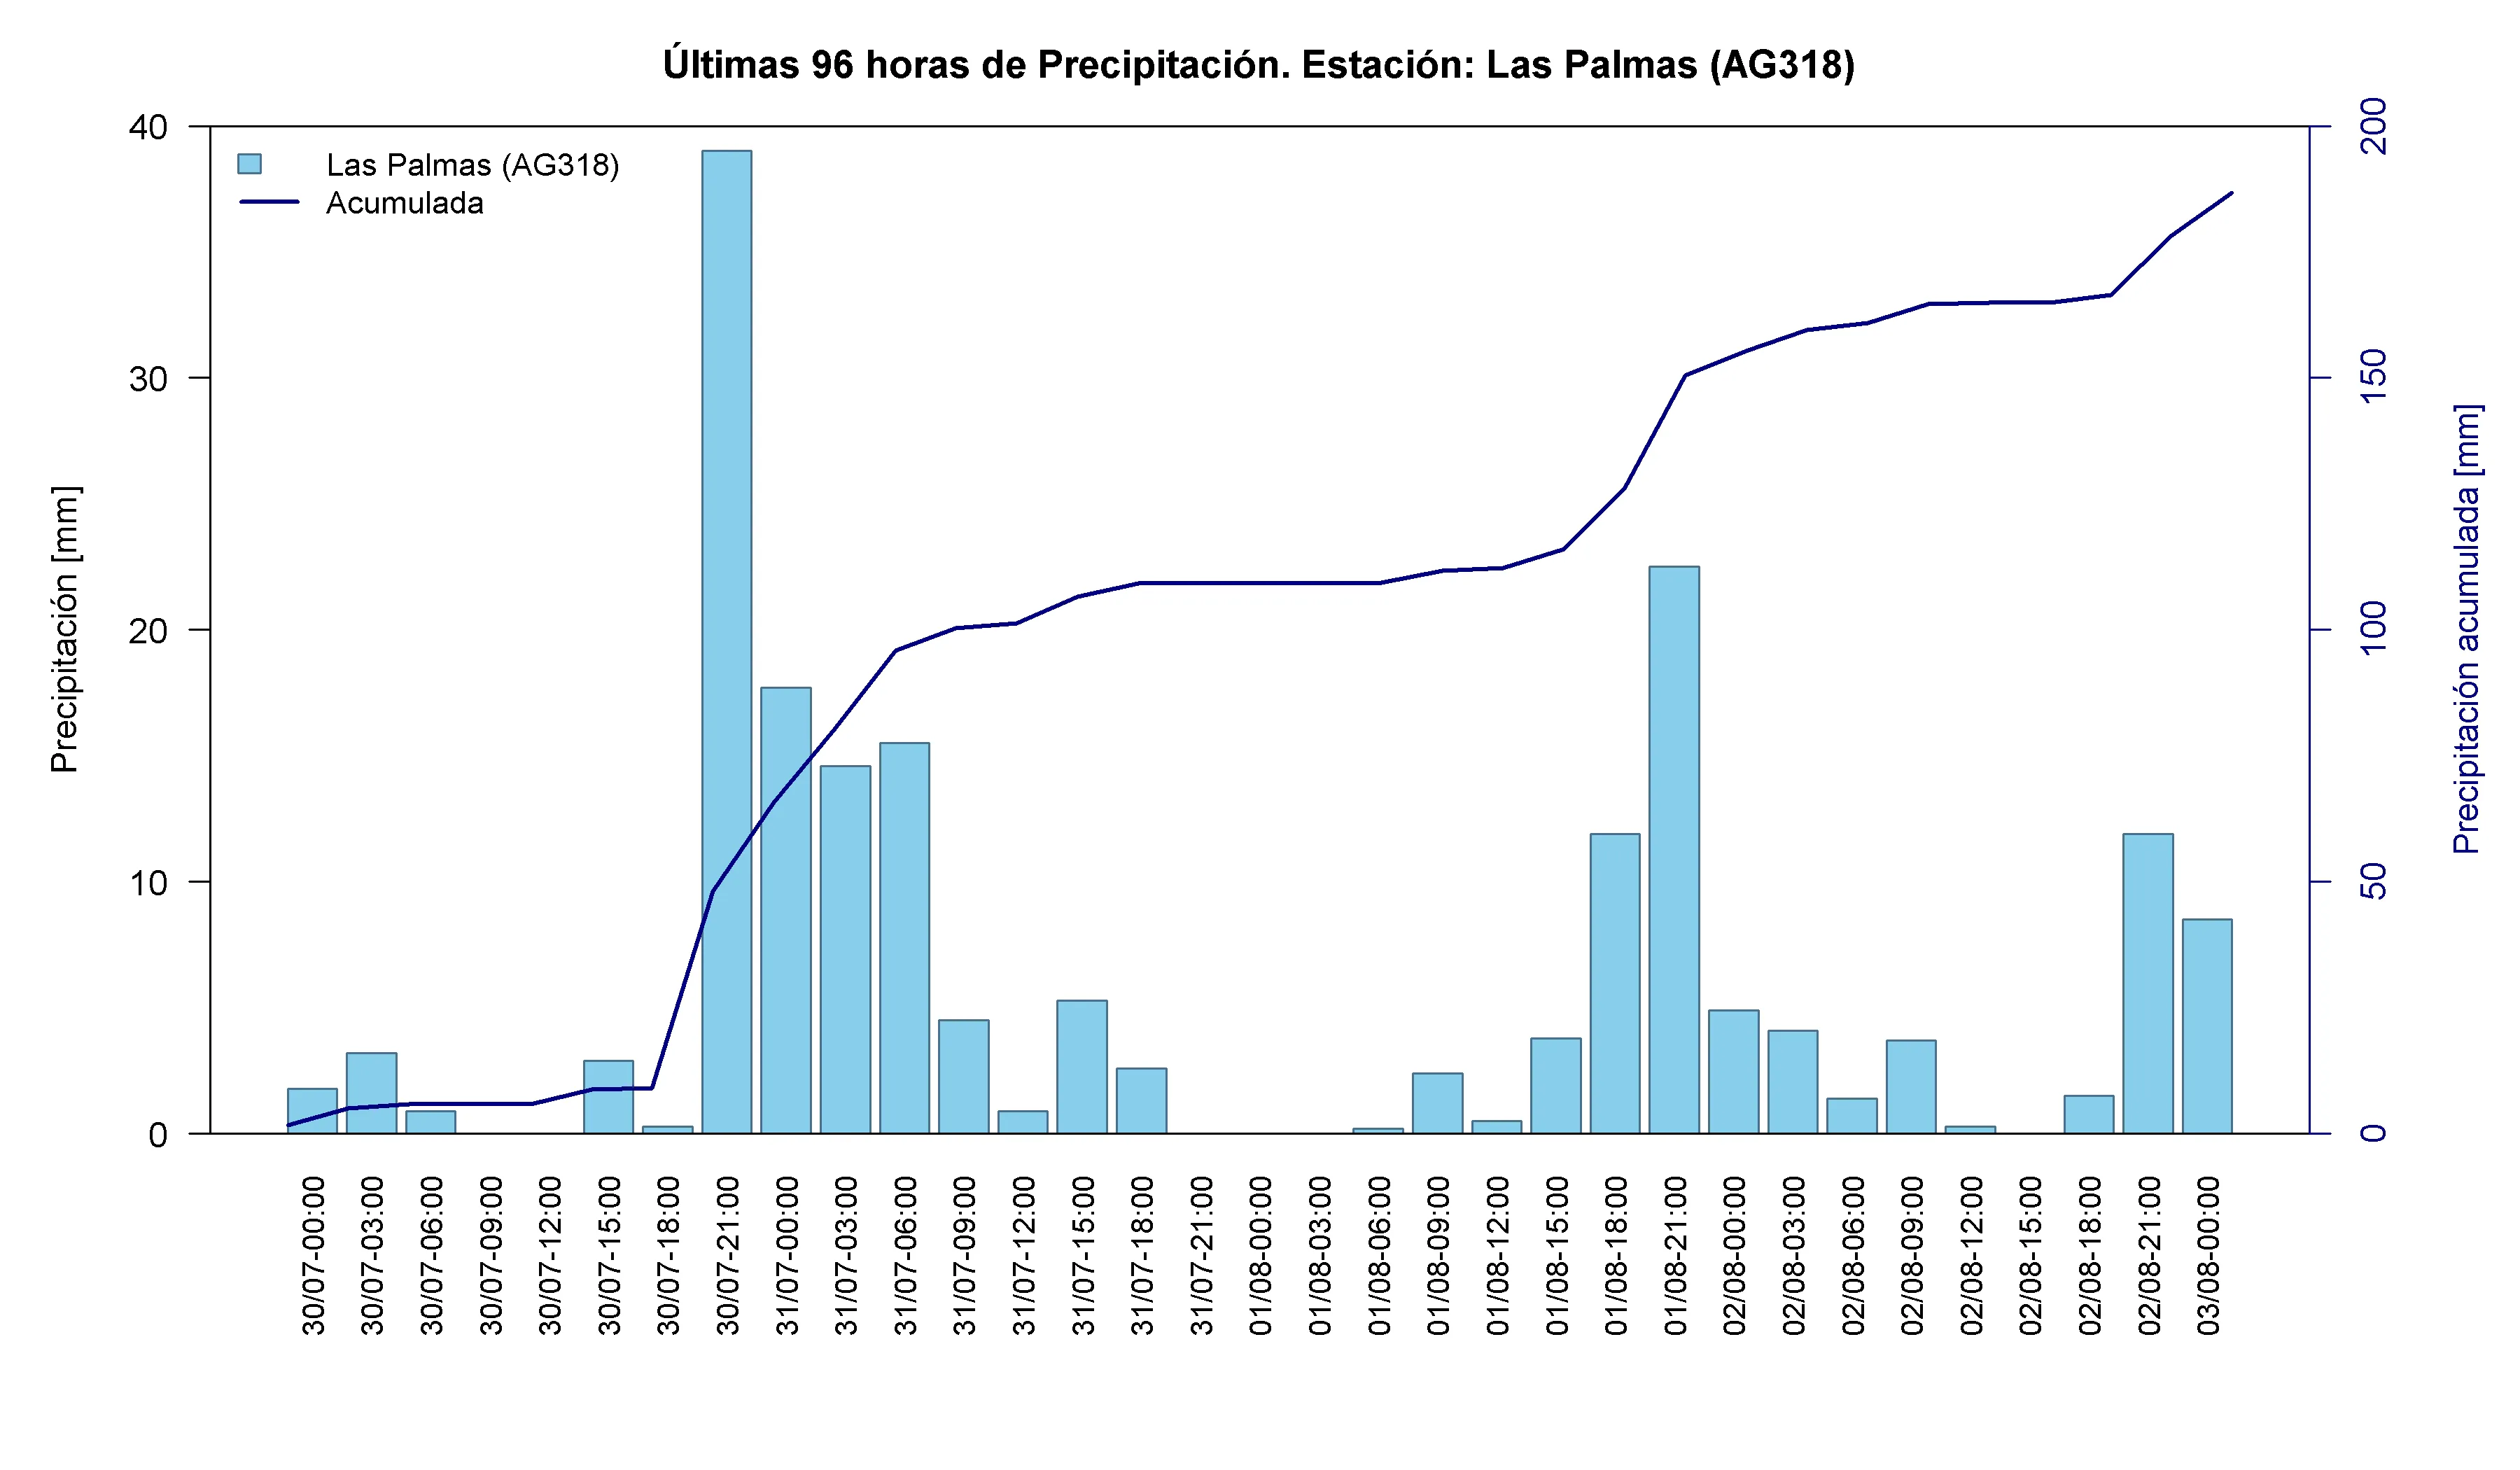
Time series: highest accumulated precipitation stations
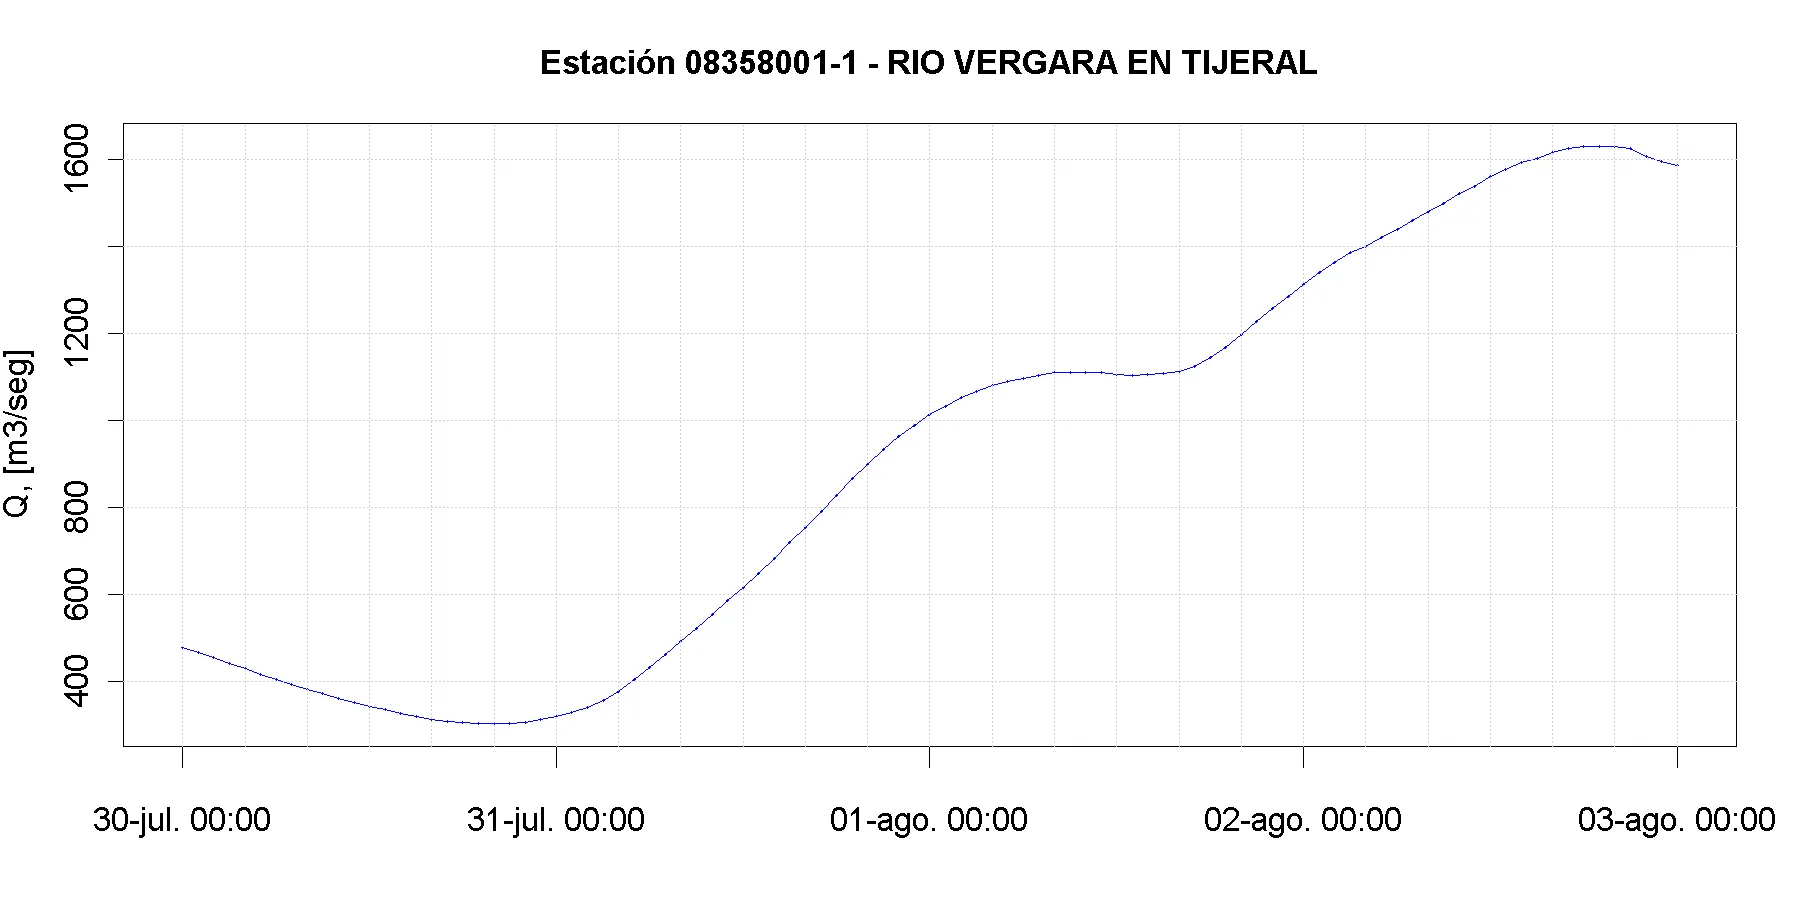
Nearby DGA stations and streamflow
Biobío Region
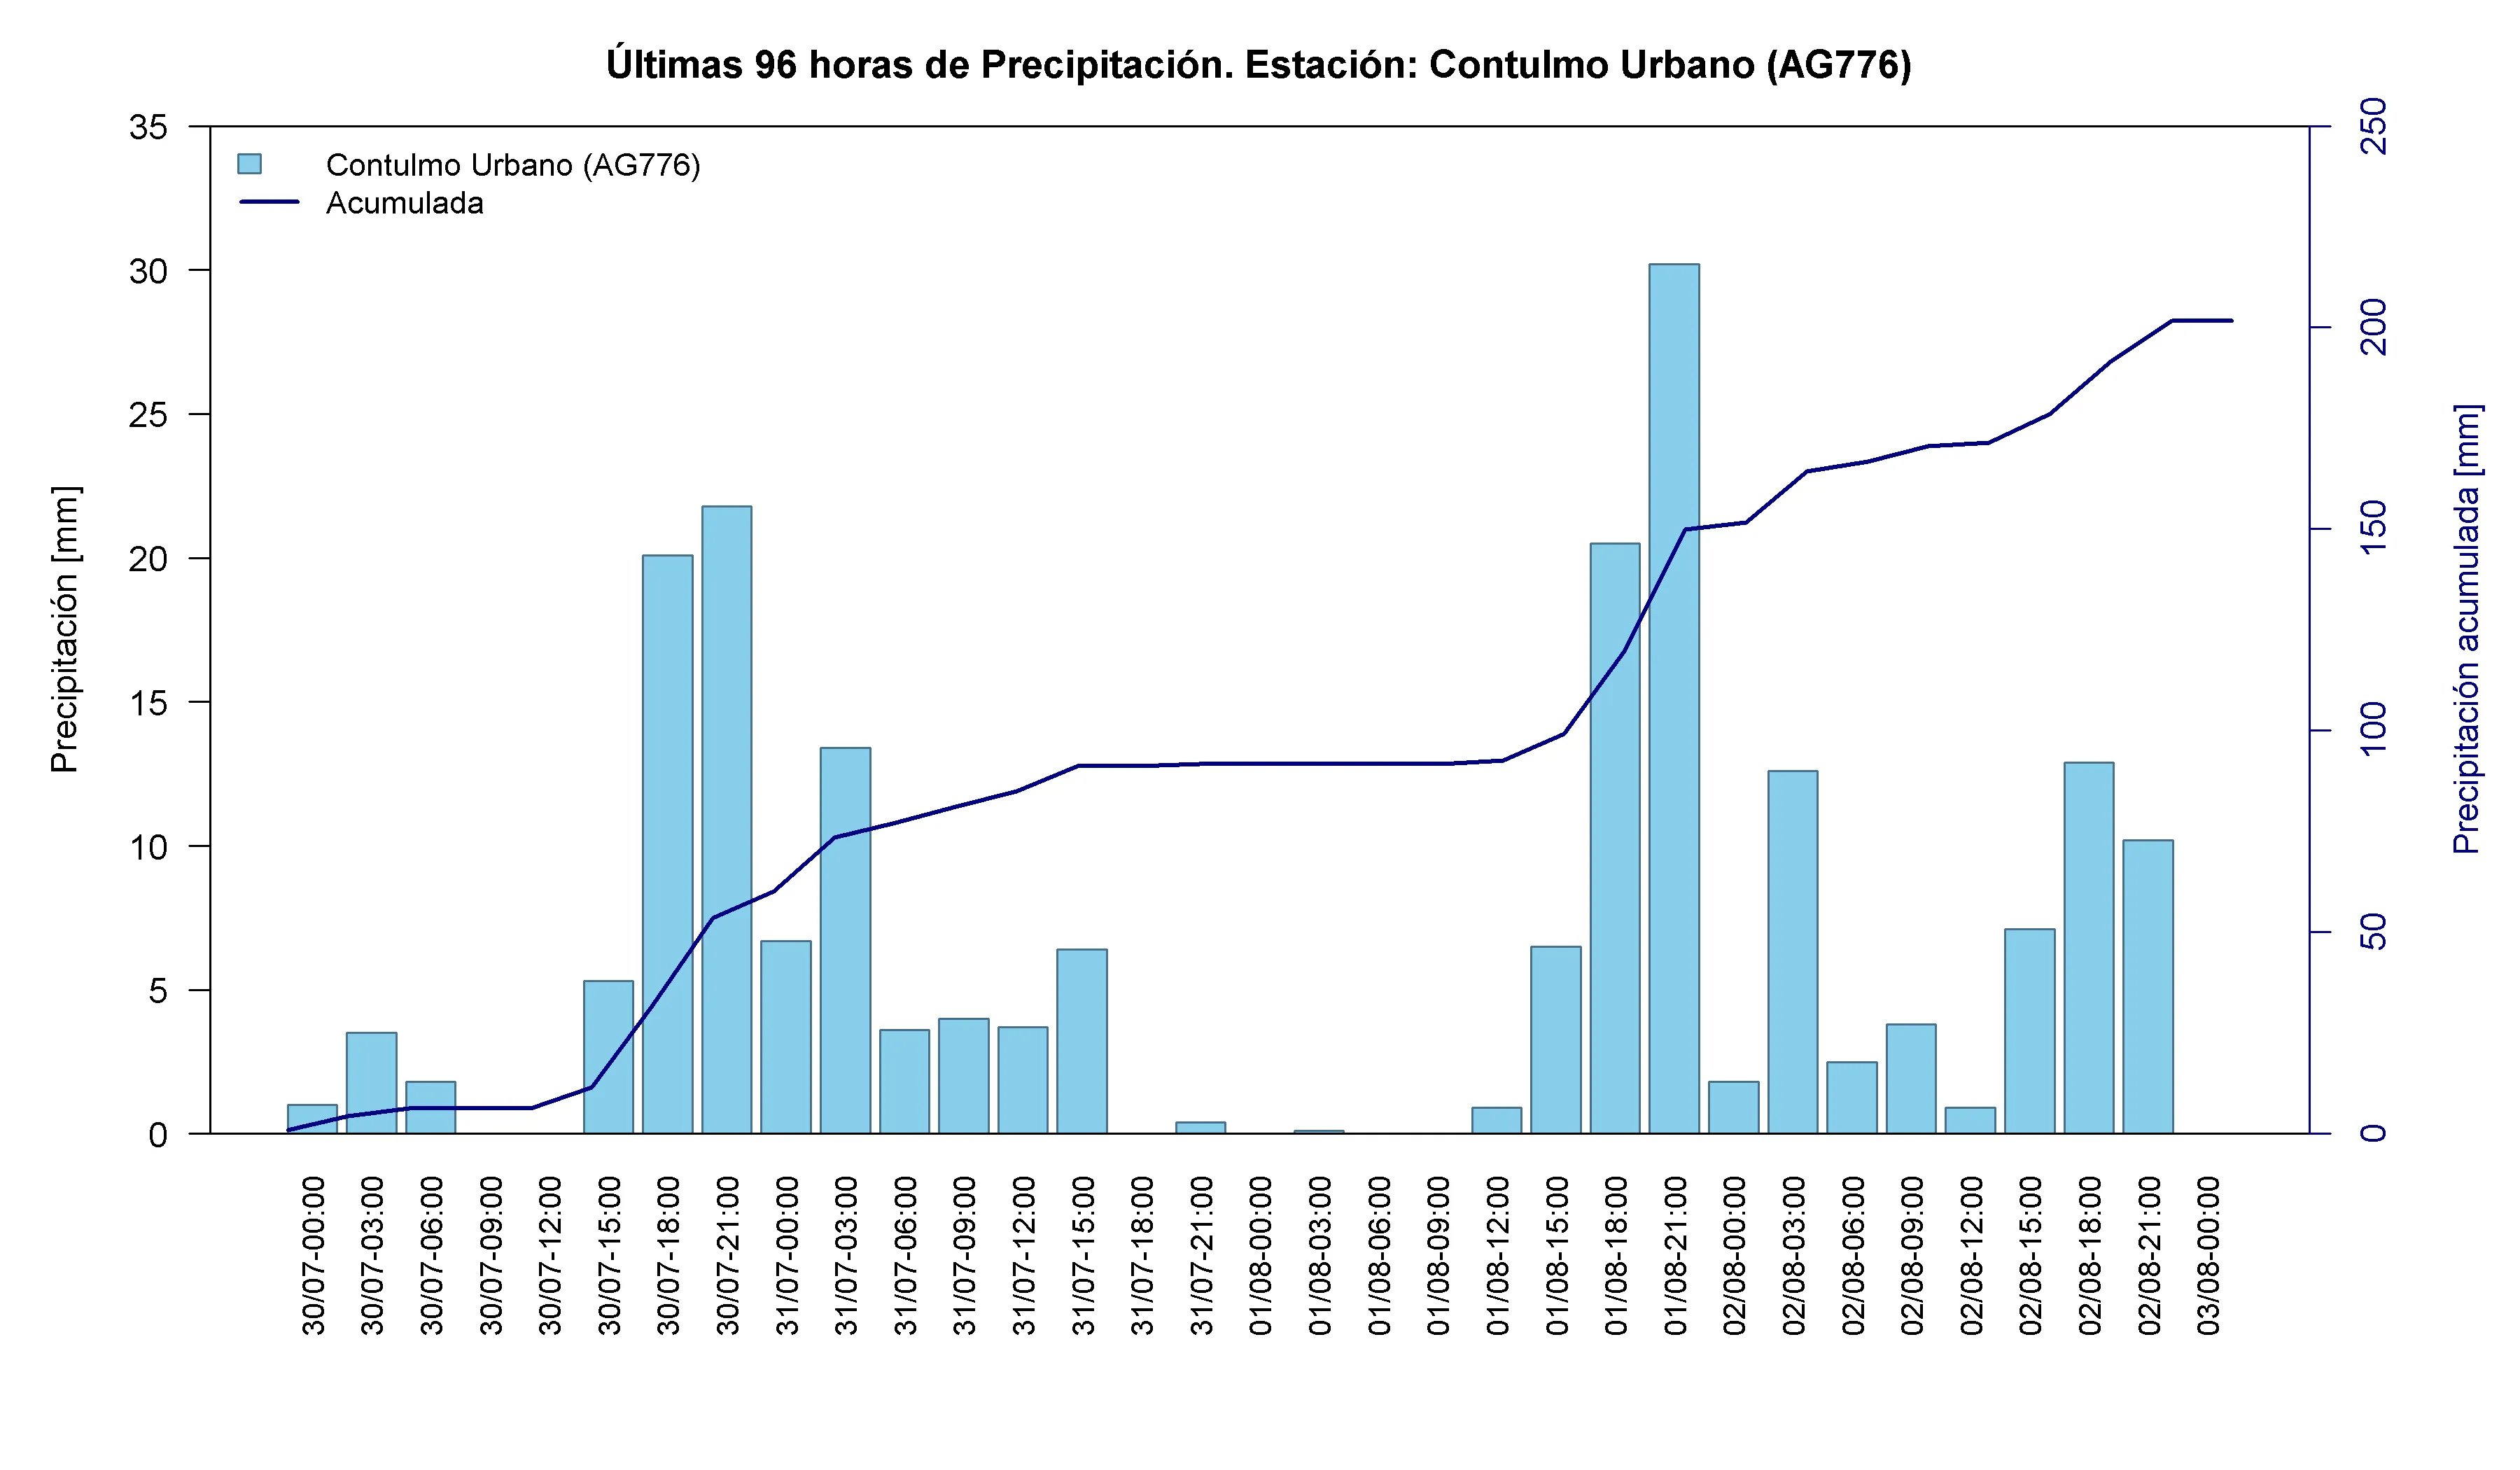
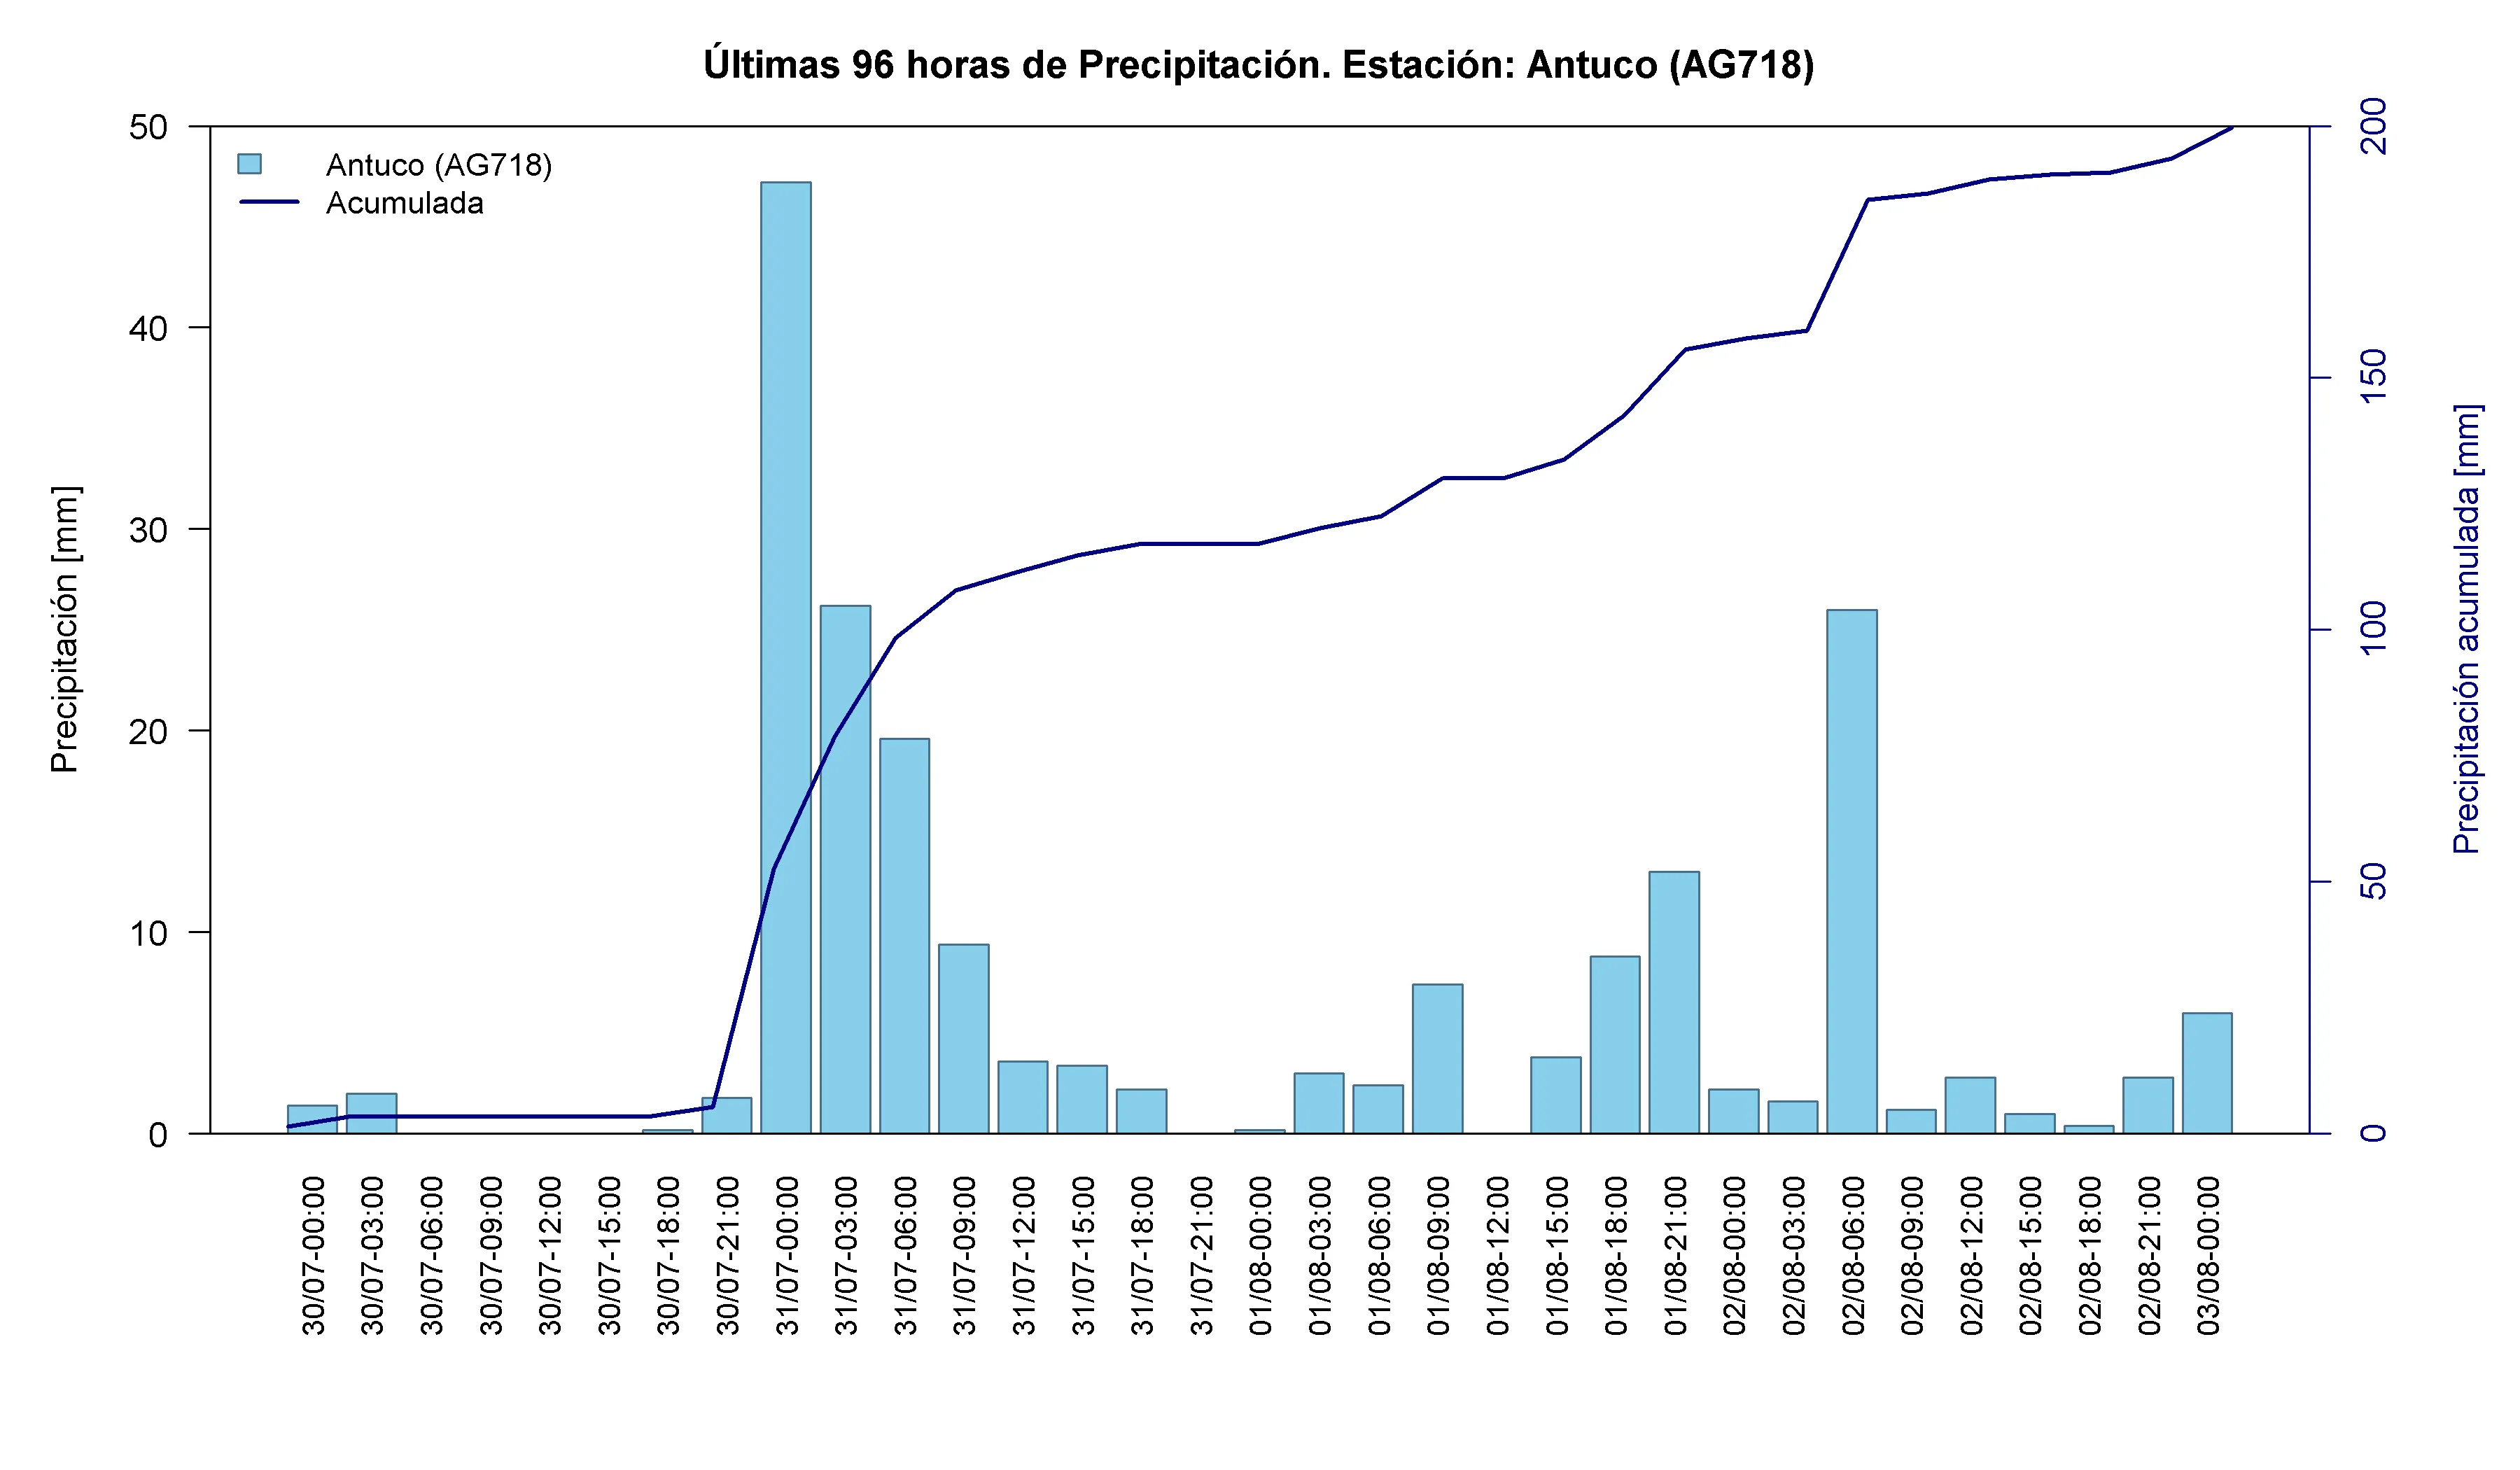
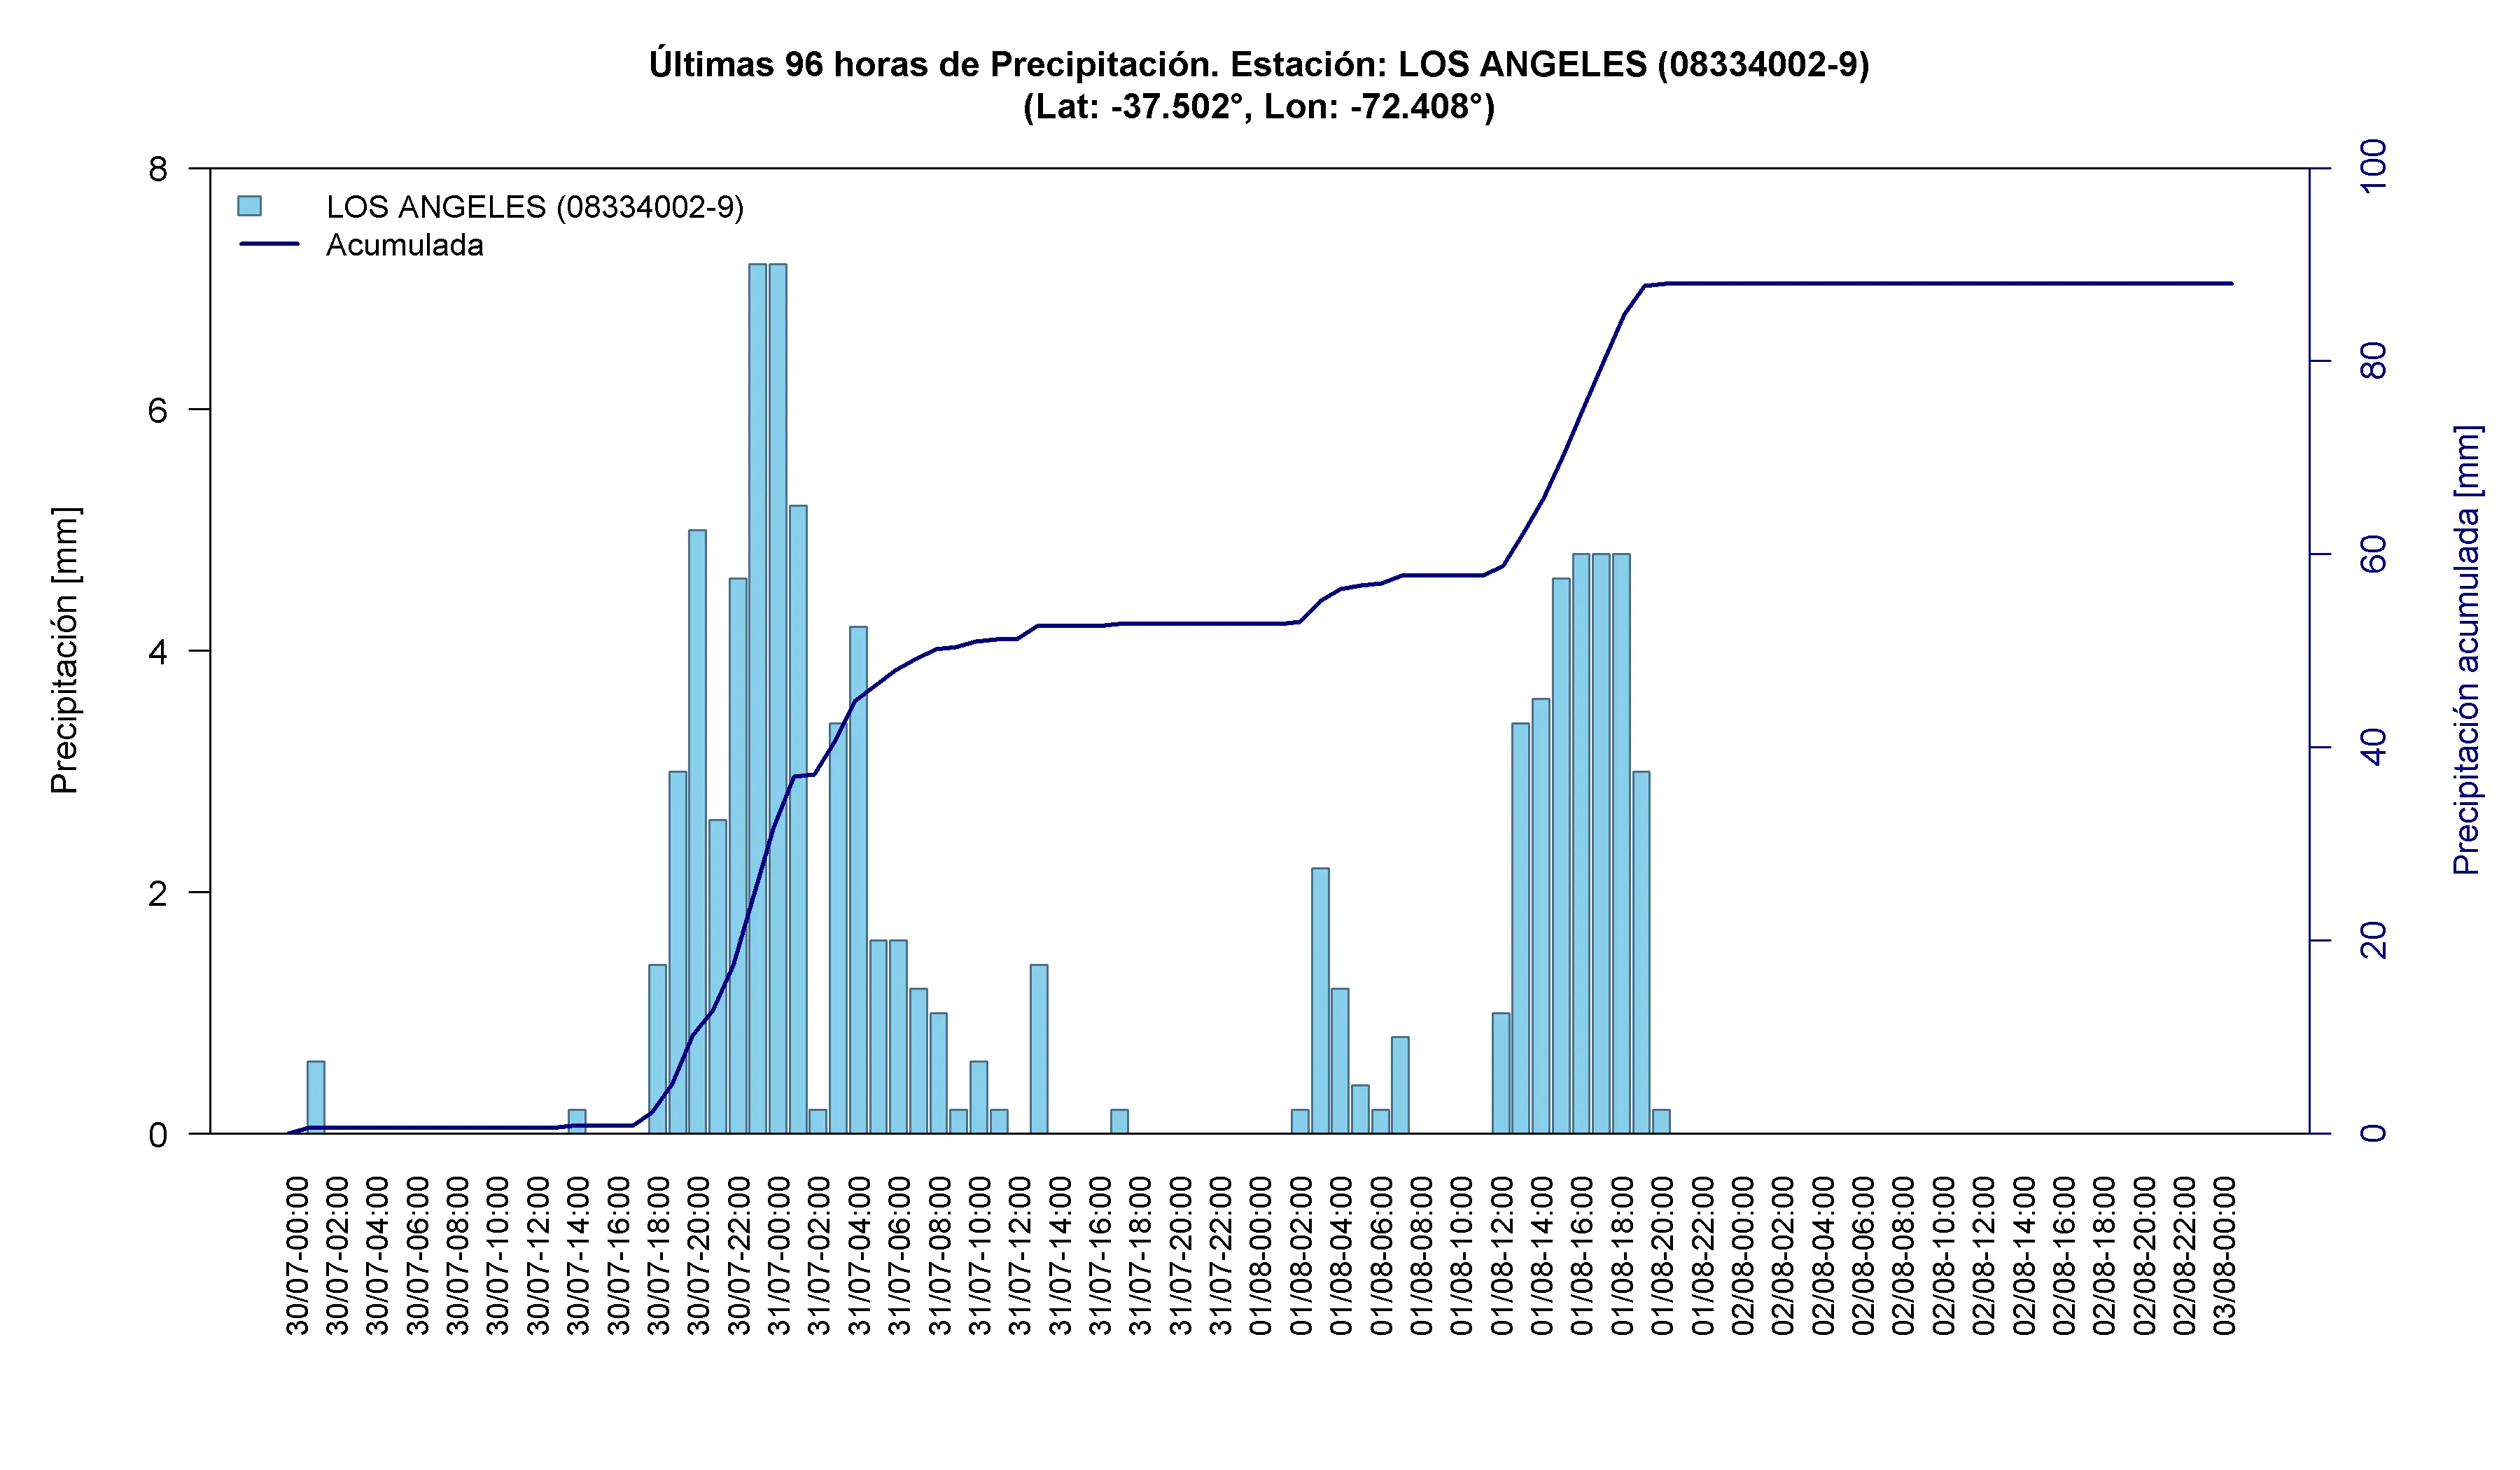
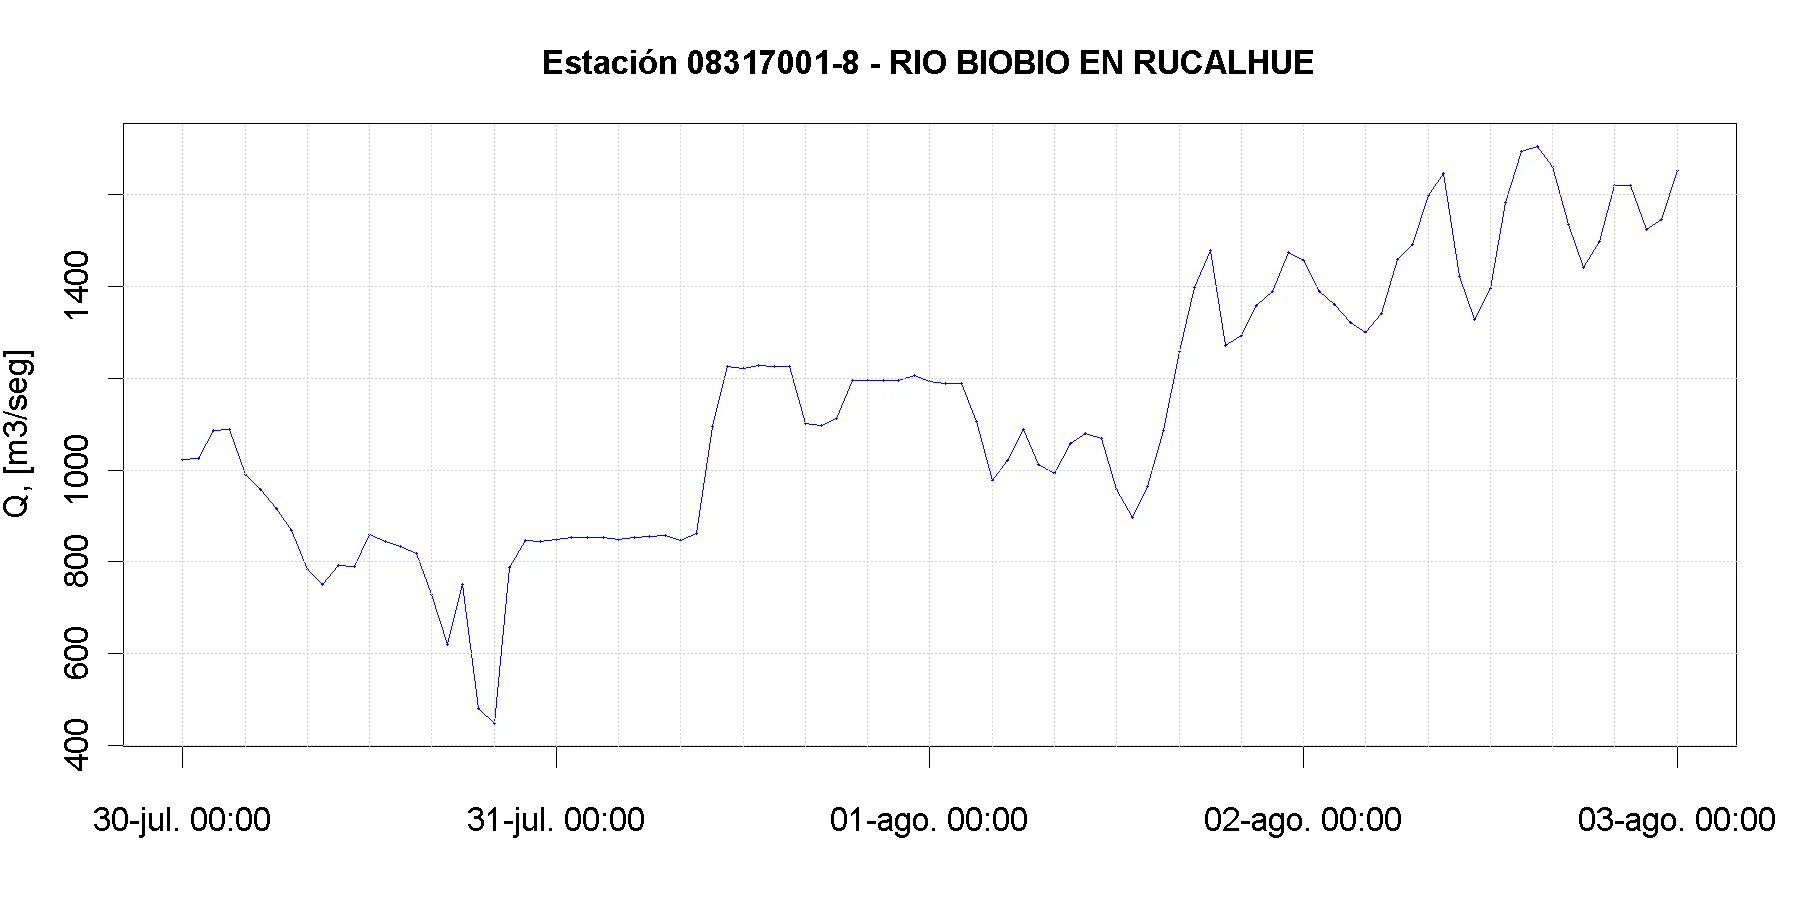
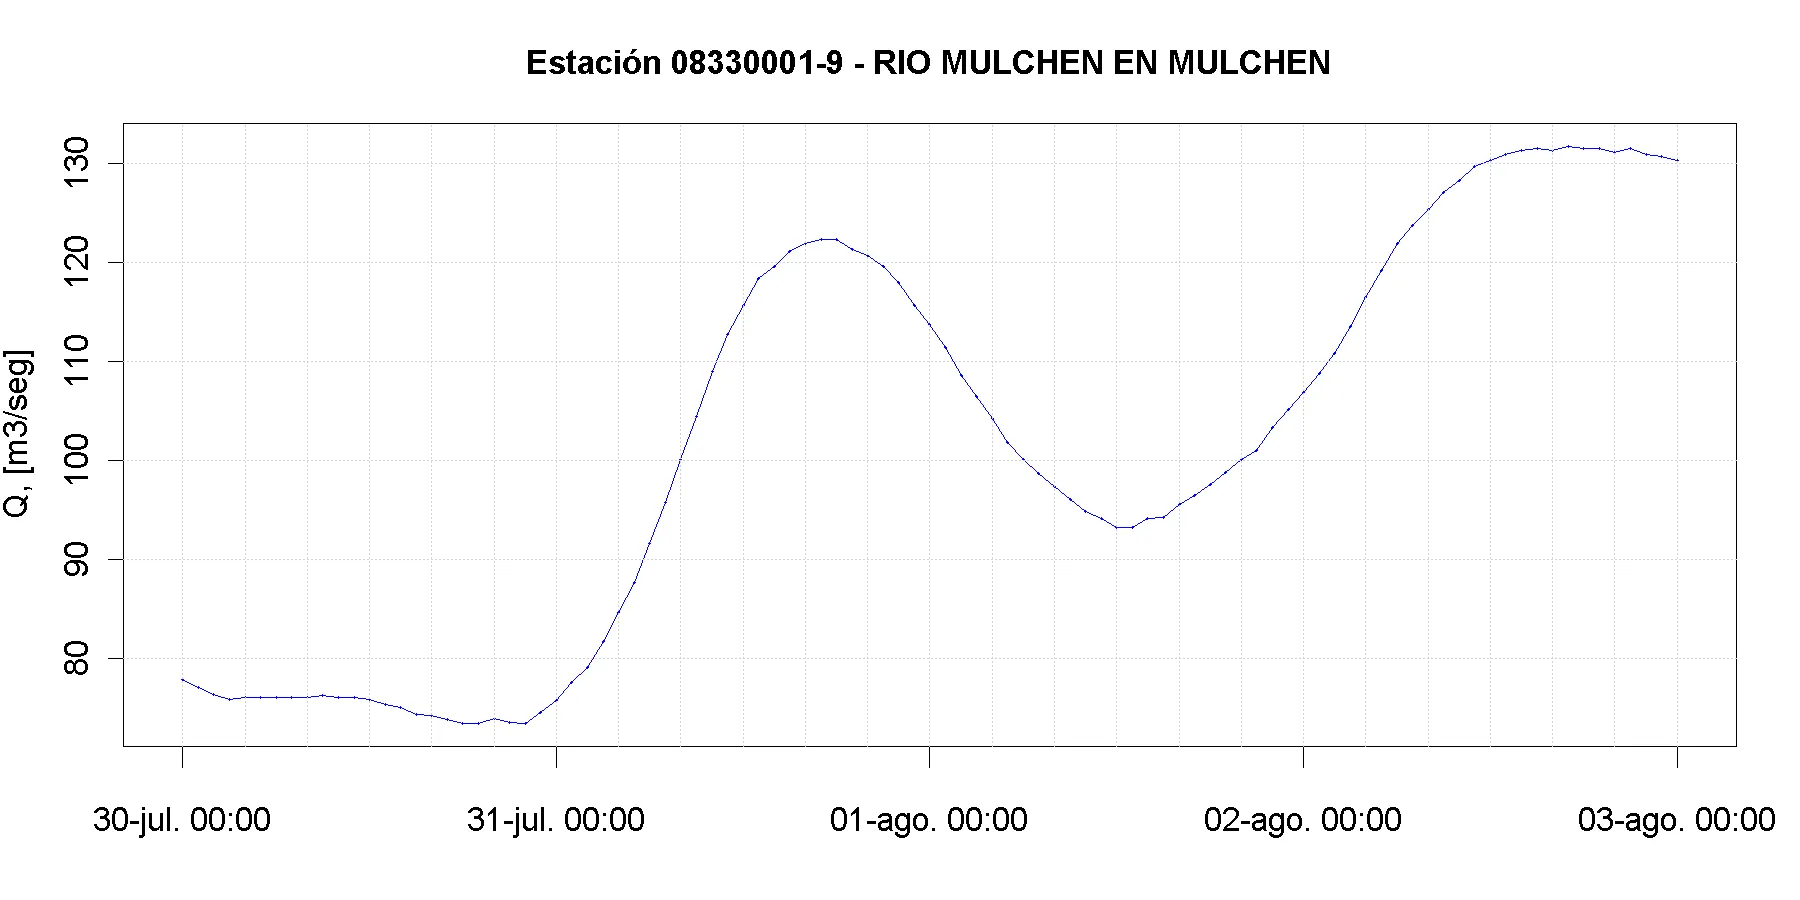
Biobío moved from Yellow to Red Alert on Saturday 1 August after DGA observations showed gradual and sustained increases in river and streamflow levels ⁶ . Local concerns included the Pichilo and Lía rivers in Arauco, the Andalién River in Concepción and the Paillihue stream in Los Ángeles ⁷ ⁸ .
Map 3. Location of the rain-gauge stations analyzed in Biobío during the frontal system. Source: own elaboration based on VisMet data.
Table 3. Accumulated precipitation at rain-gauge stations in Biobío between 30 July and 2 August 2026.
Time series: highest accumulated precipitation stations

Nearby DGA stations and streamflow
Ñuble Region
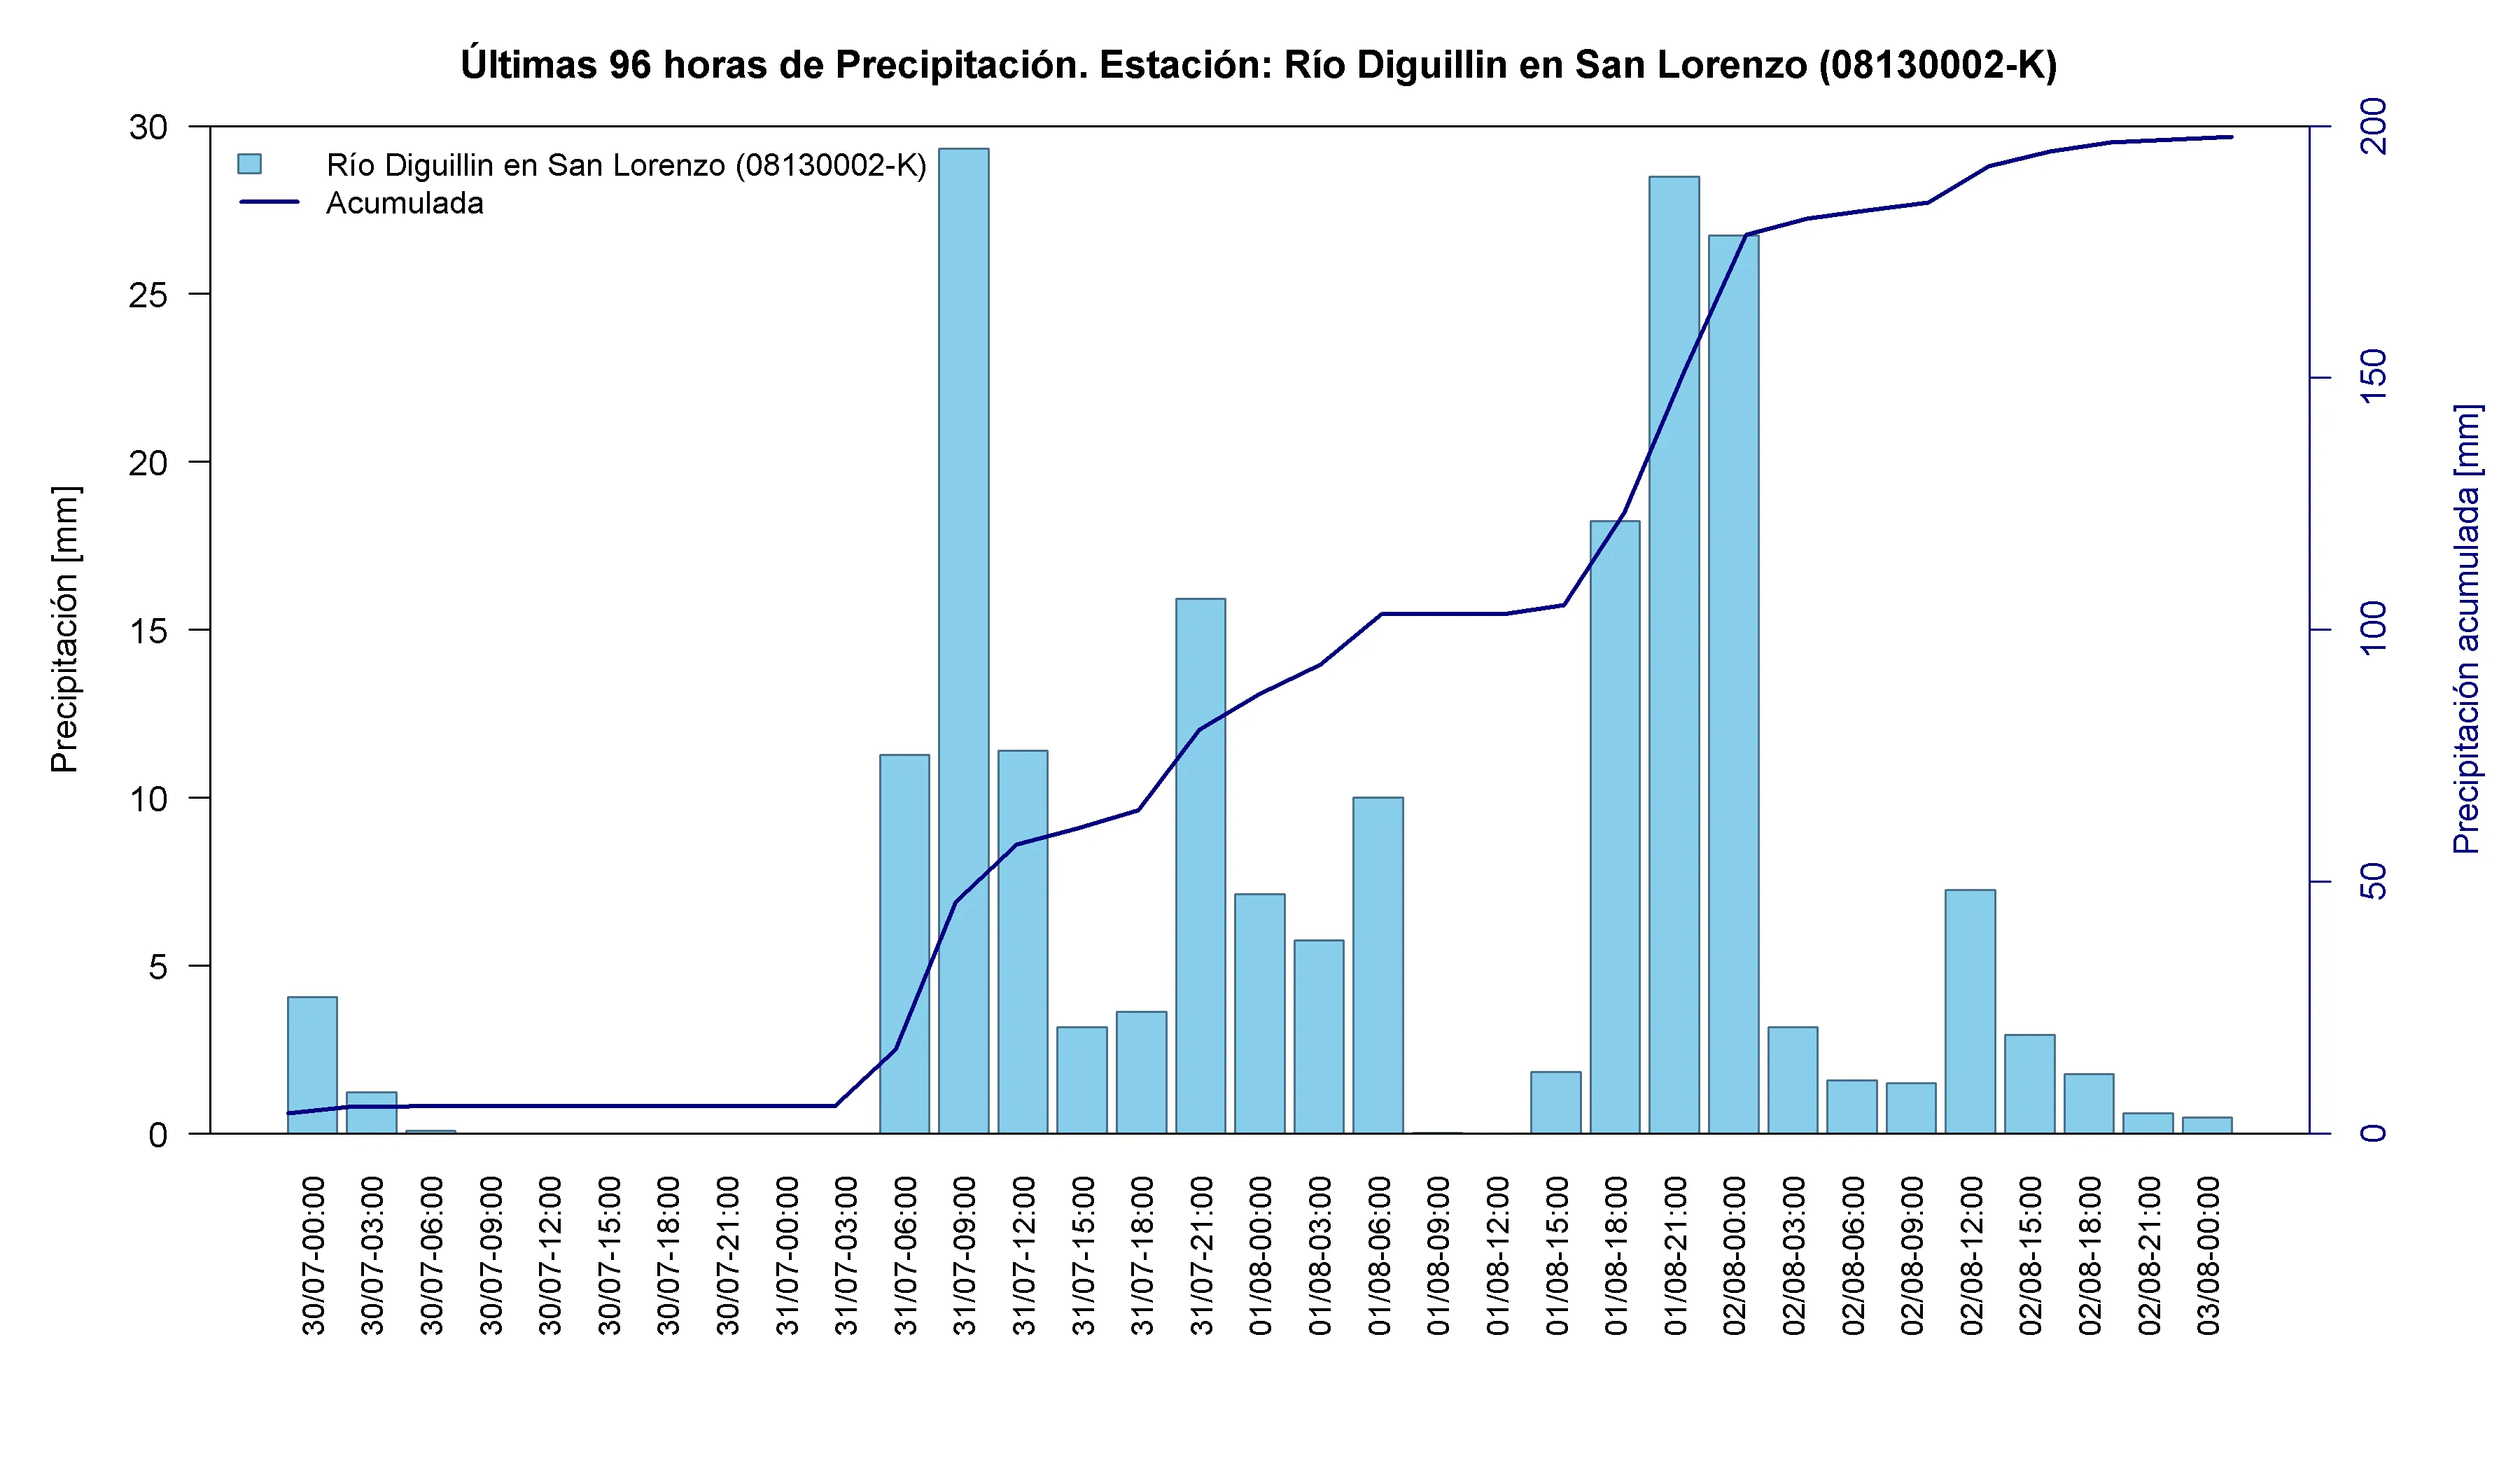
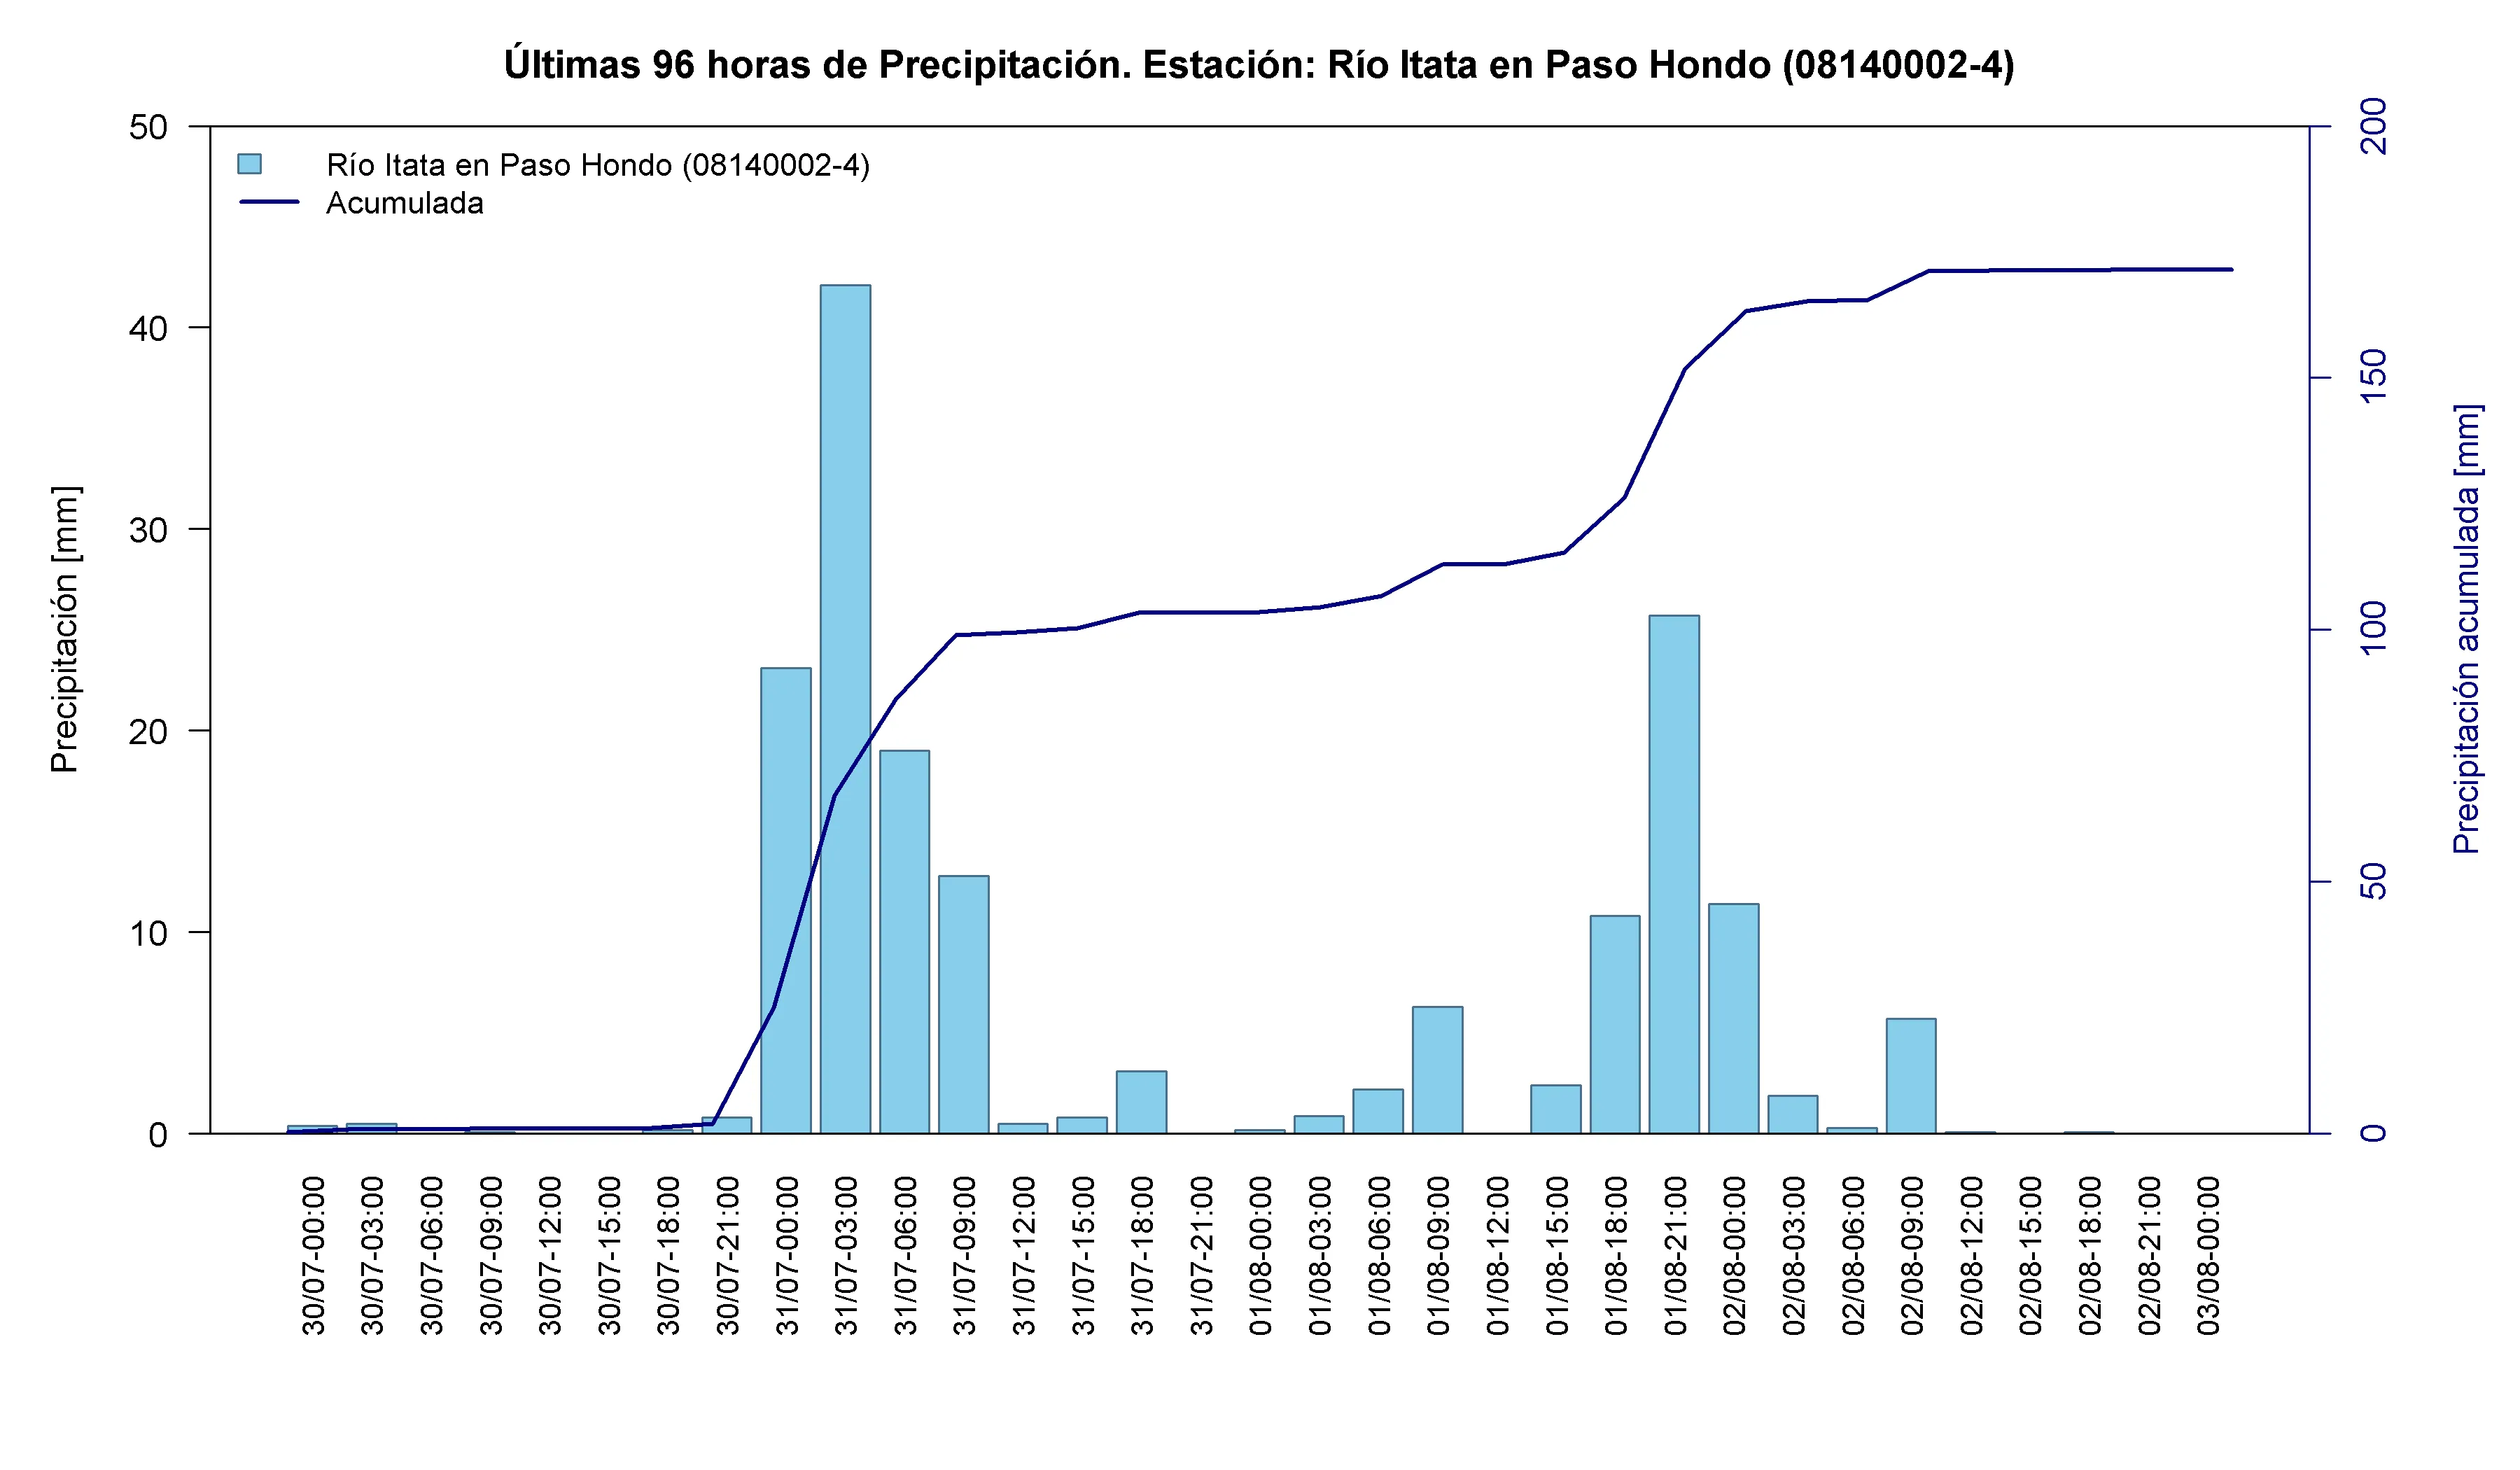
Ñuble contributed the highest number of affected/displaced people in the national balance, with 172 ⁵ . Preventive evacuations were concentrated in Coelemu and Ránquil, while road disruption affected multiple communes in Itata and Punilla ¹⁰ ¹¹ ¹² .
Map 4. Location of the rain-gauge stations analyzed in Ñuble during the frontal system. Source: own elaboration based on VisMet data.
Table 4. Accumulated precipitation at rain-gauge stations in Ñuble between 30 July and 2 August 2026.
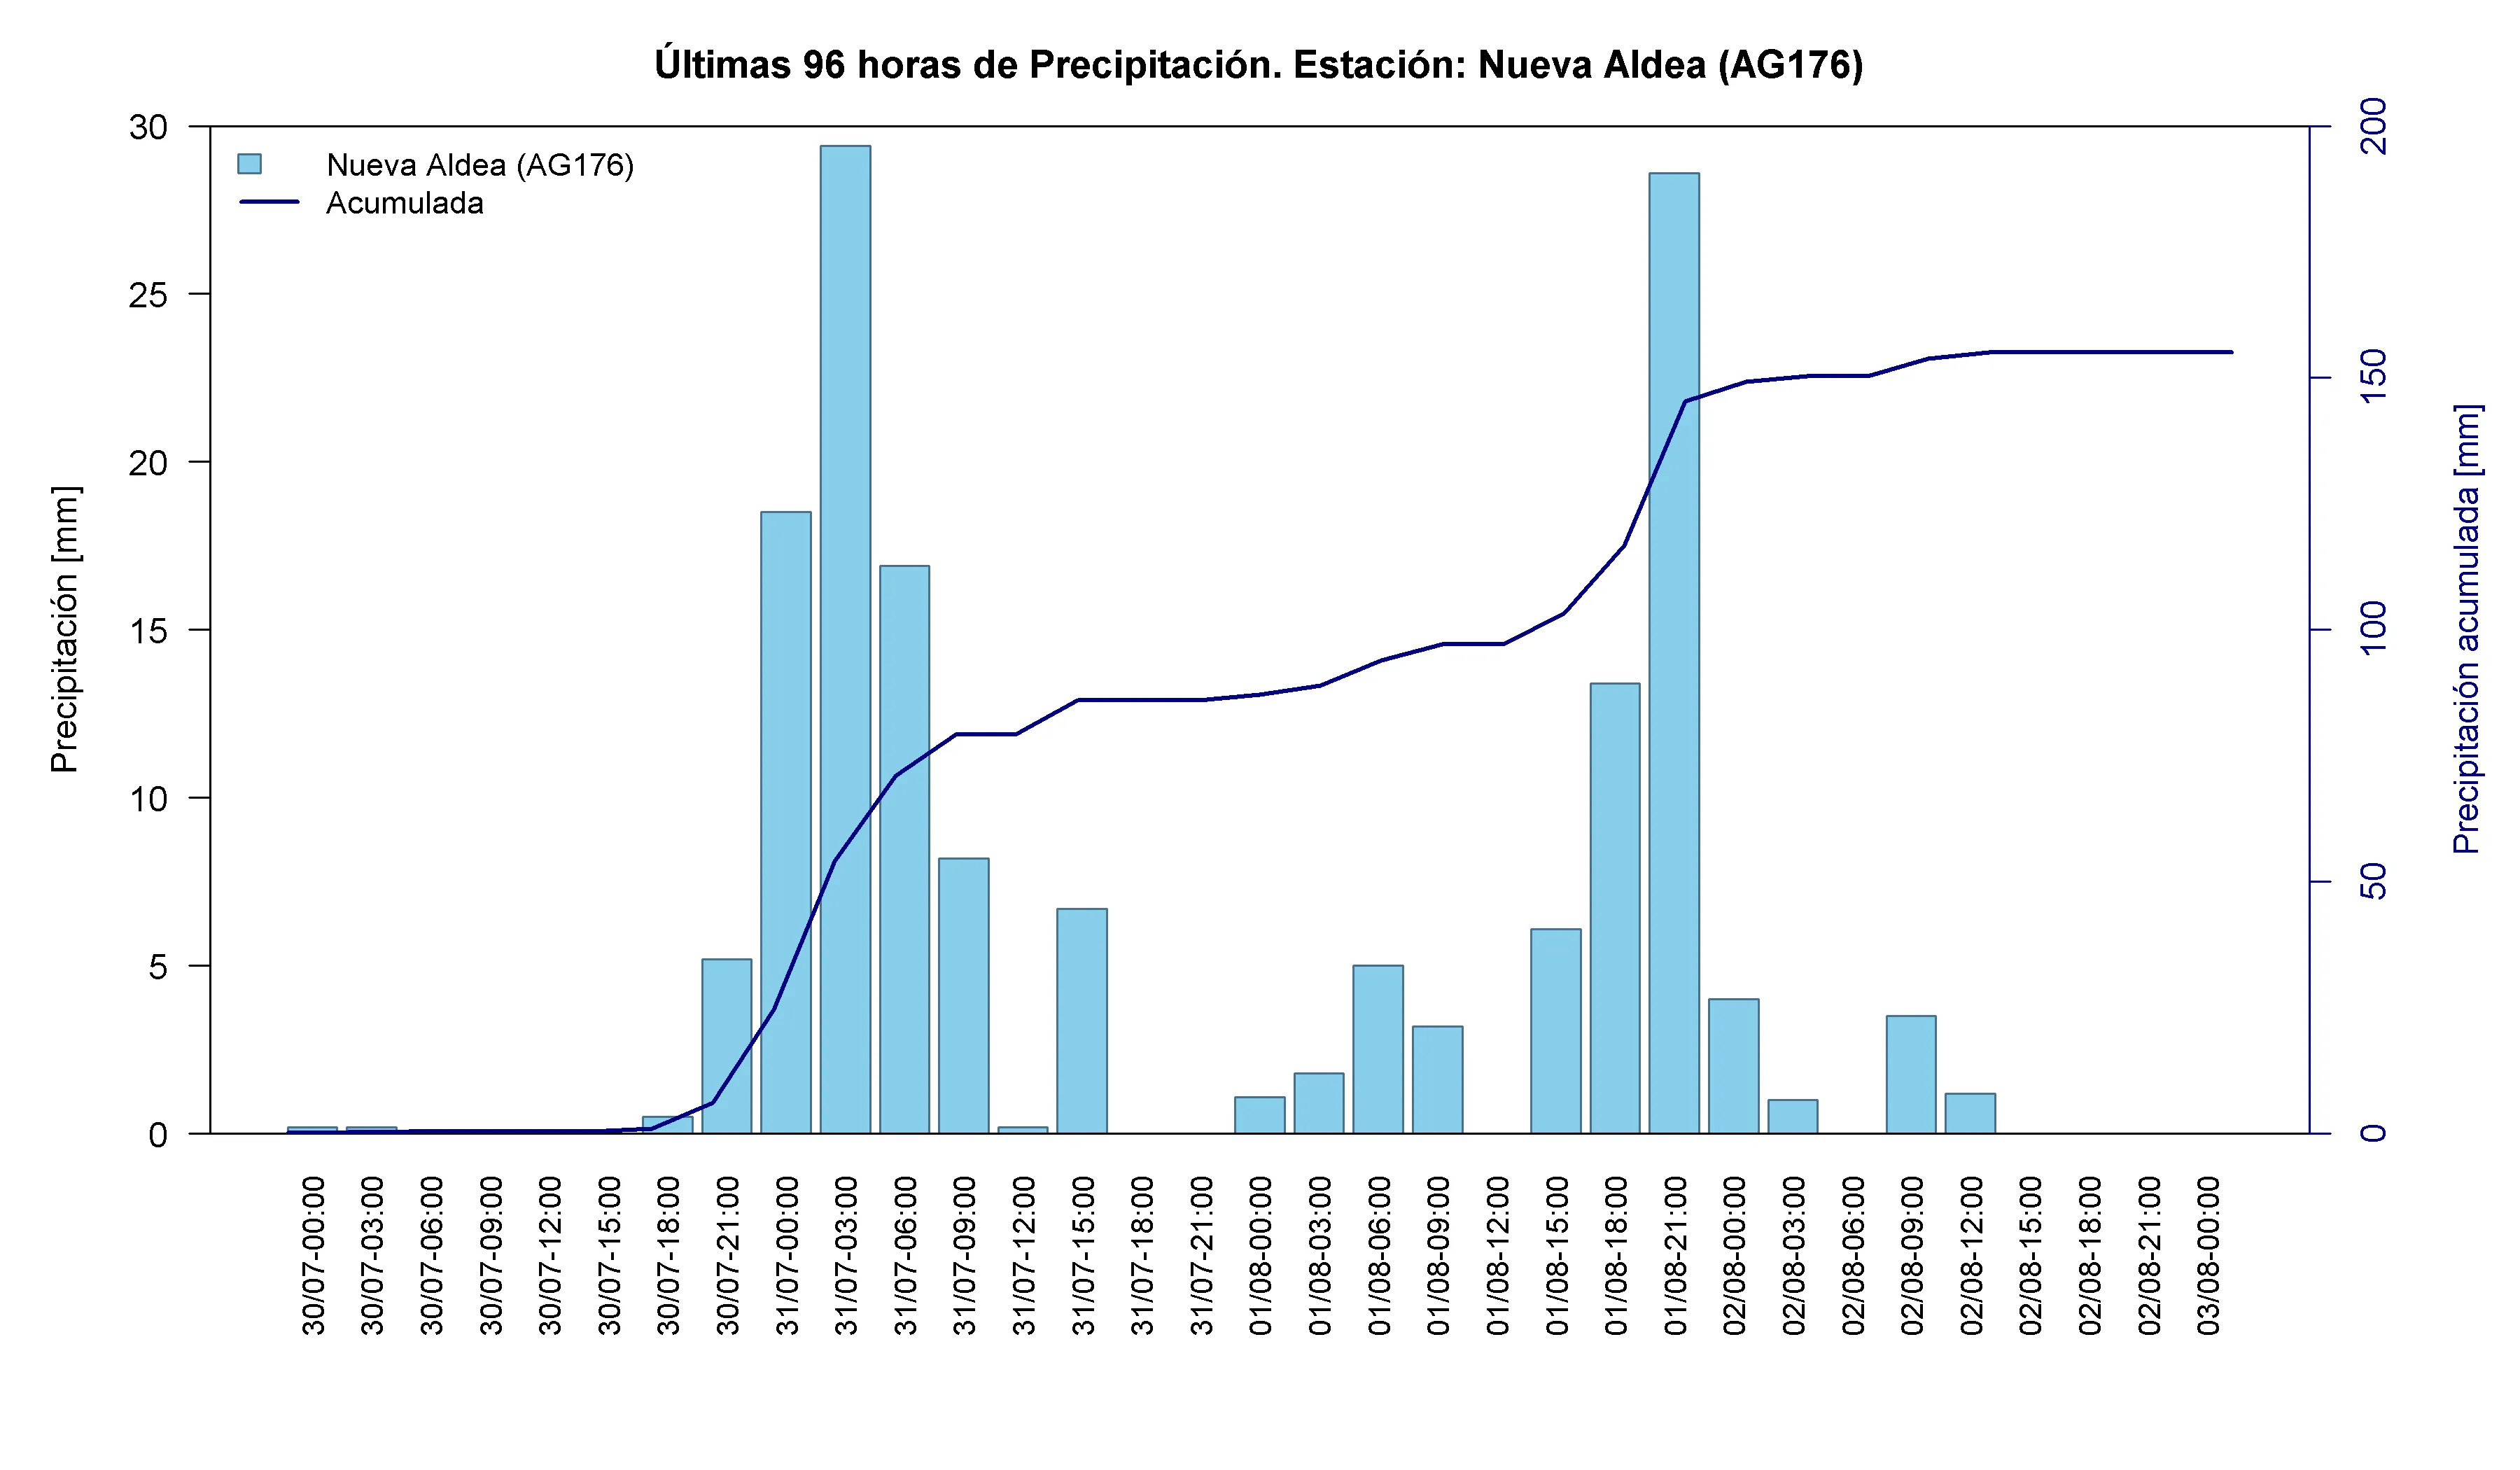
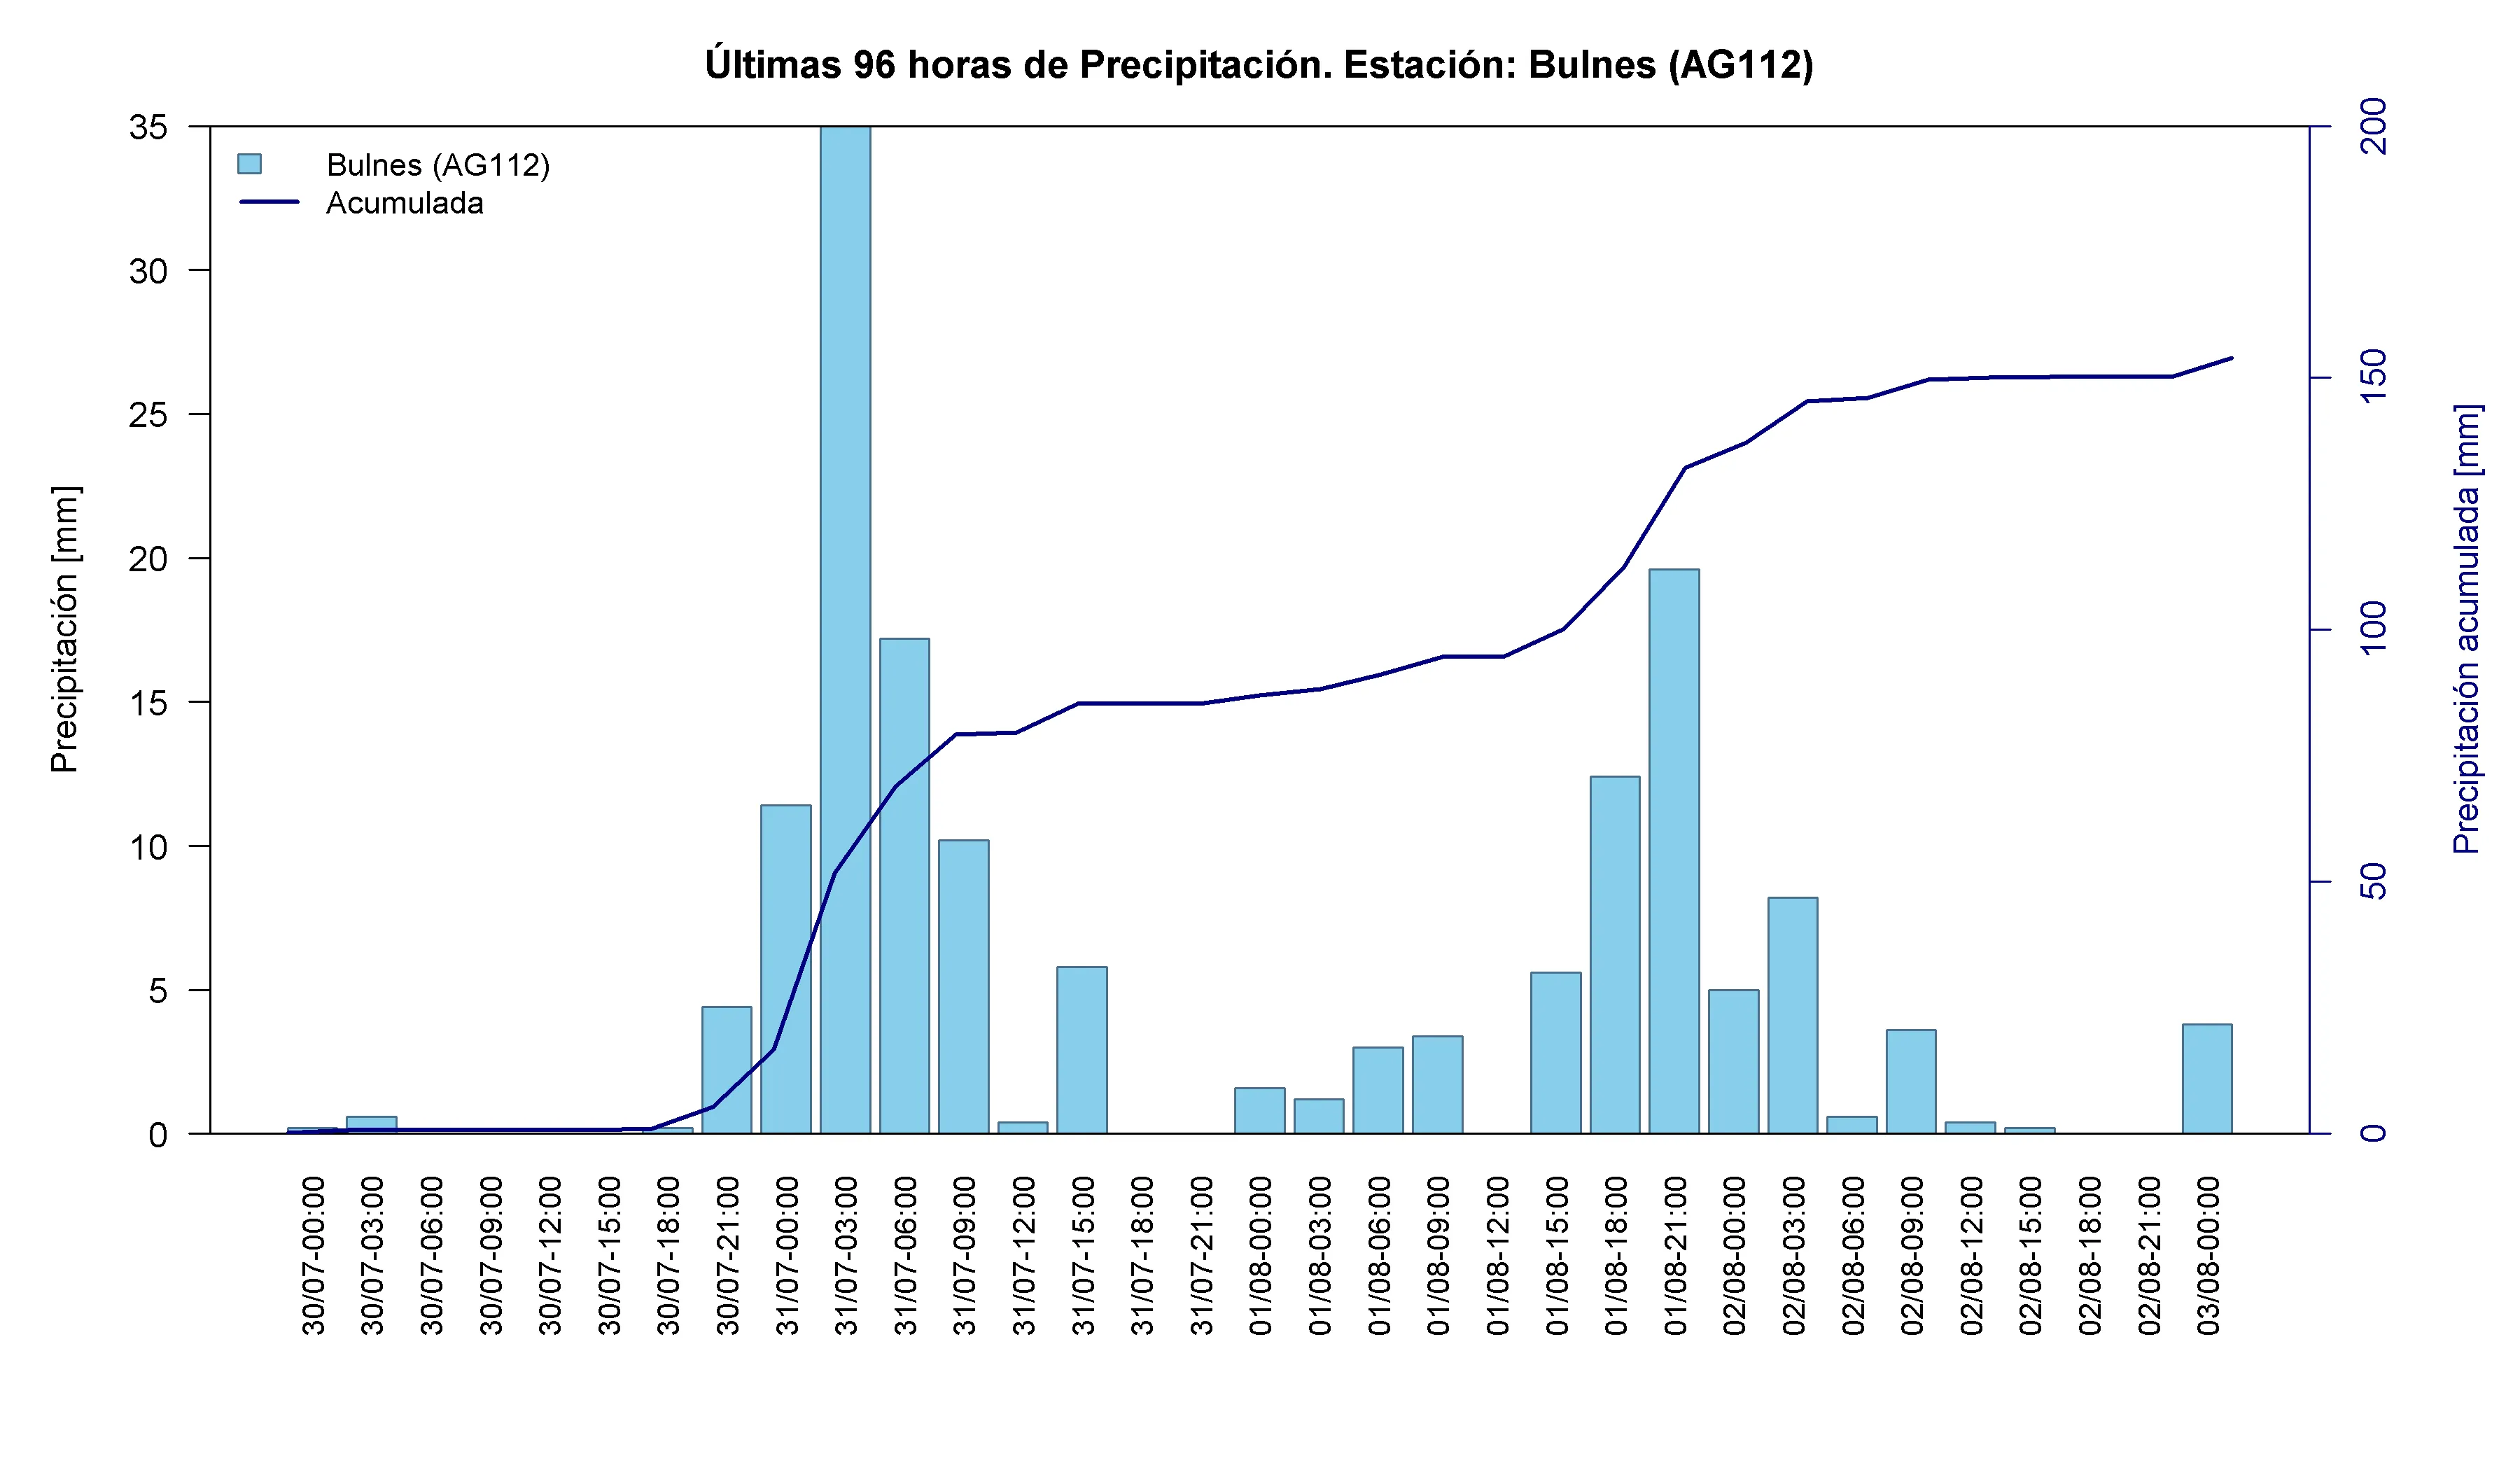
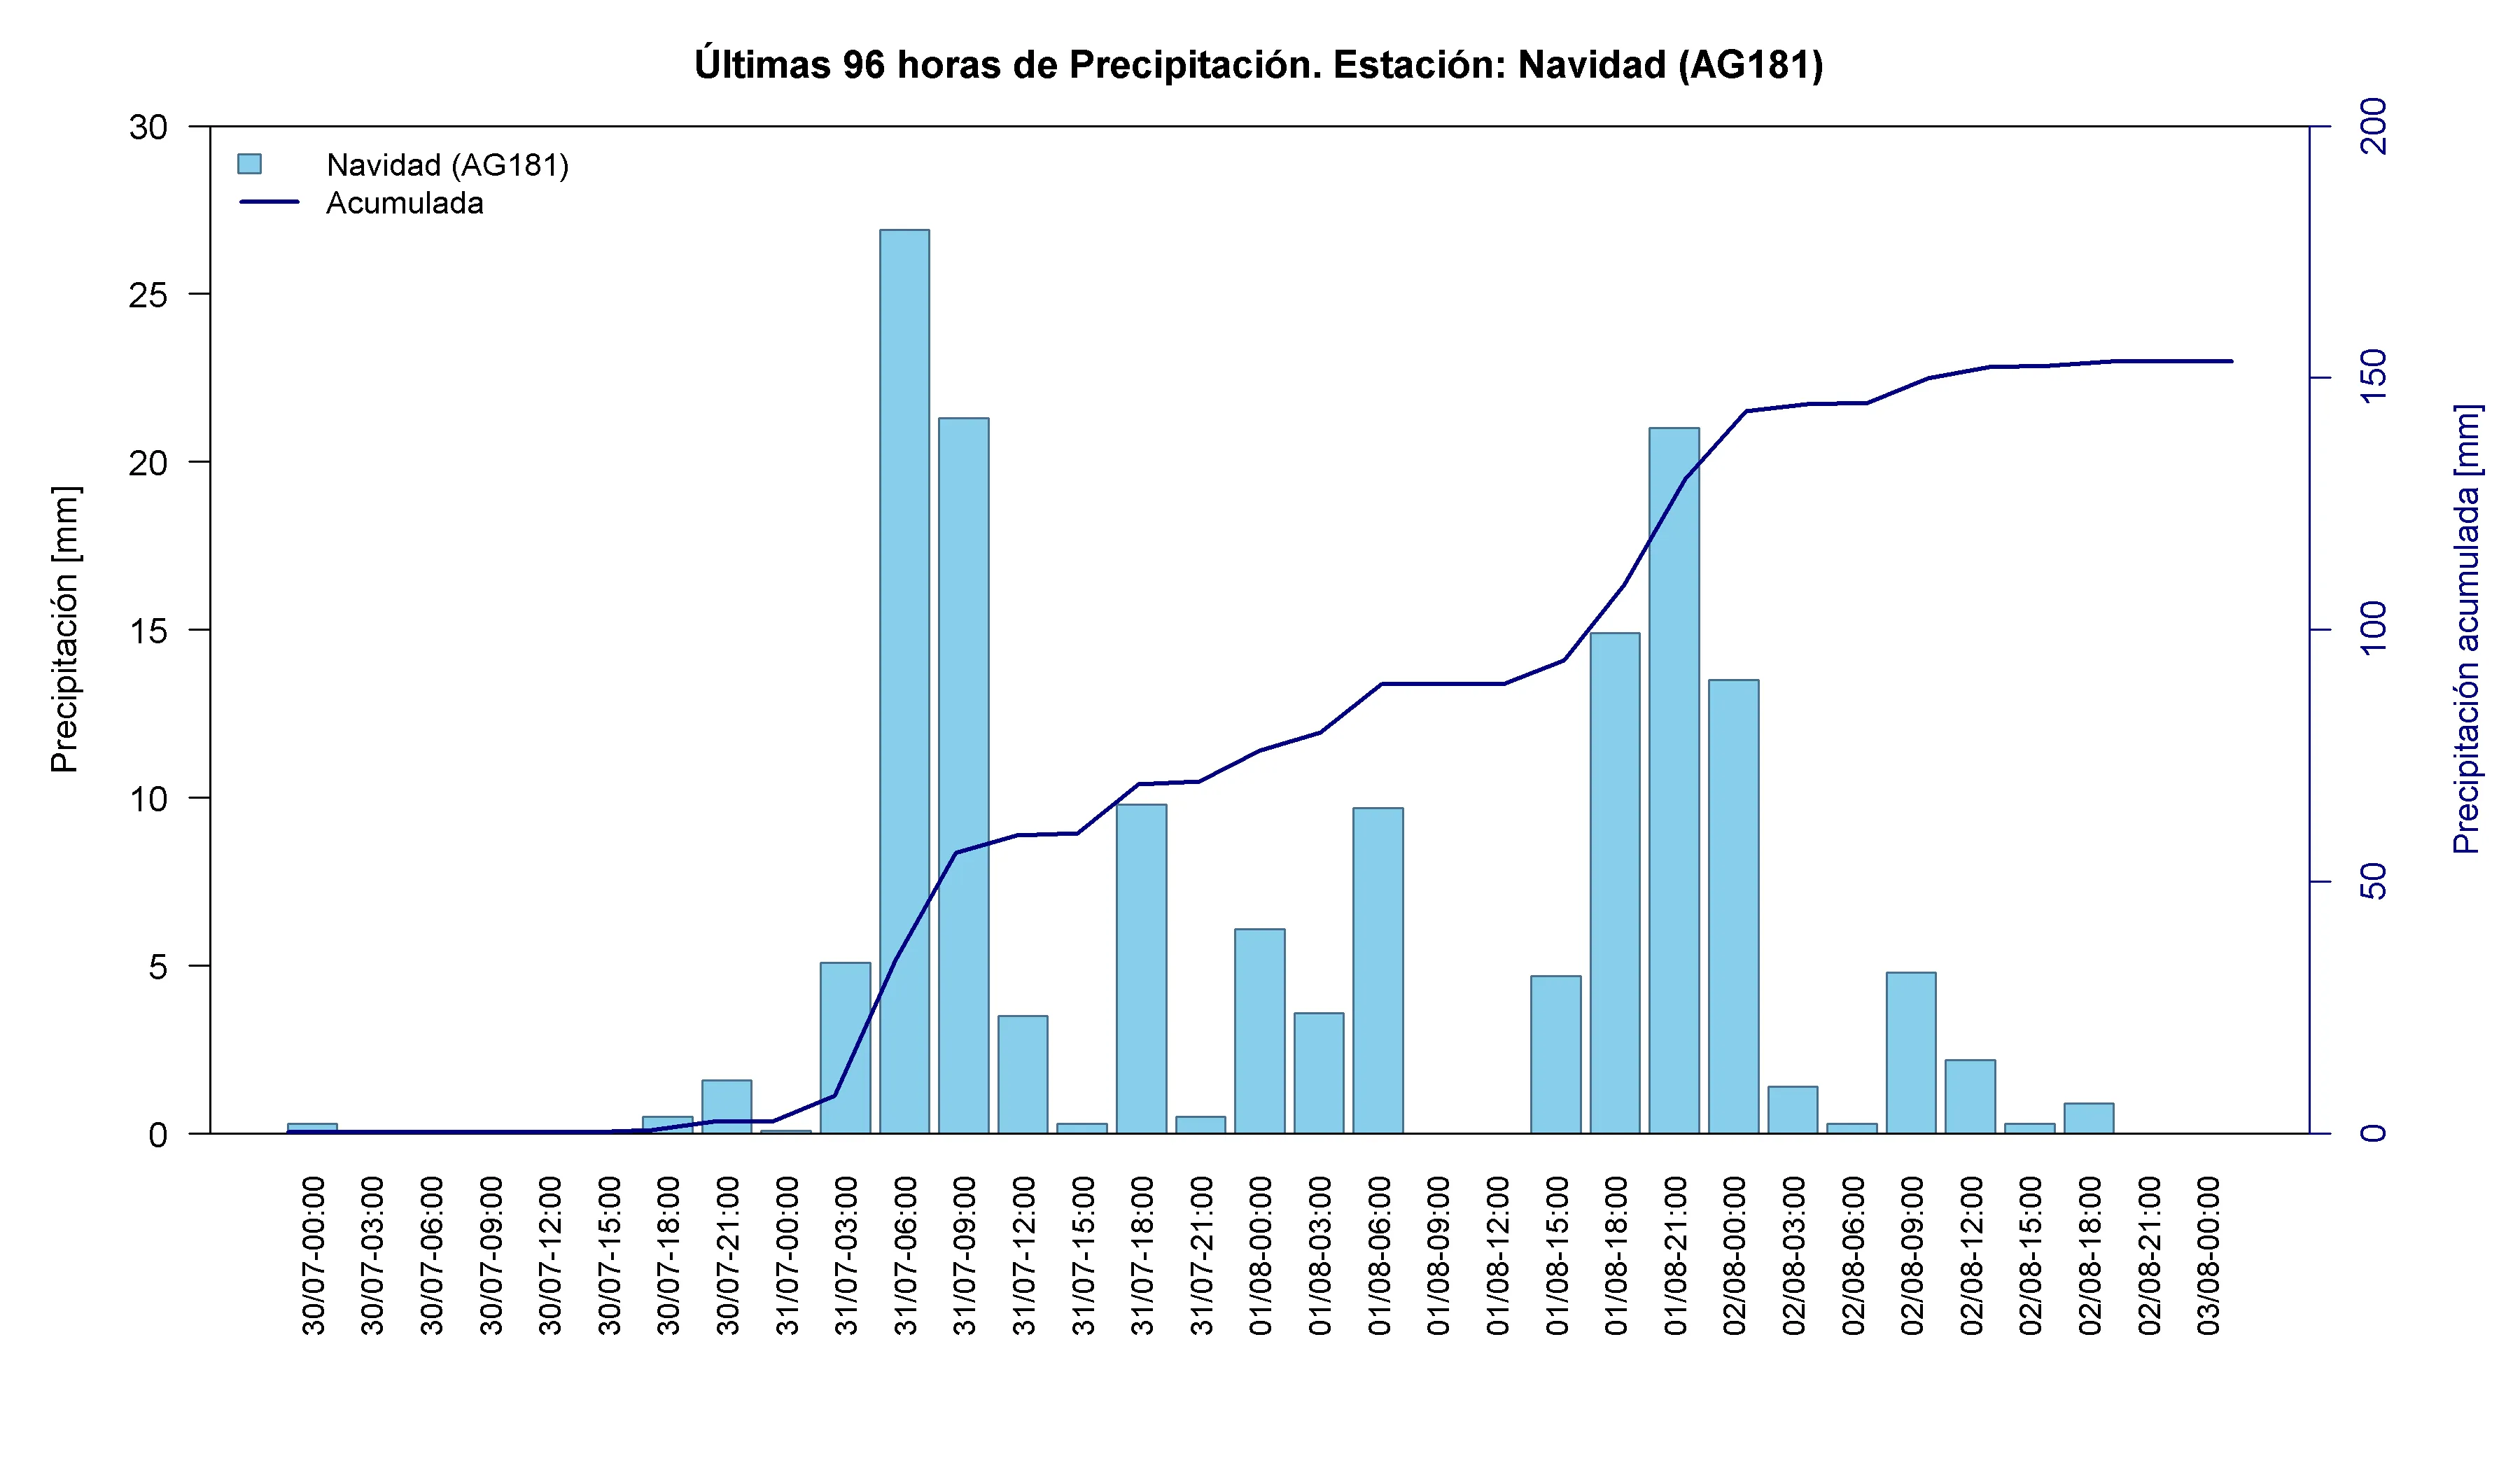
Time series: highest accumulated precipitation stations
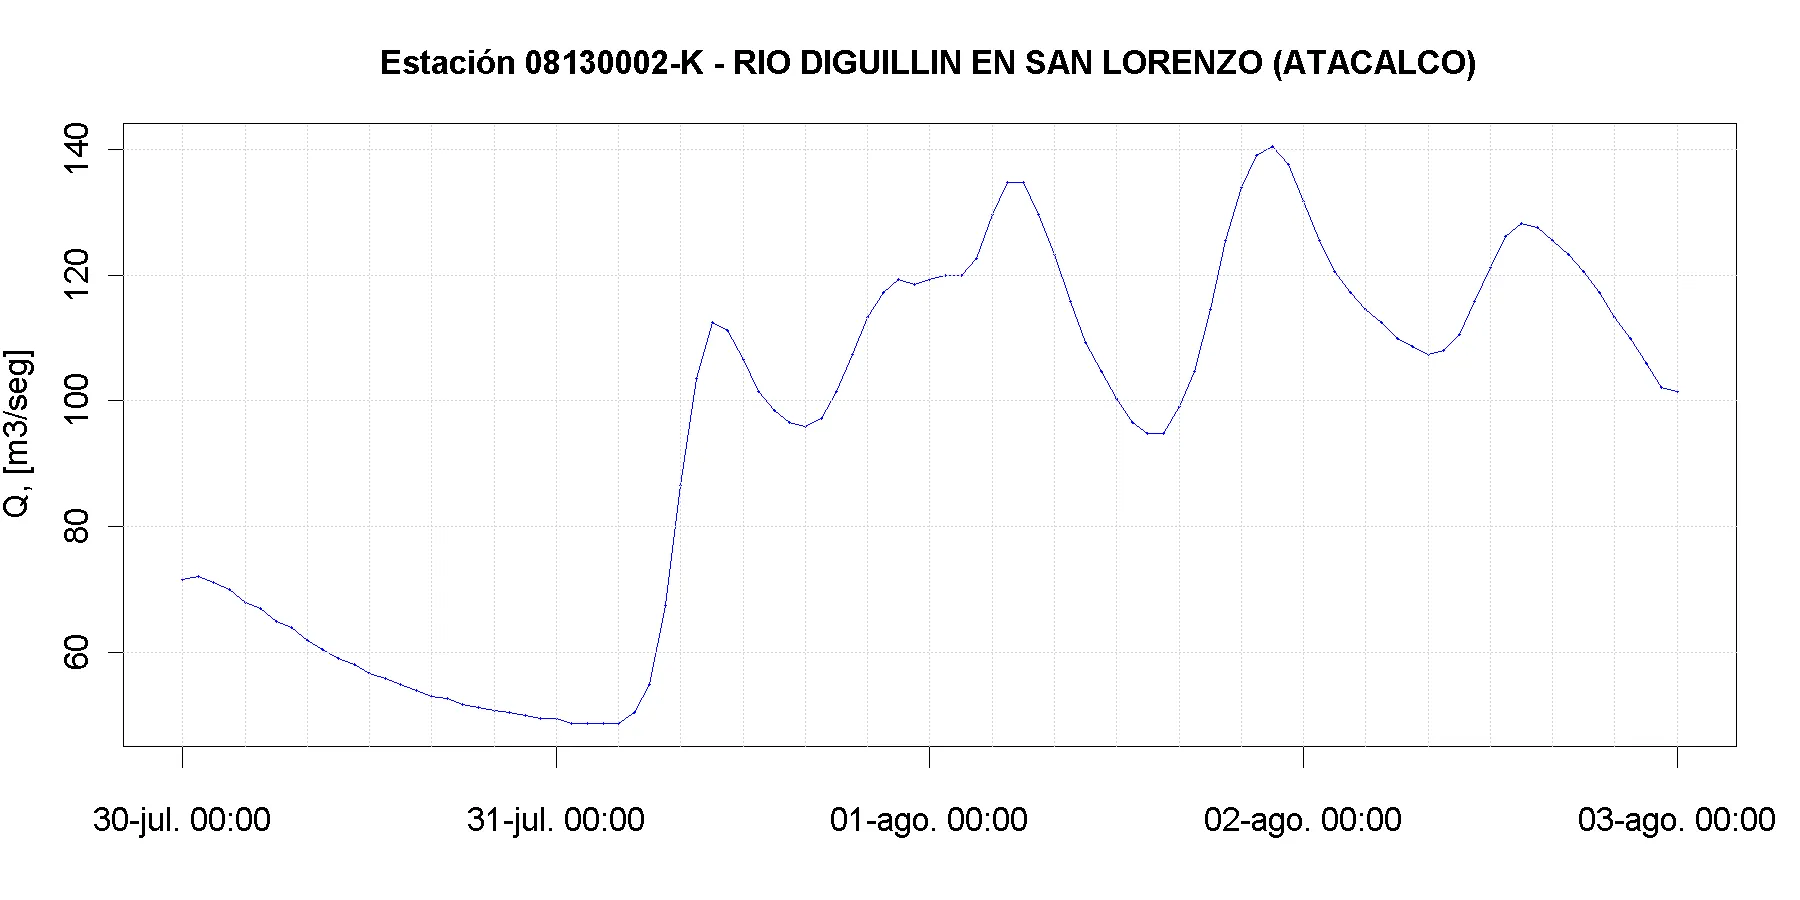
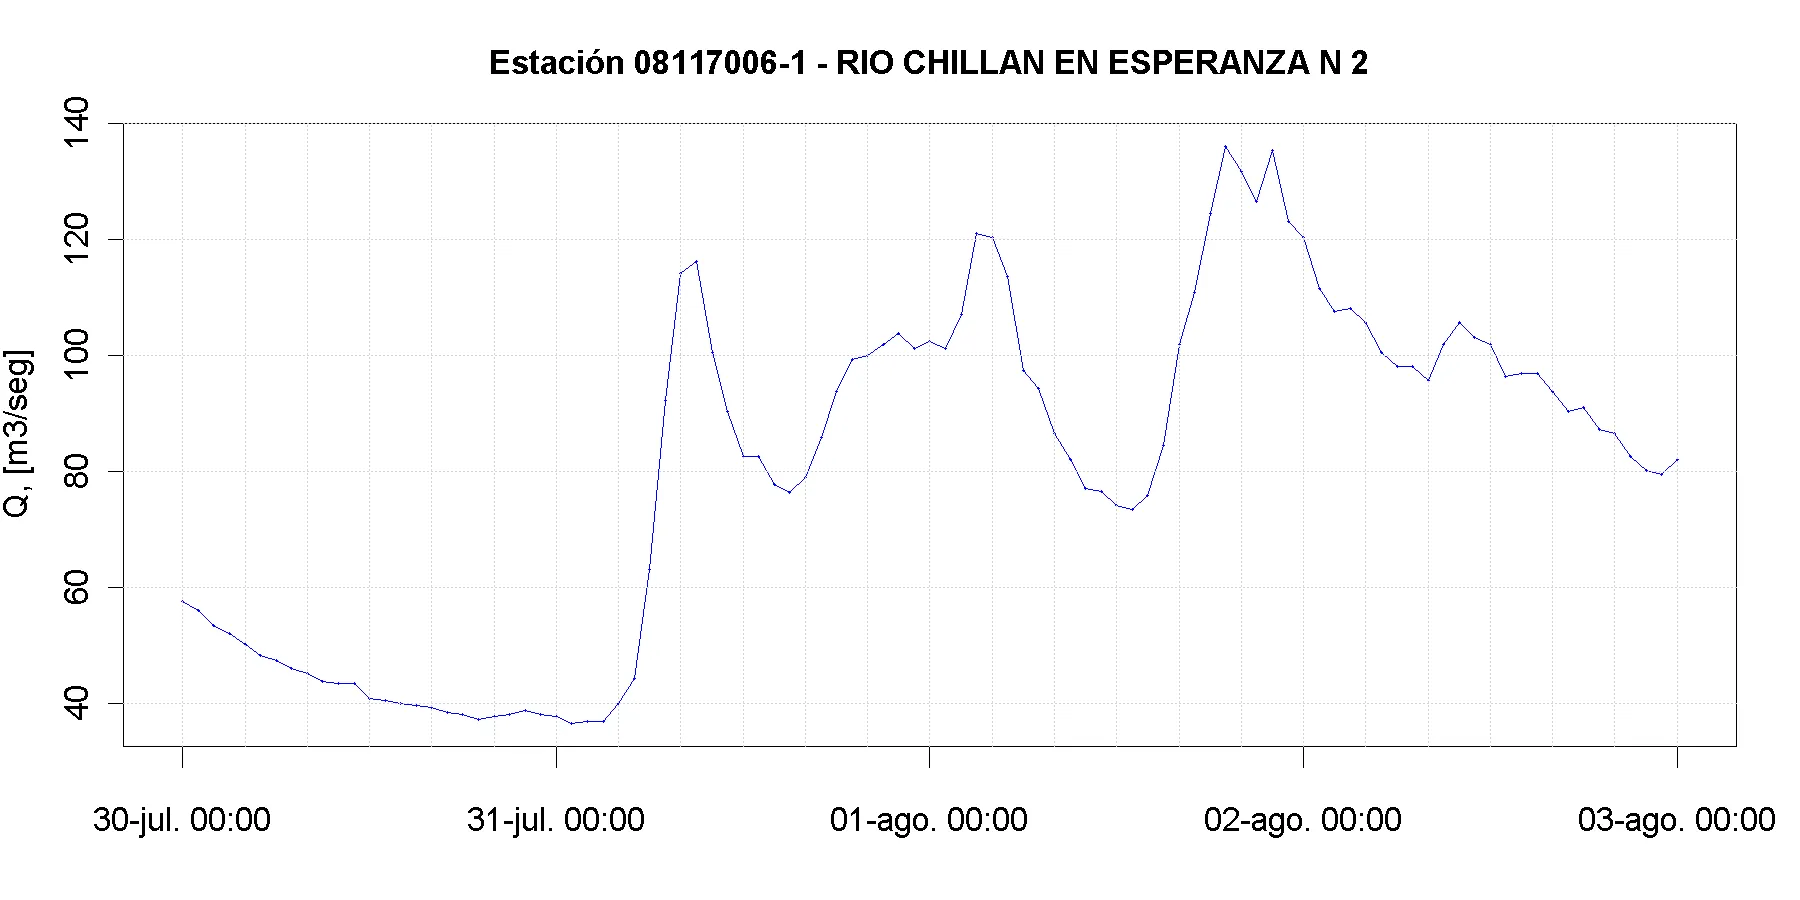
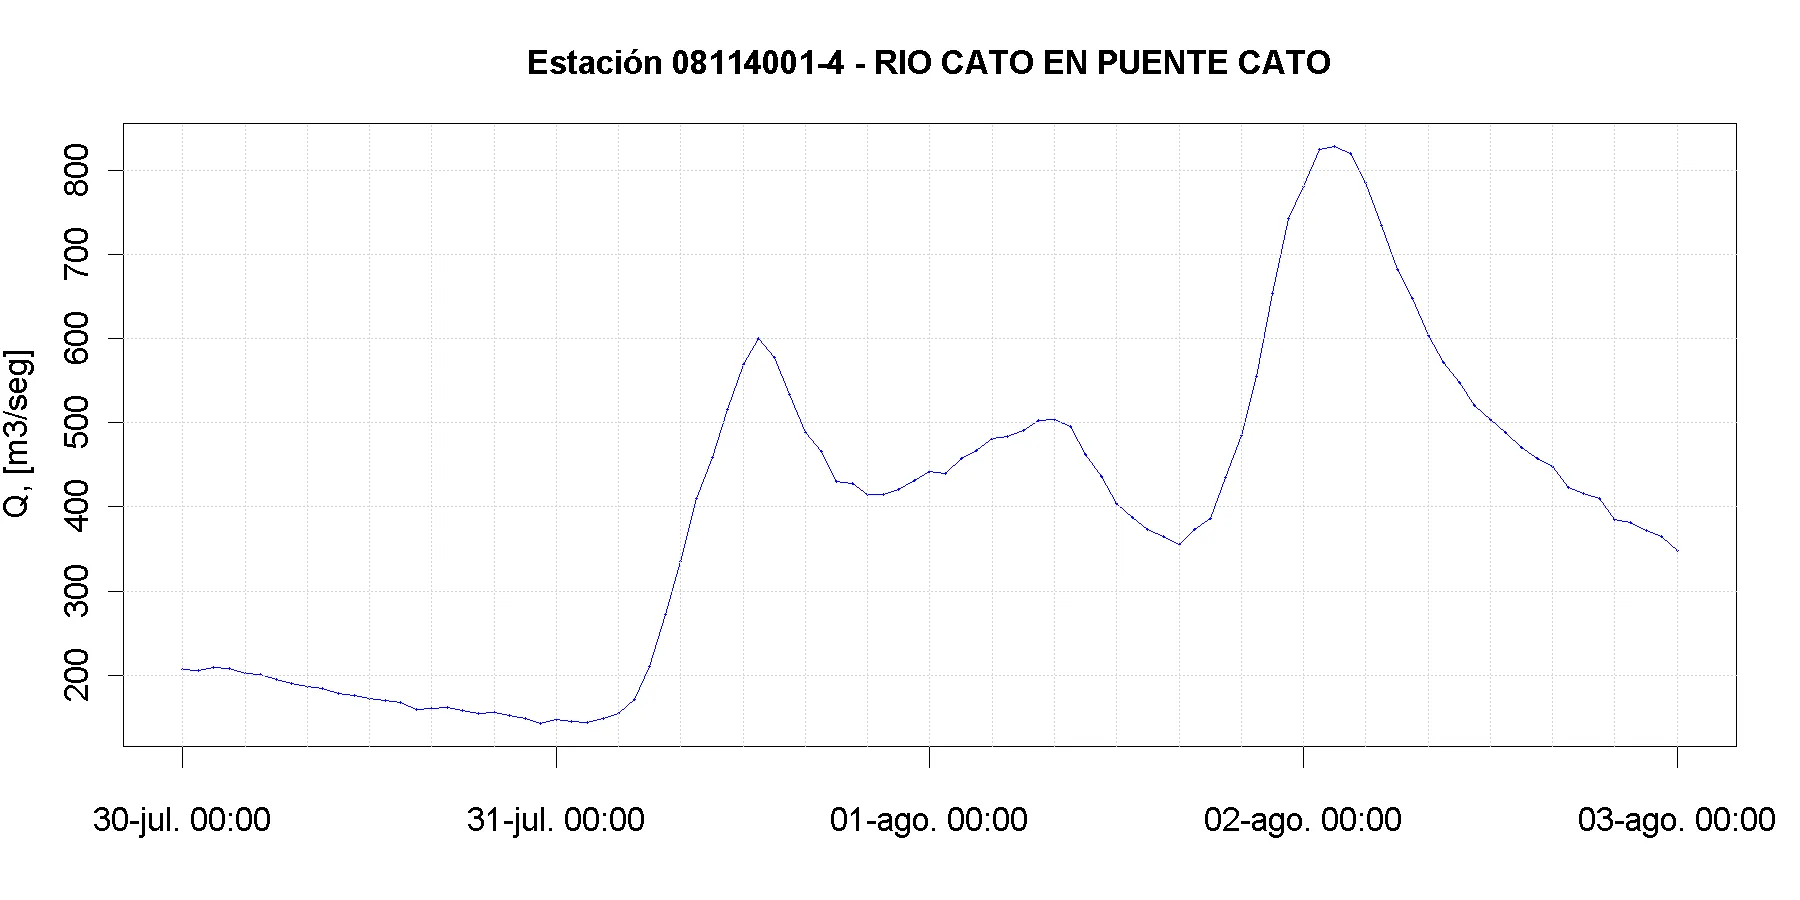
Nearby DGA stations and streamflow
Maule Region
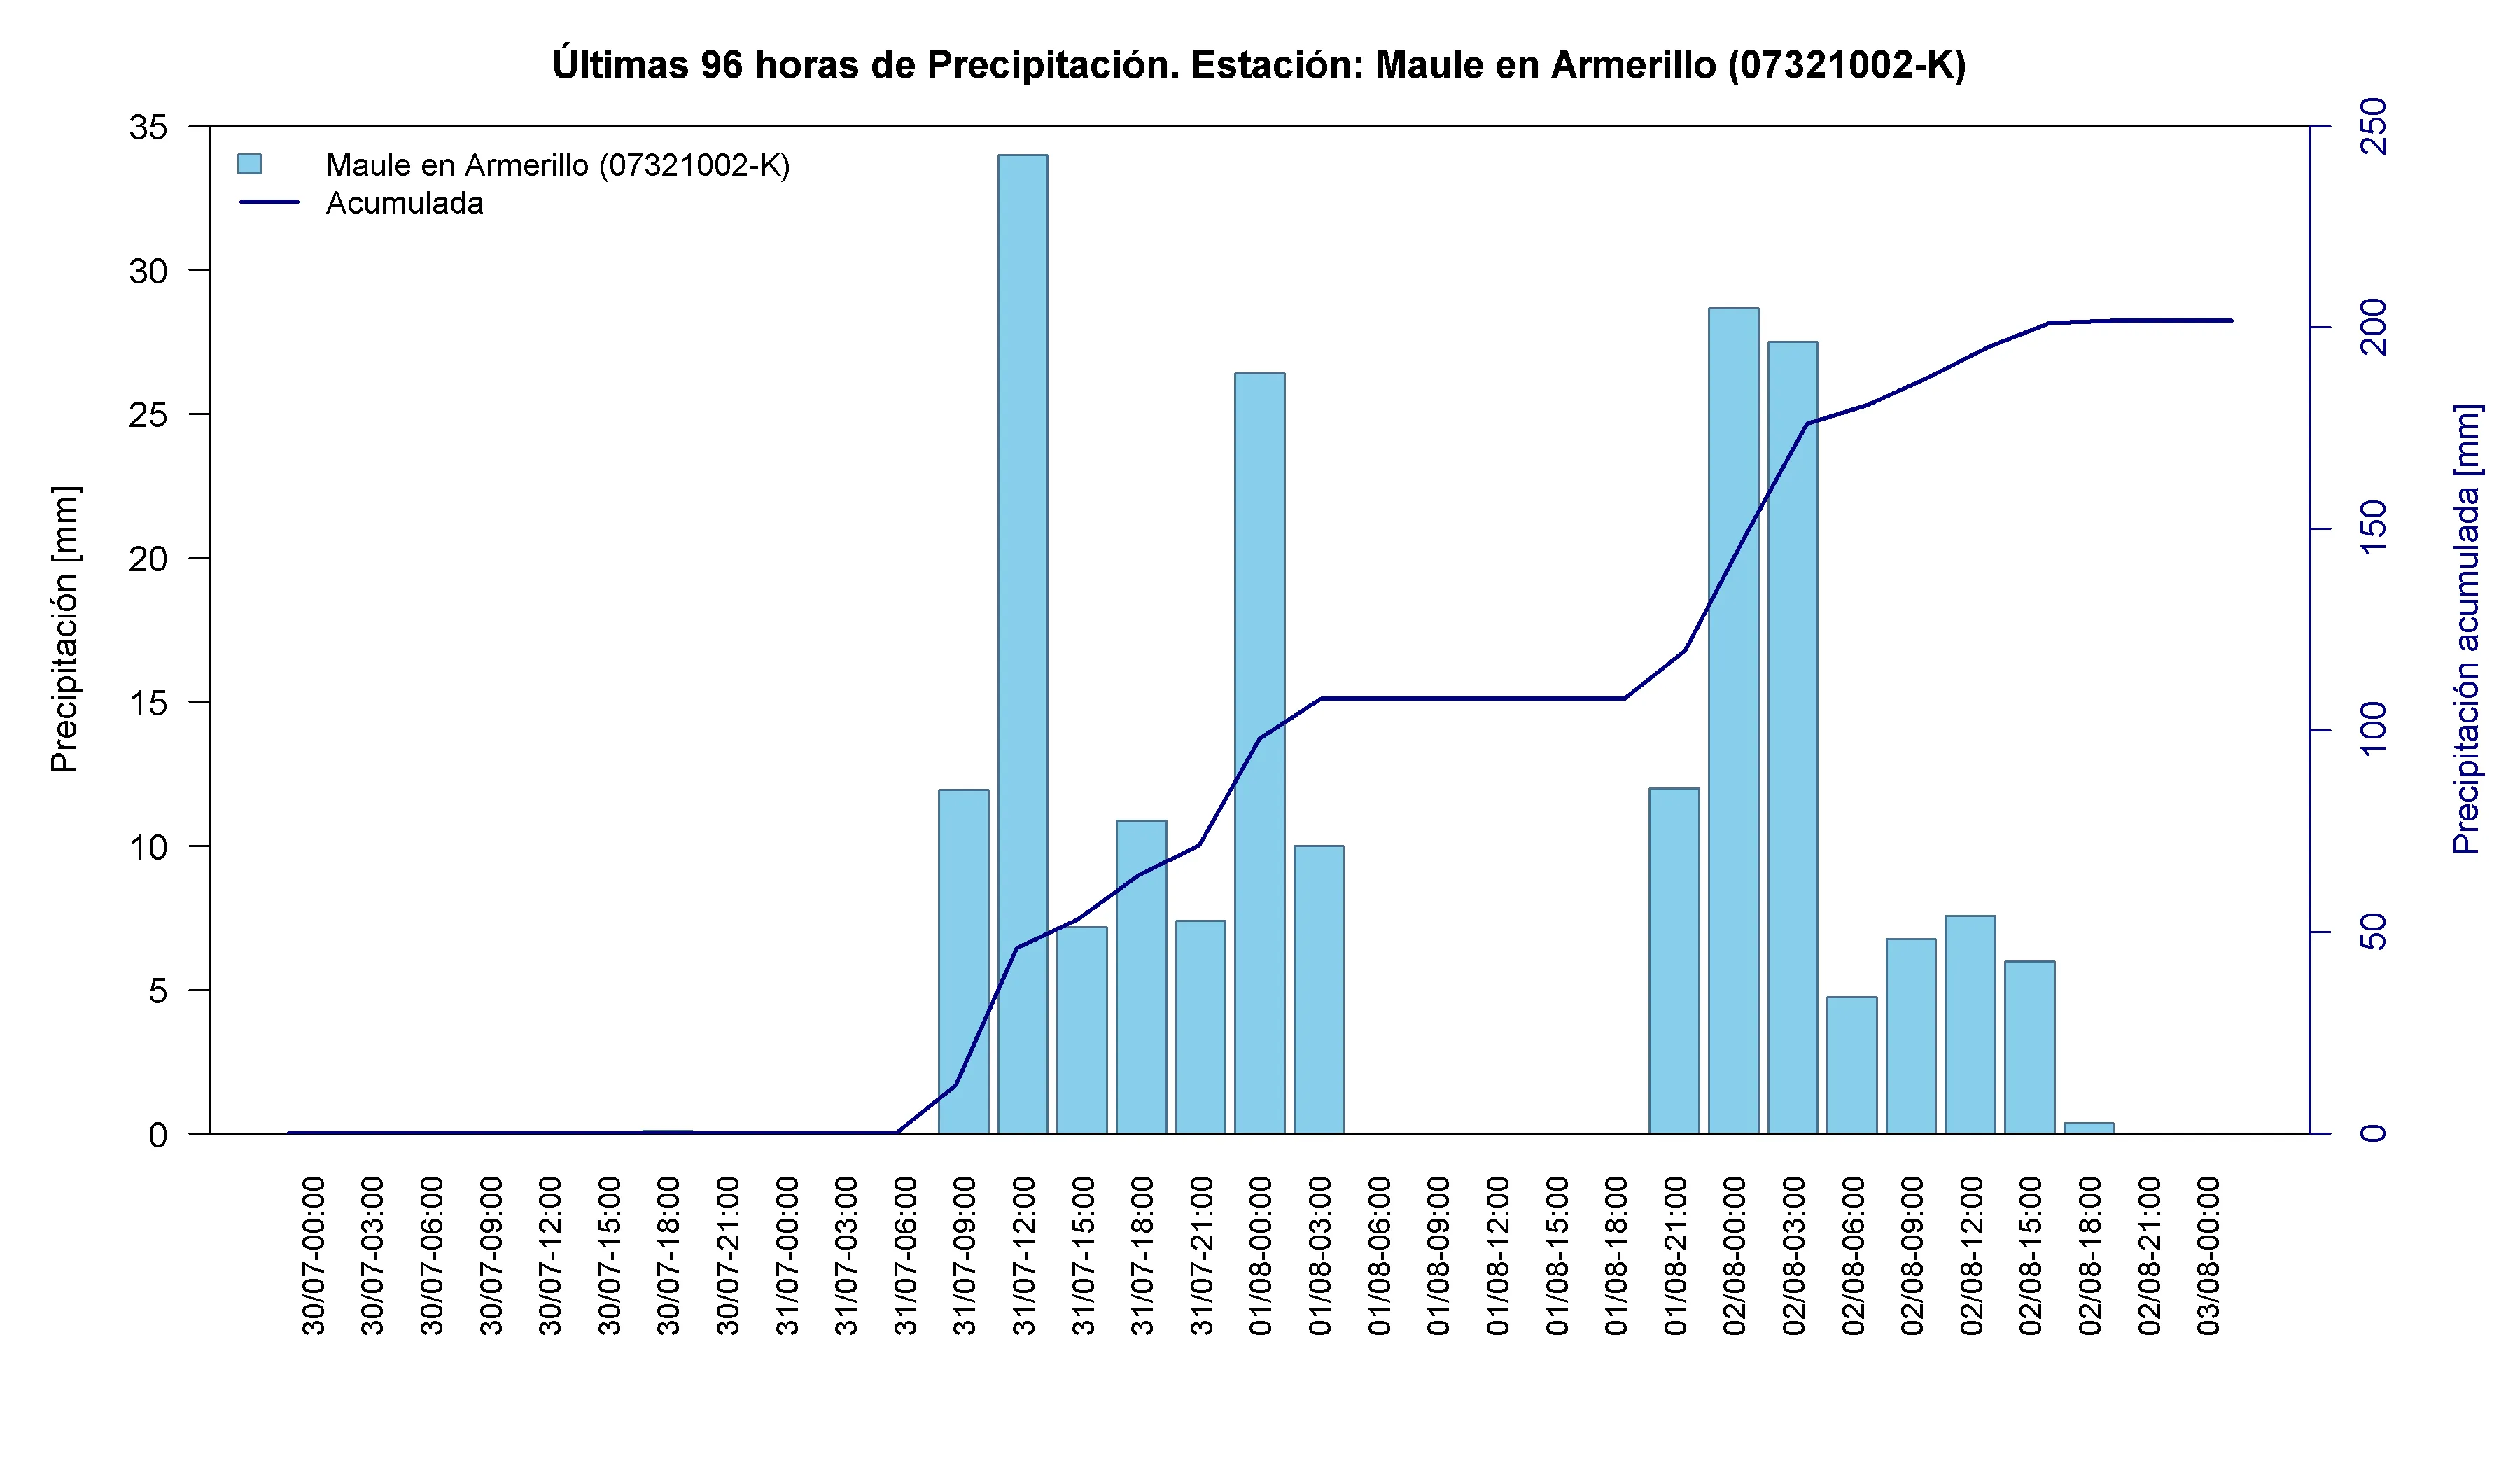
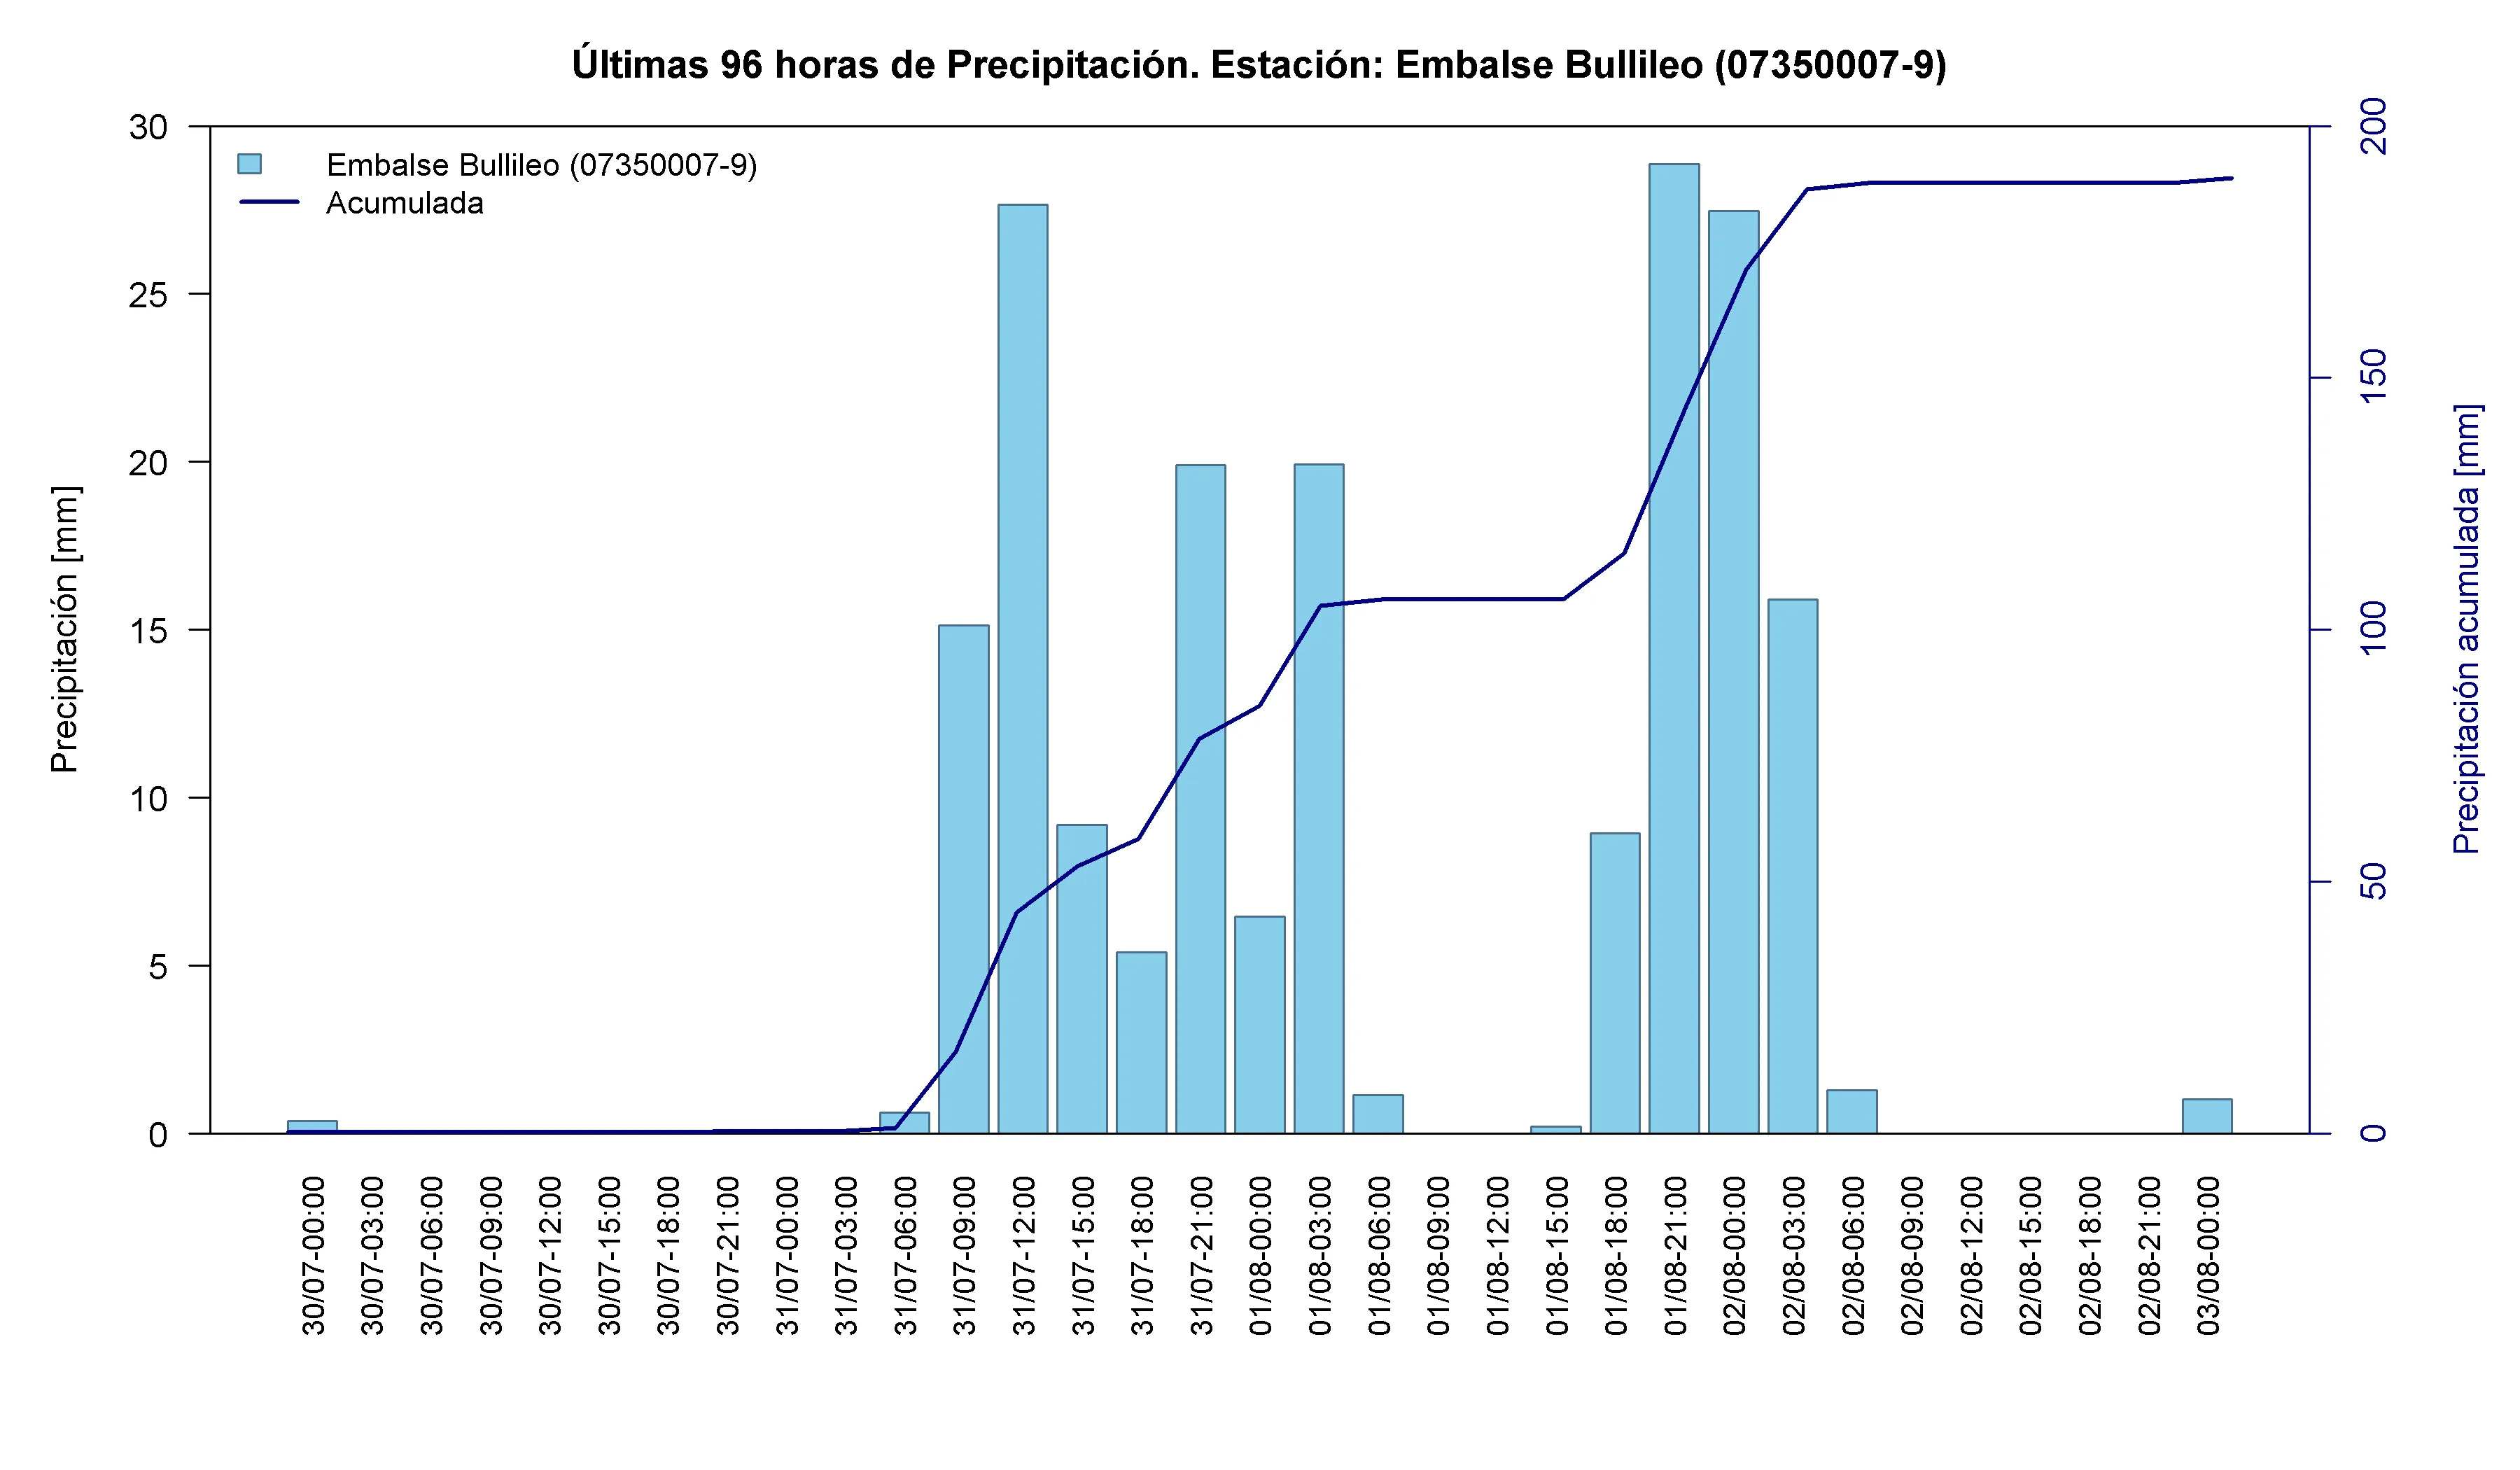
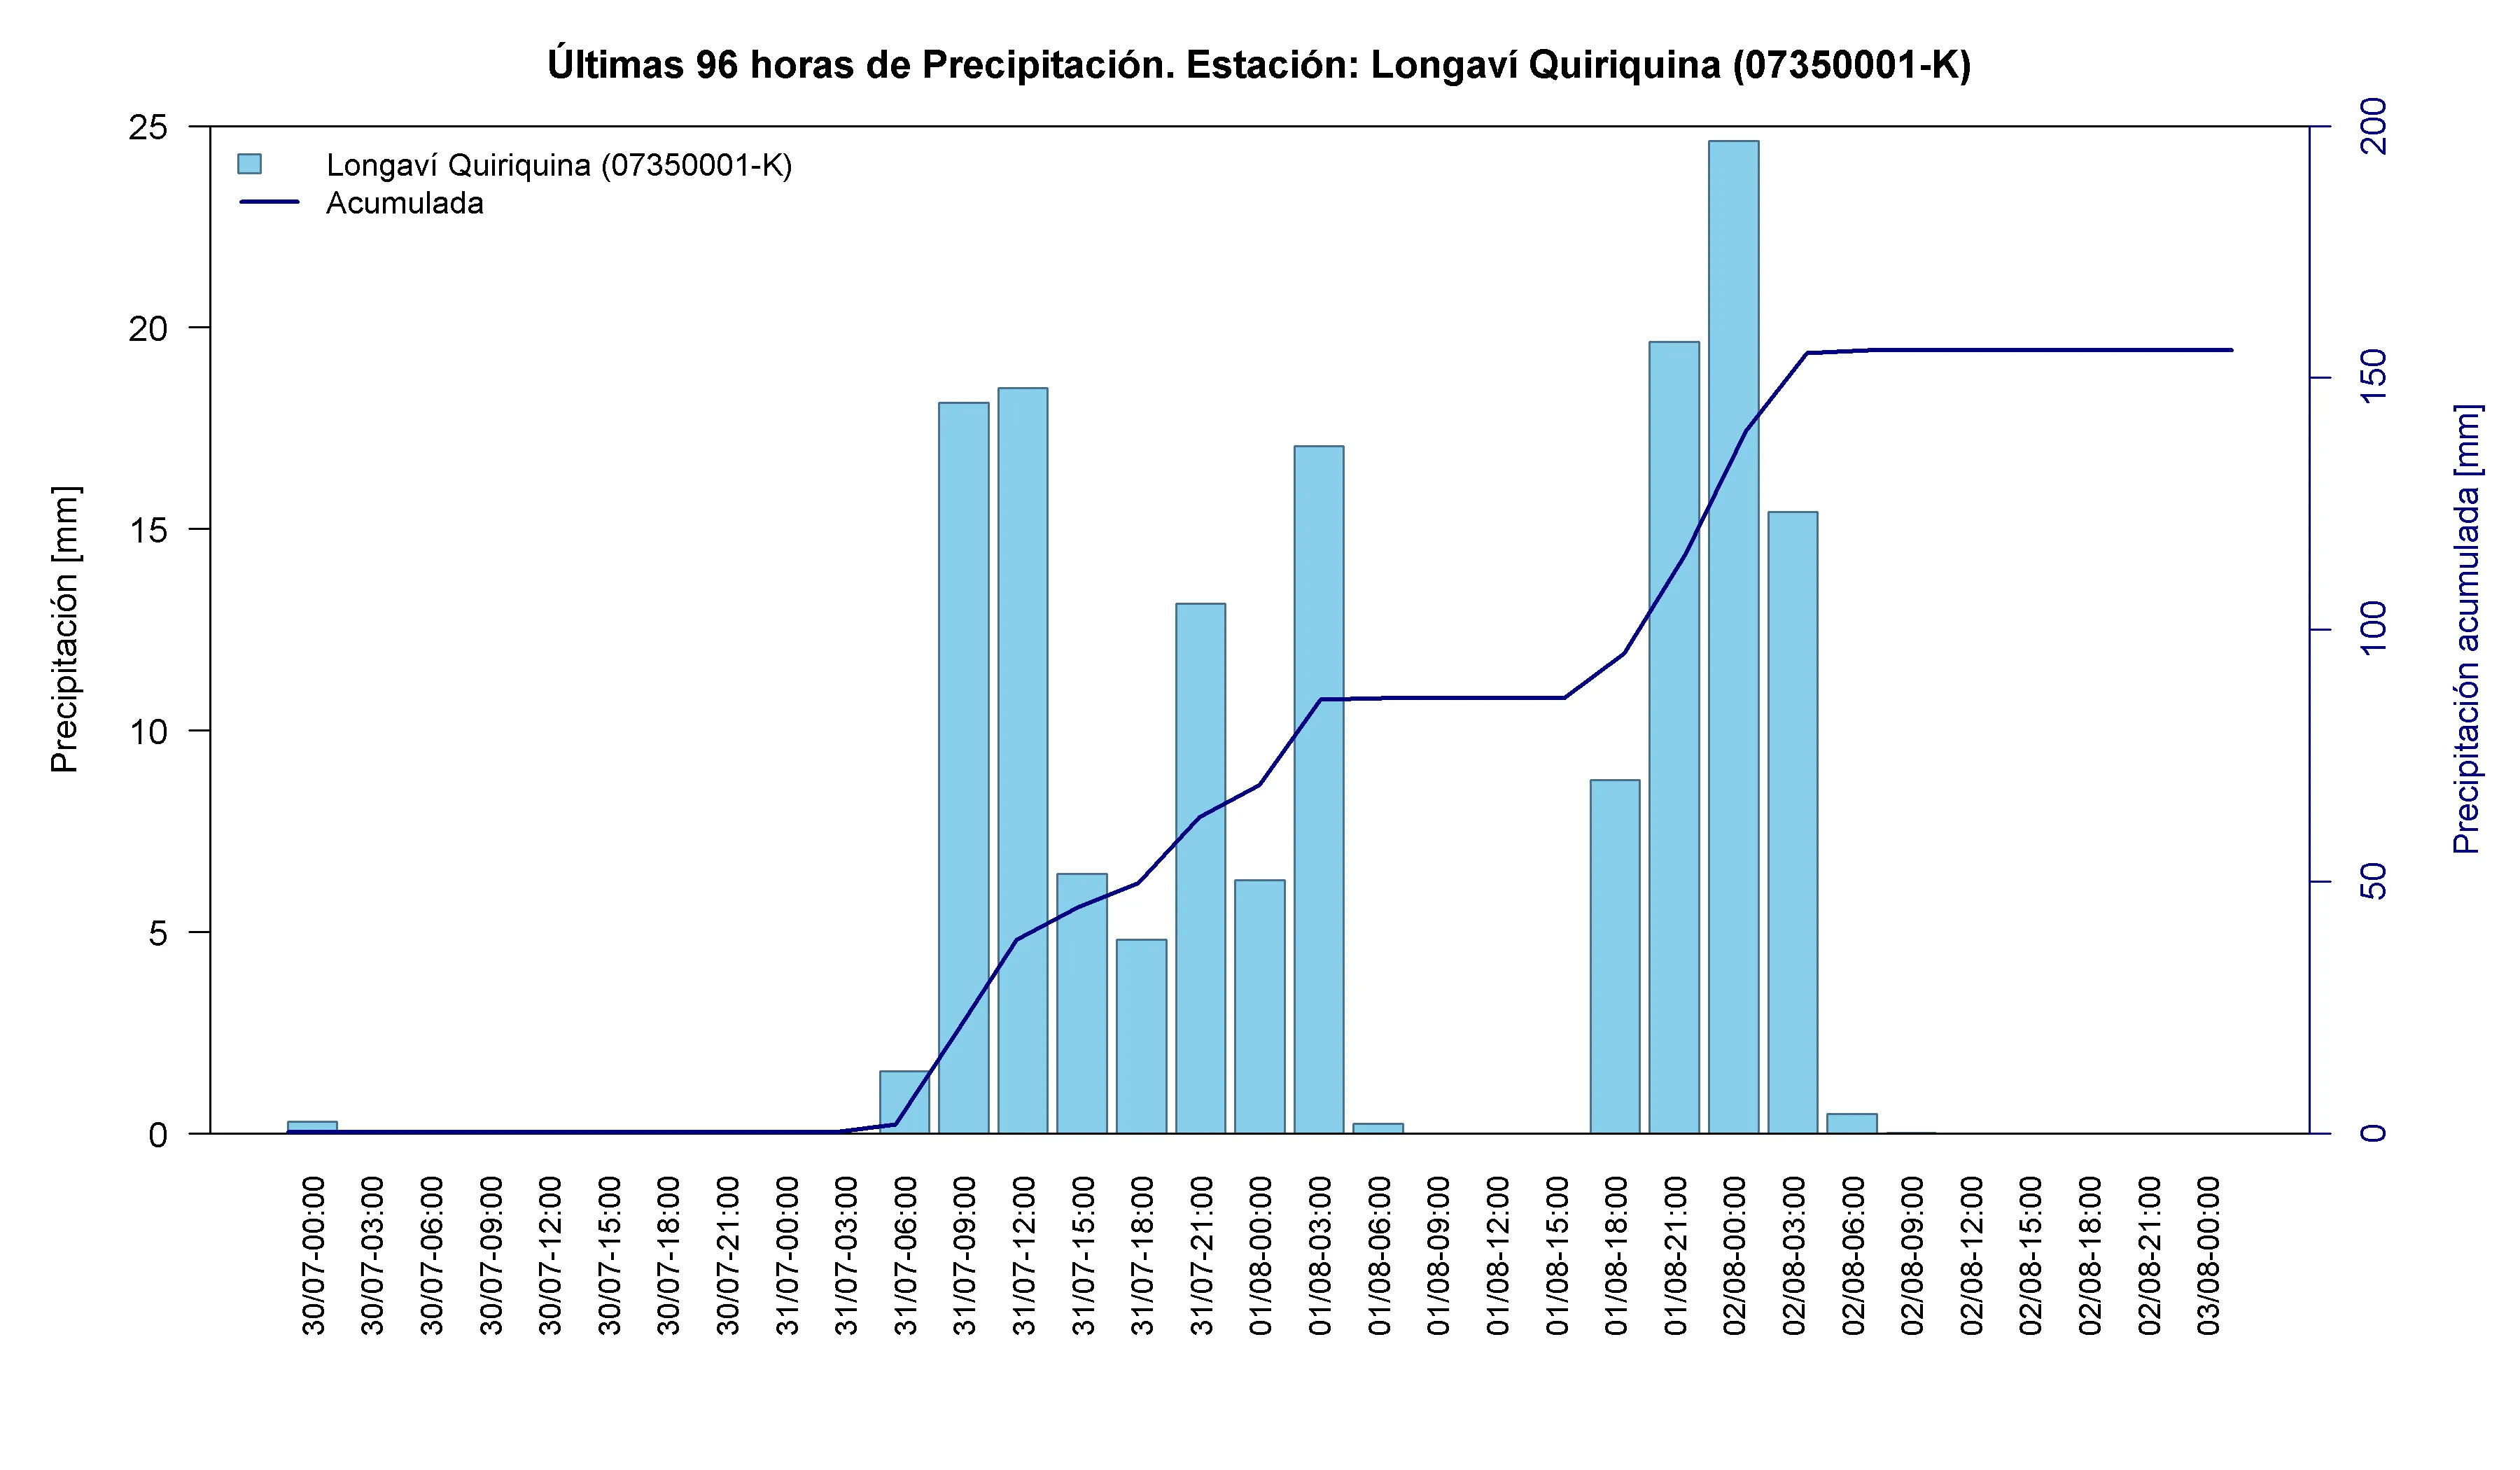
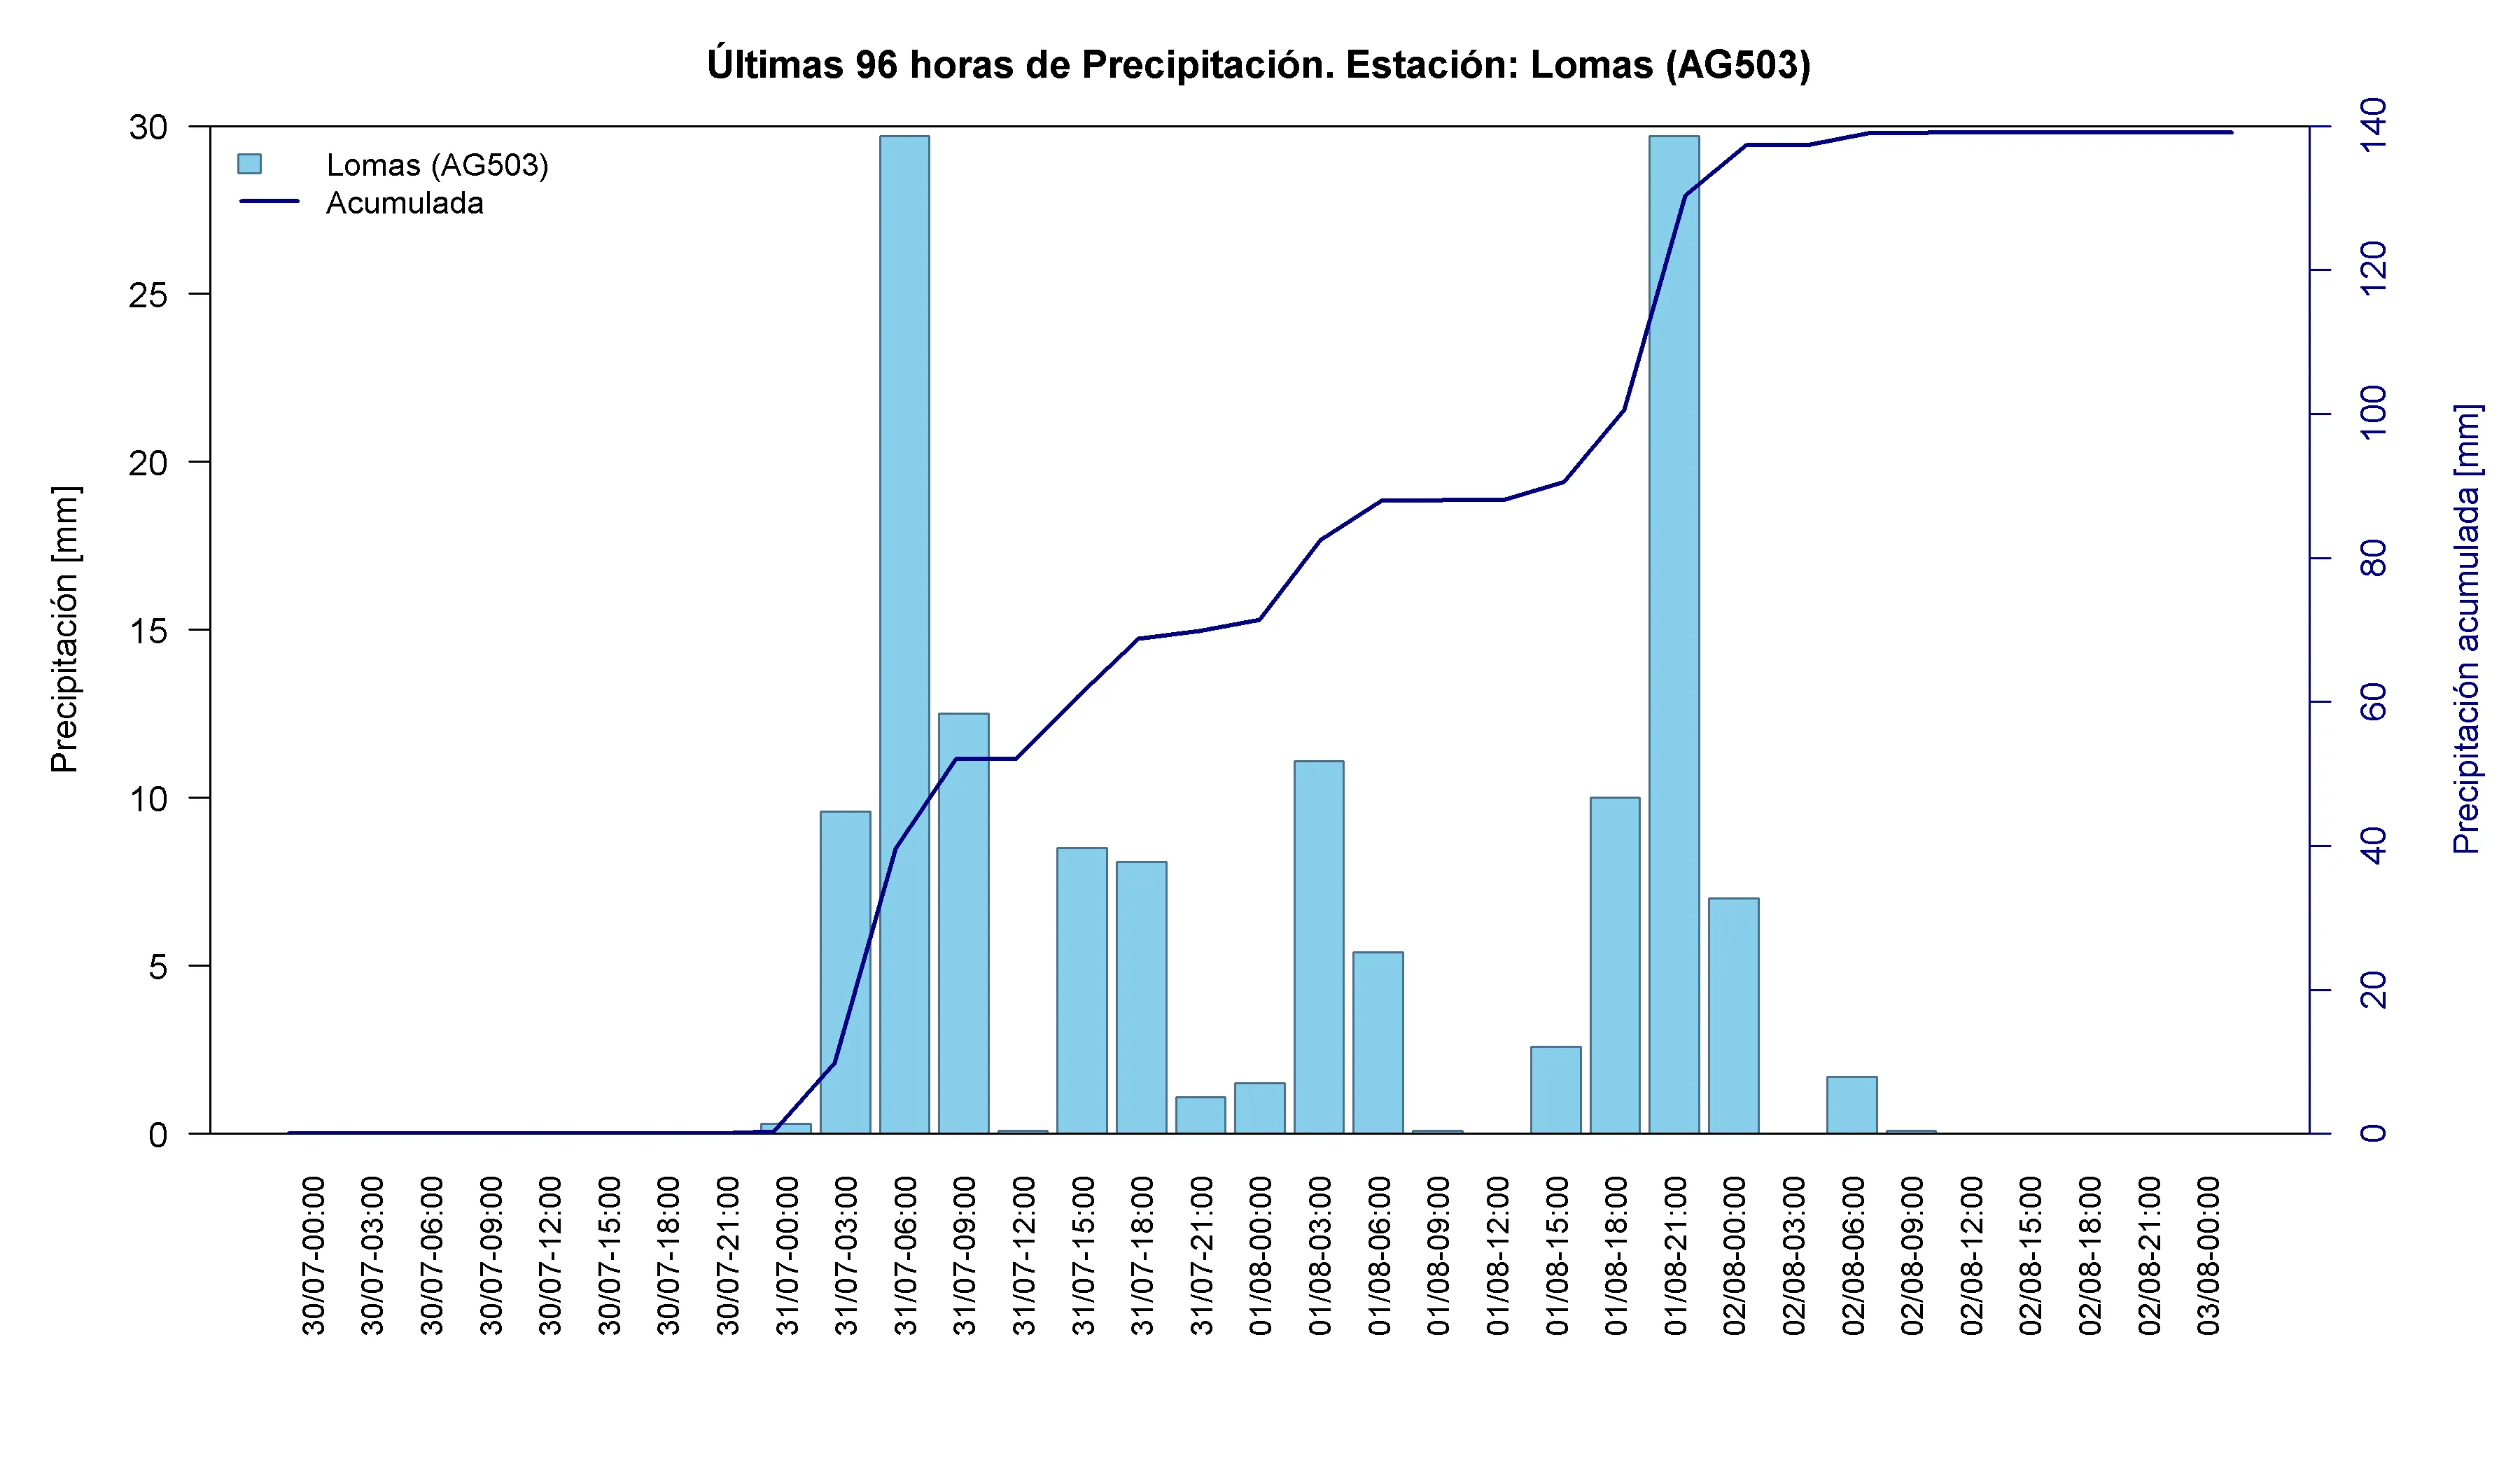
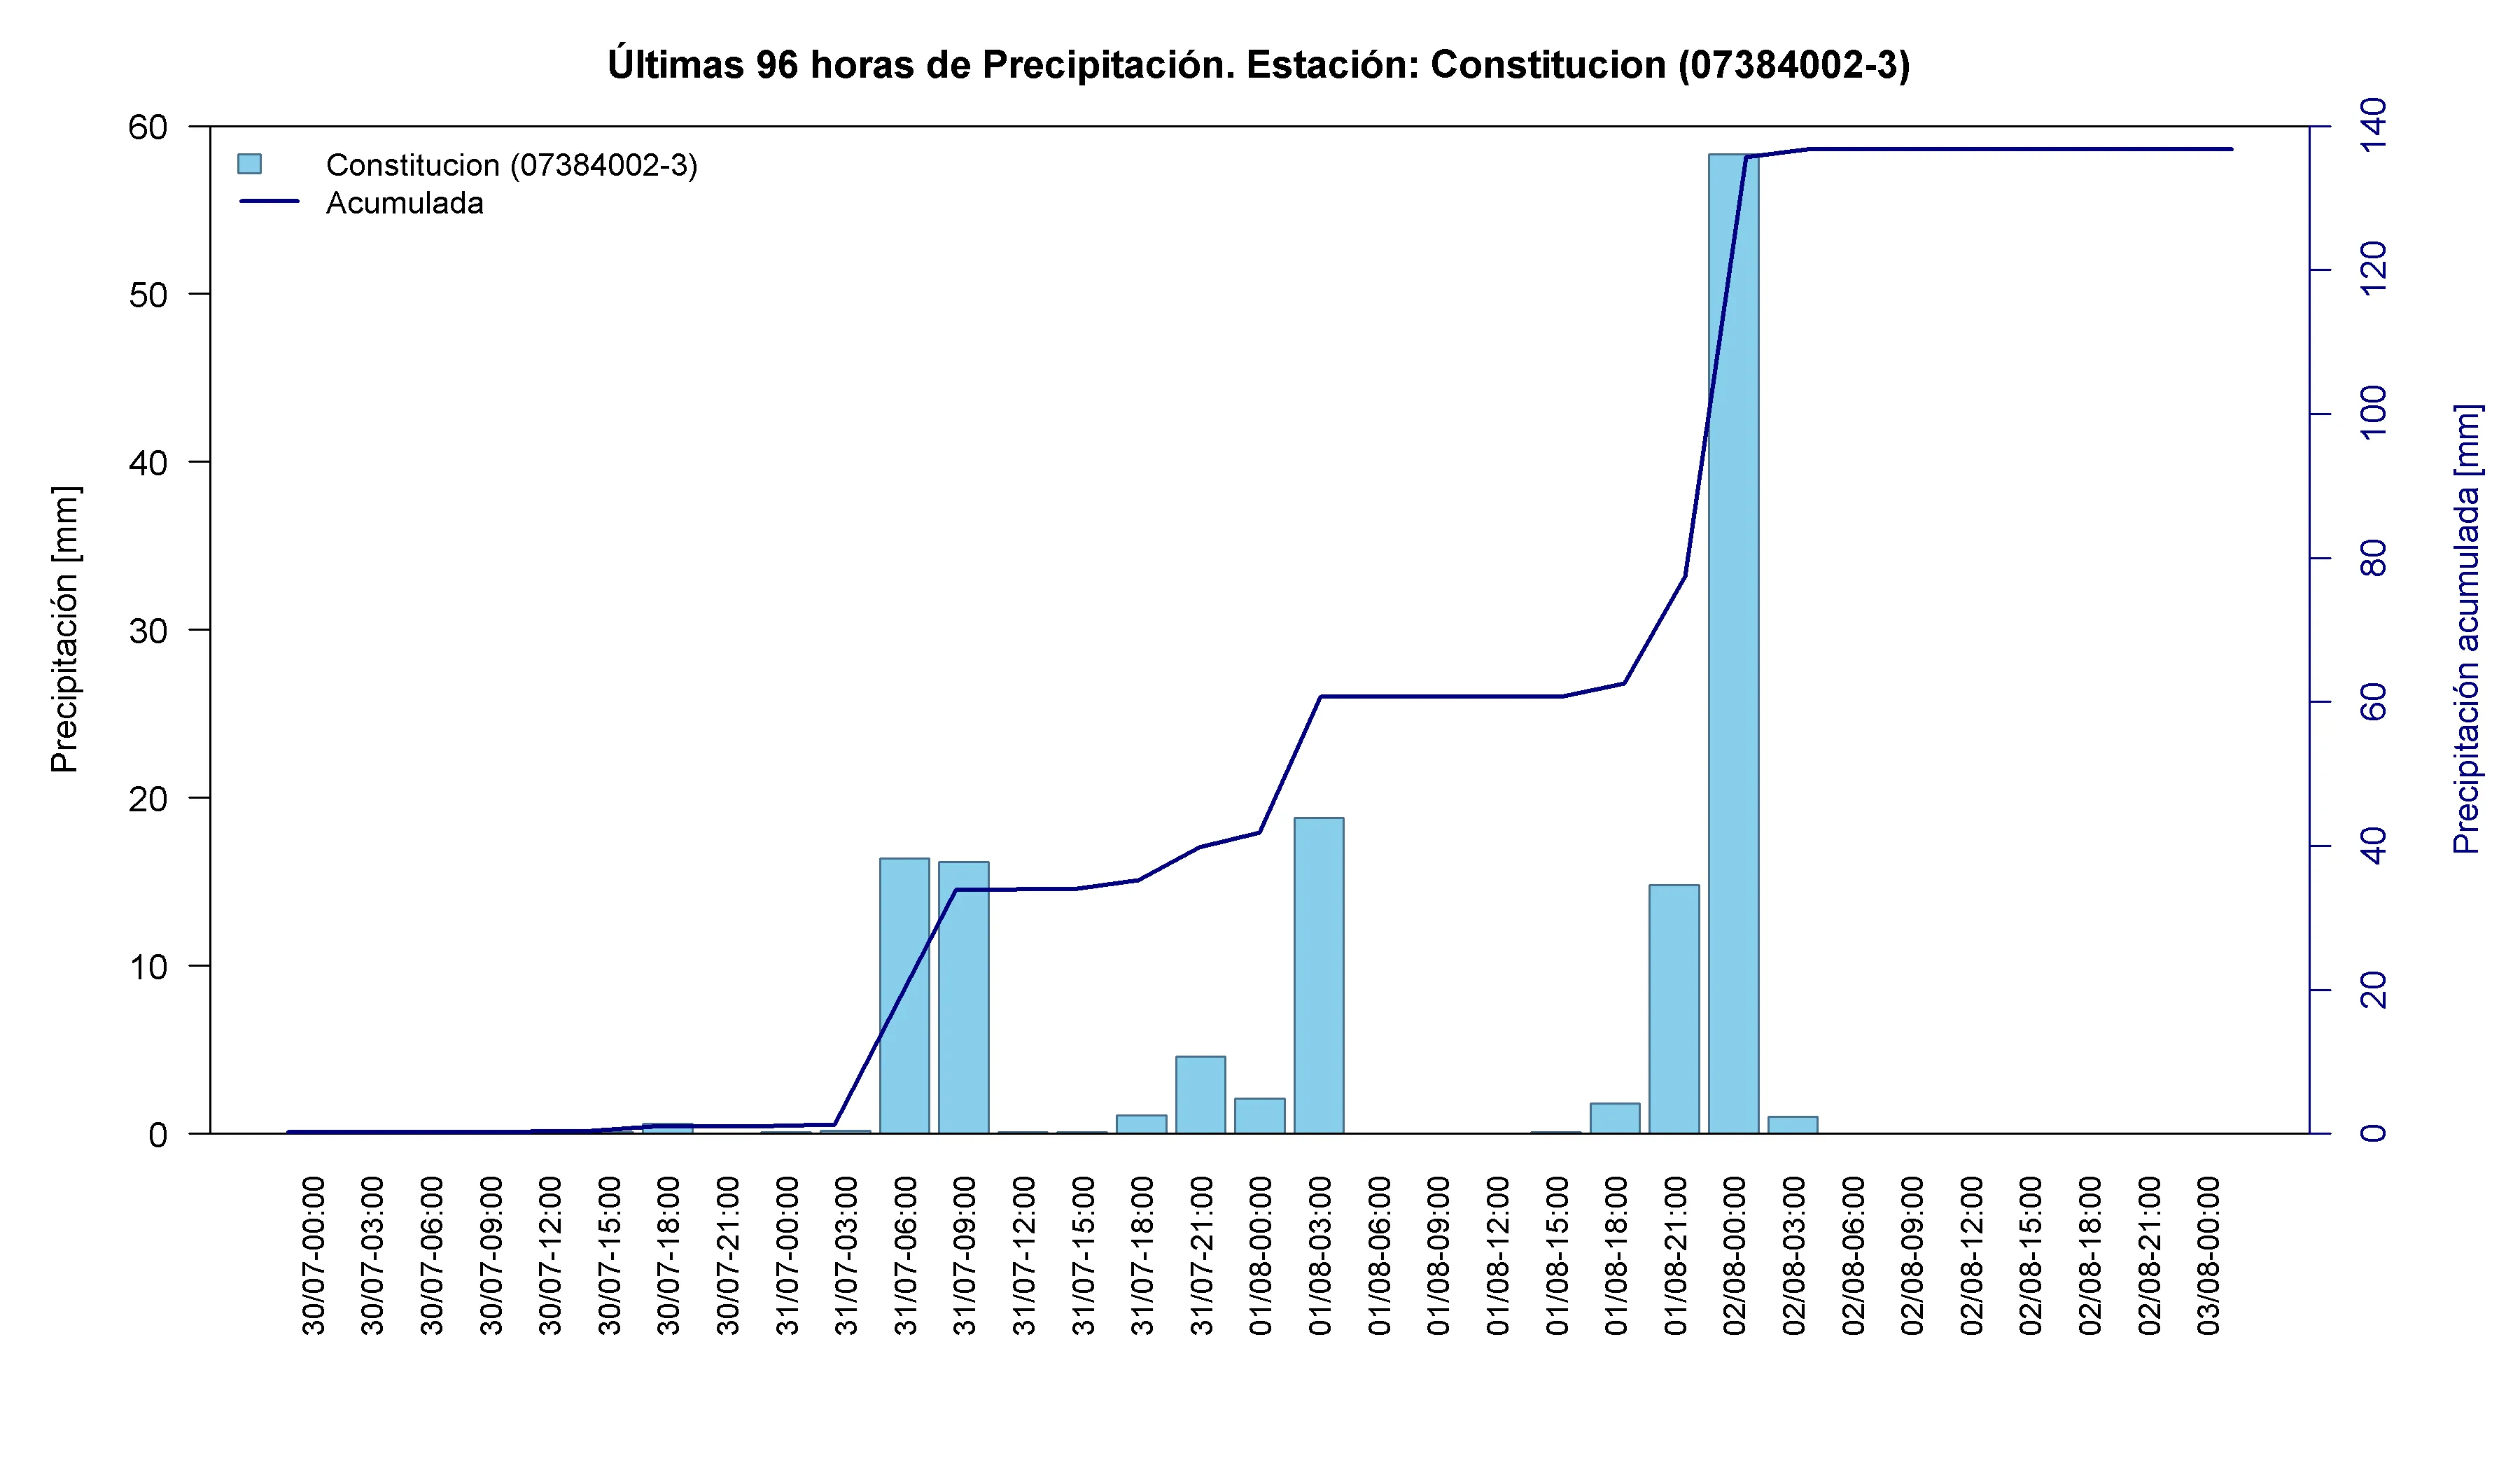
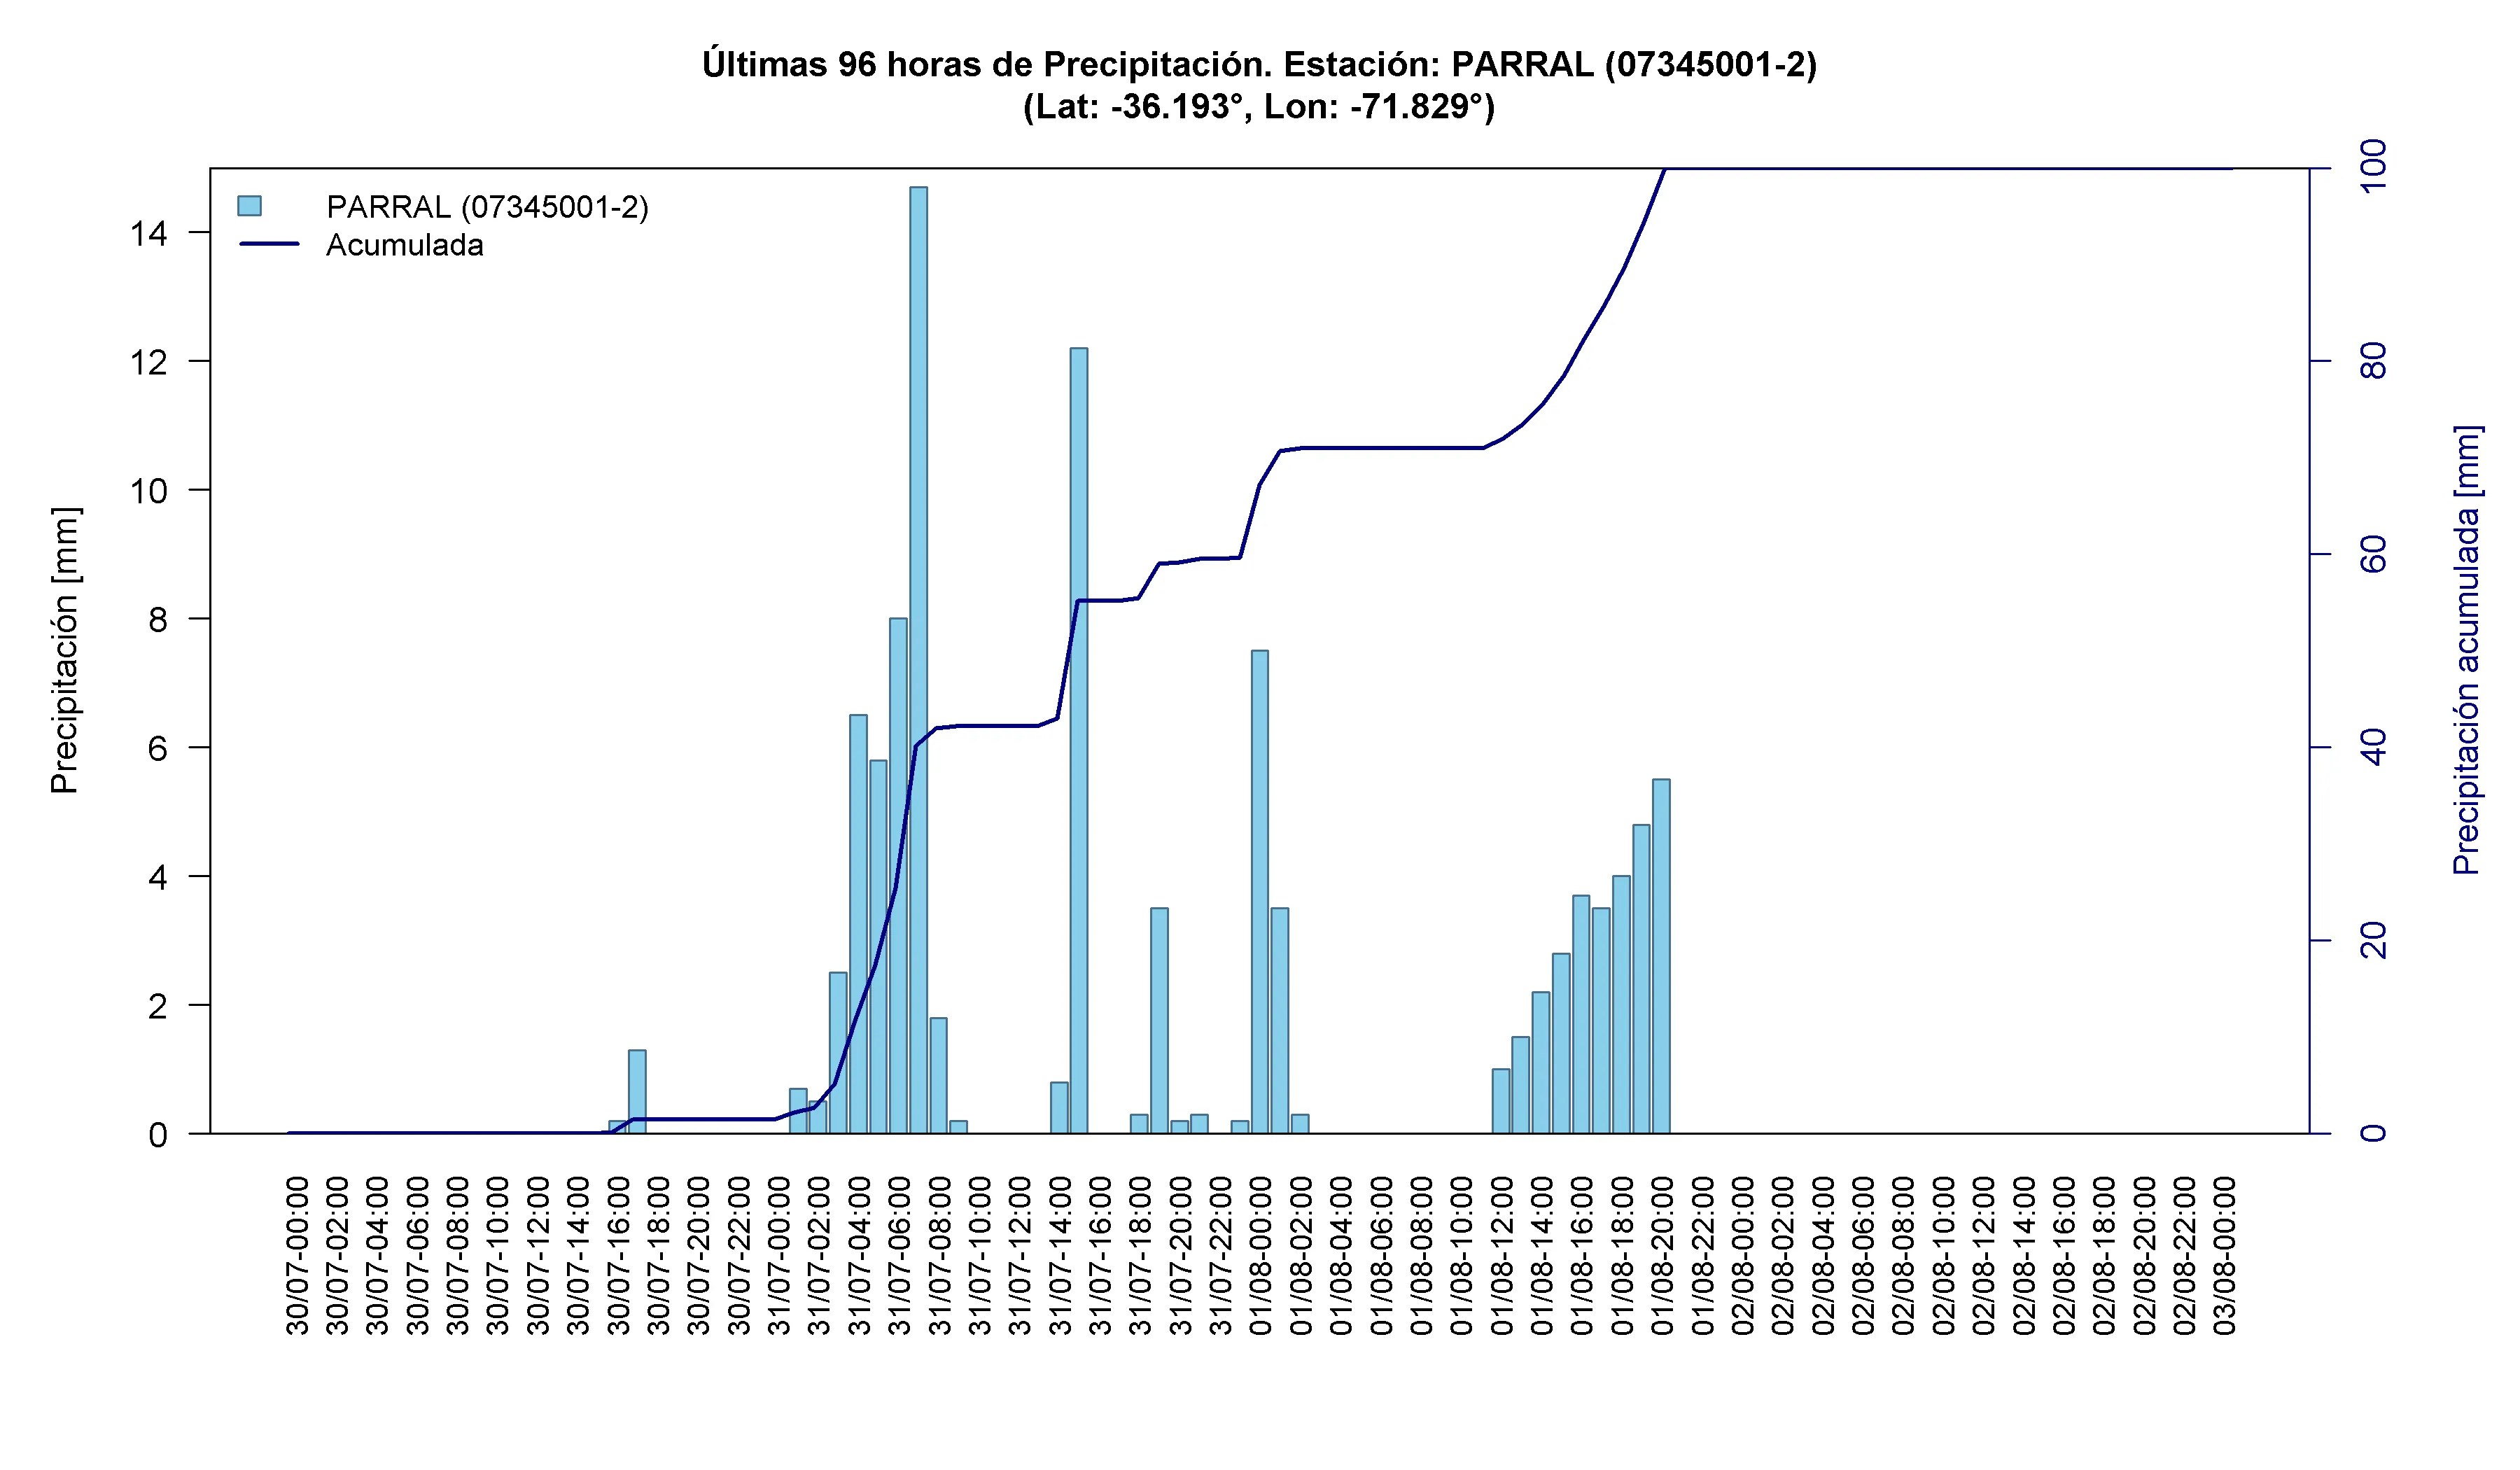
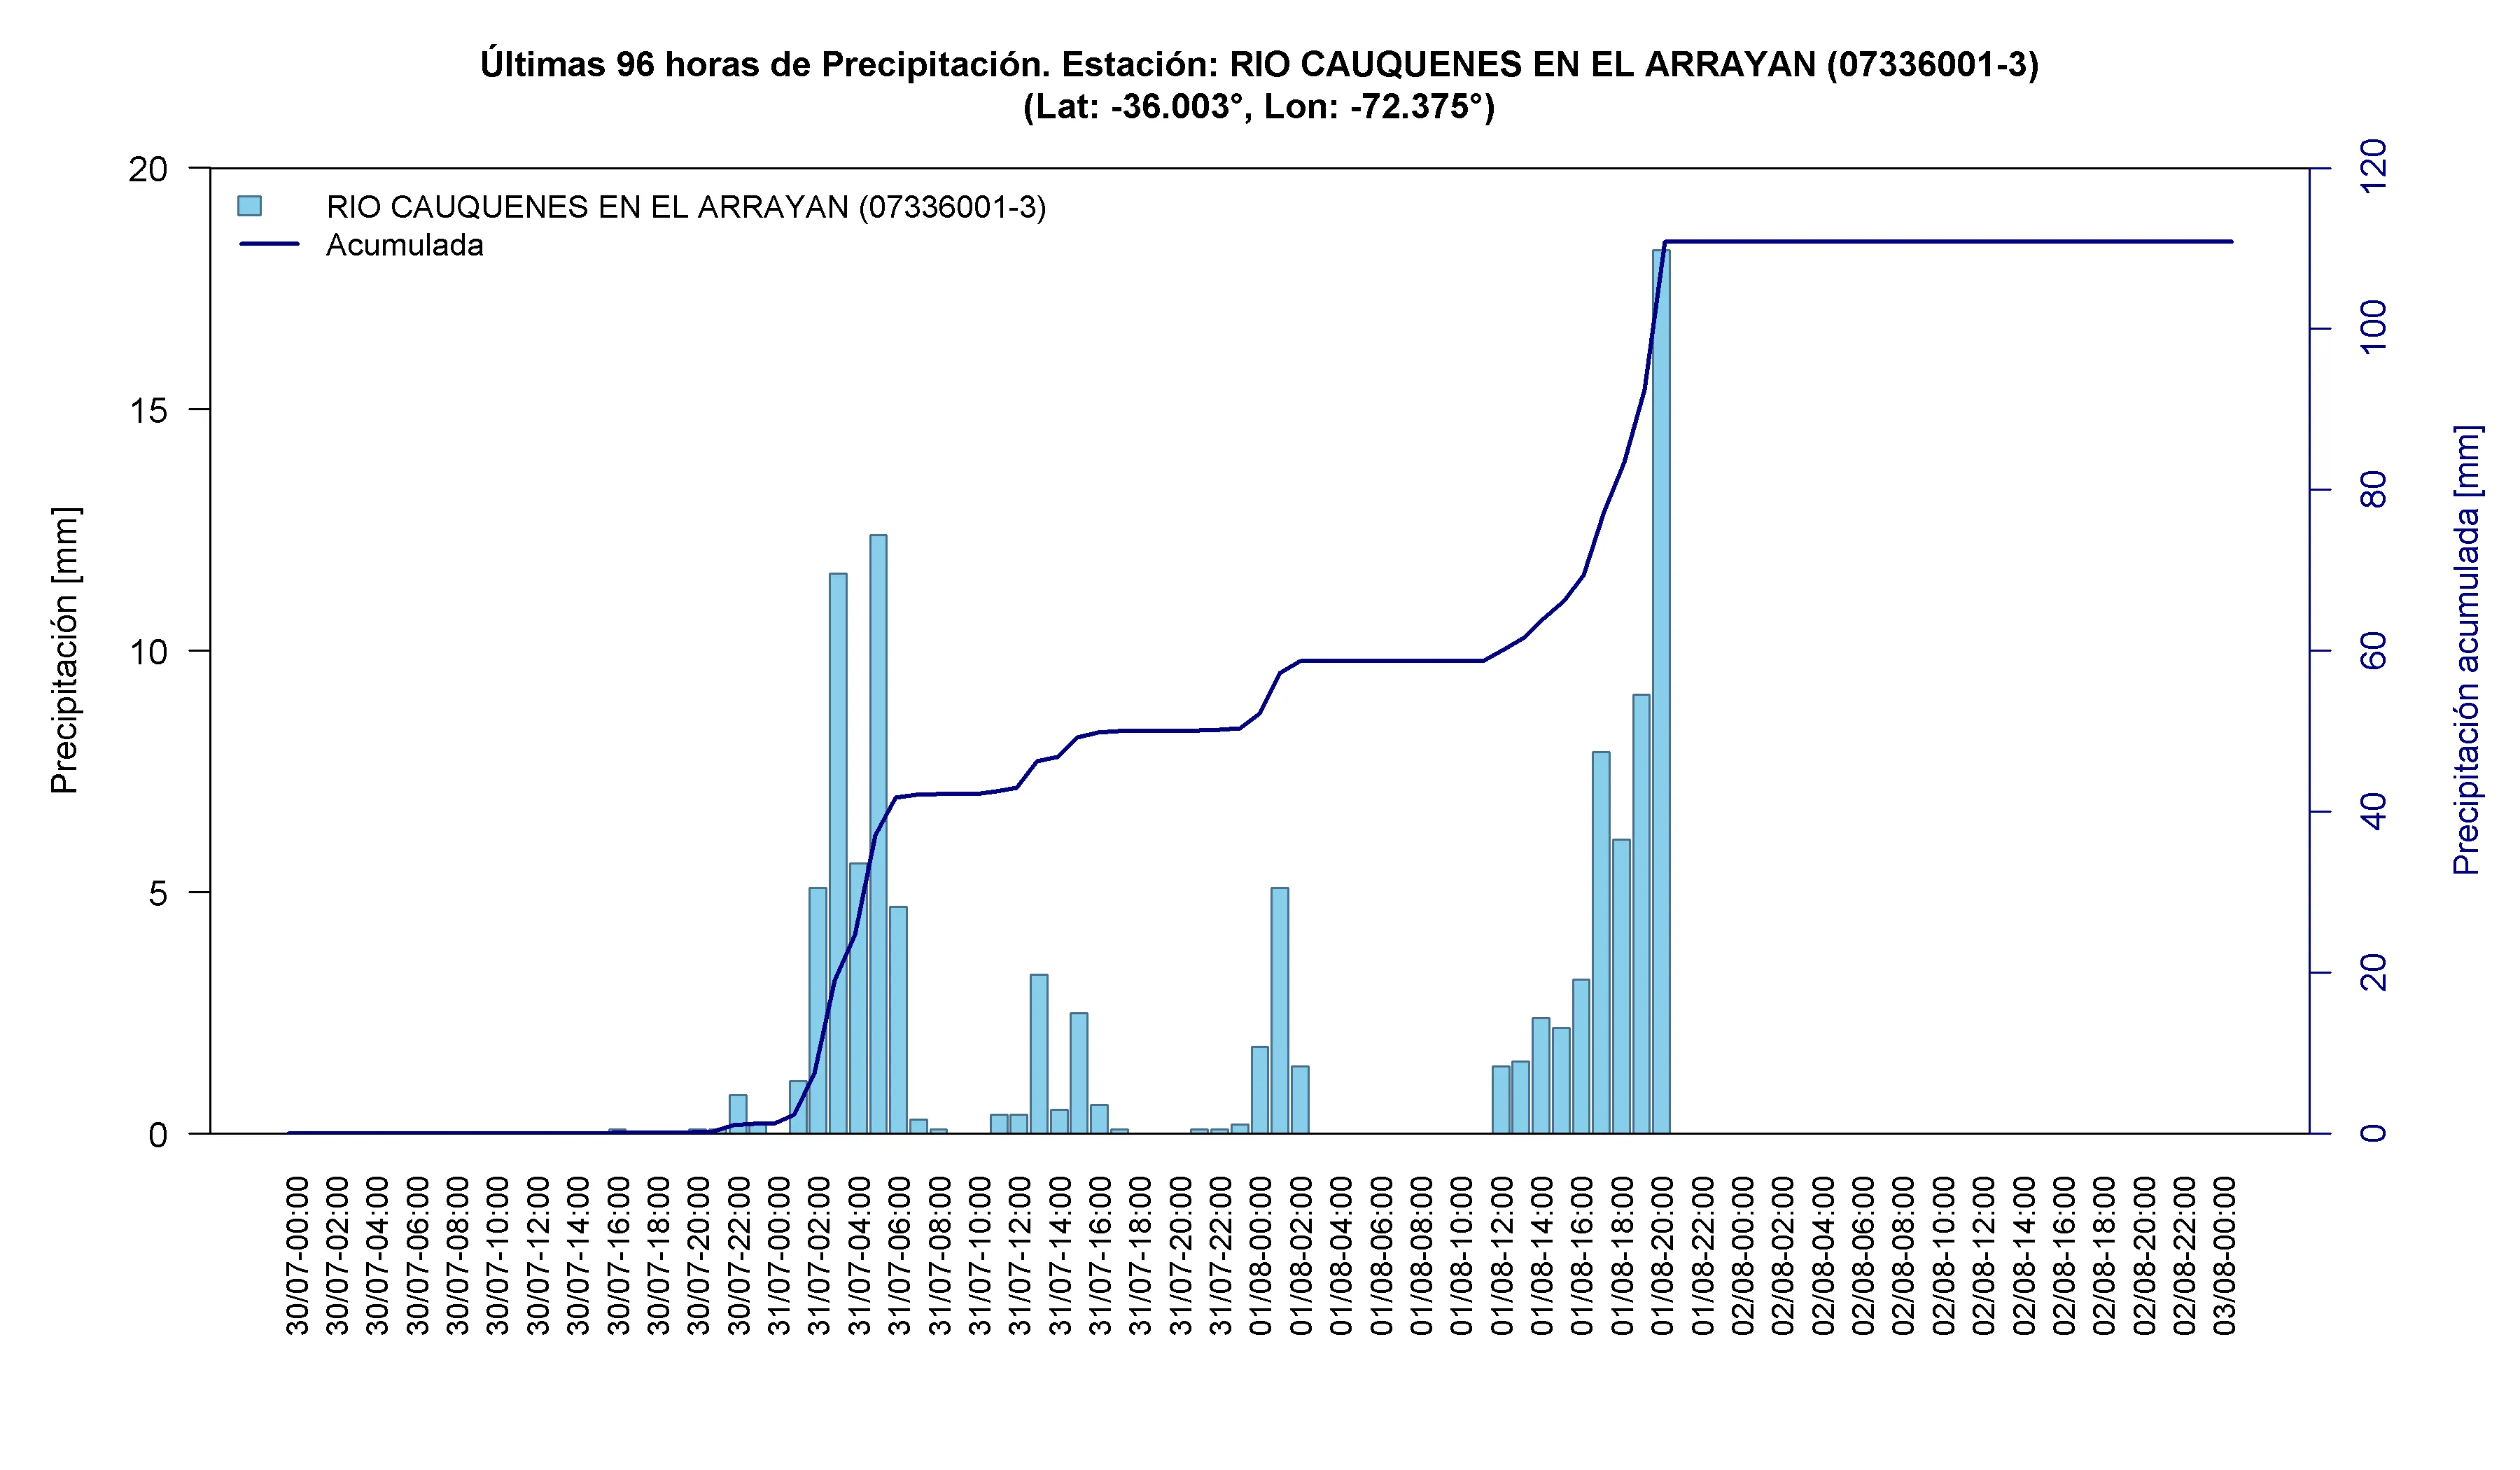
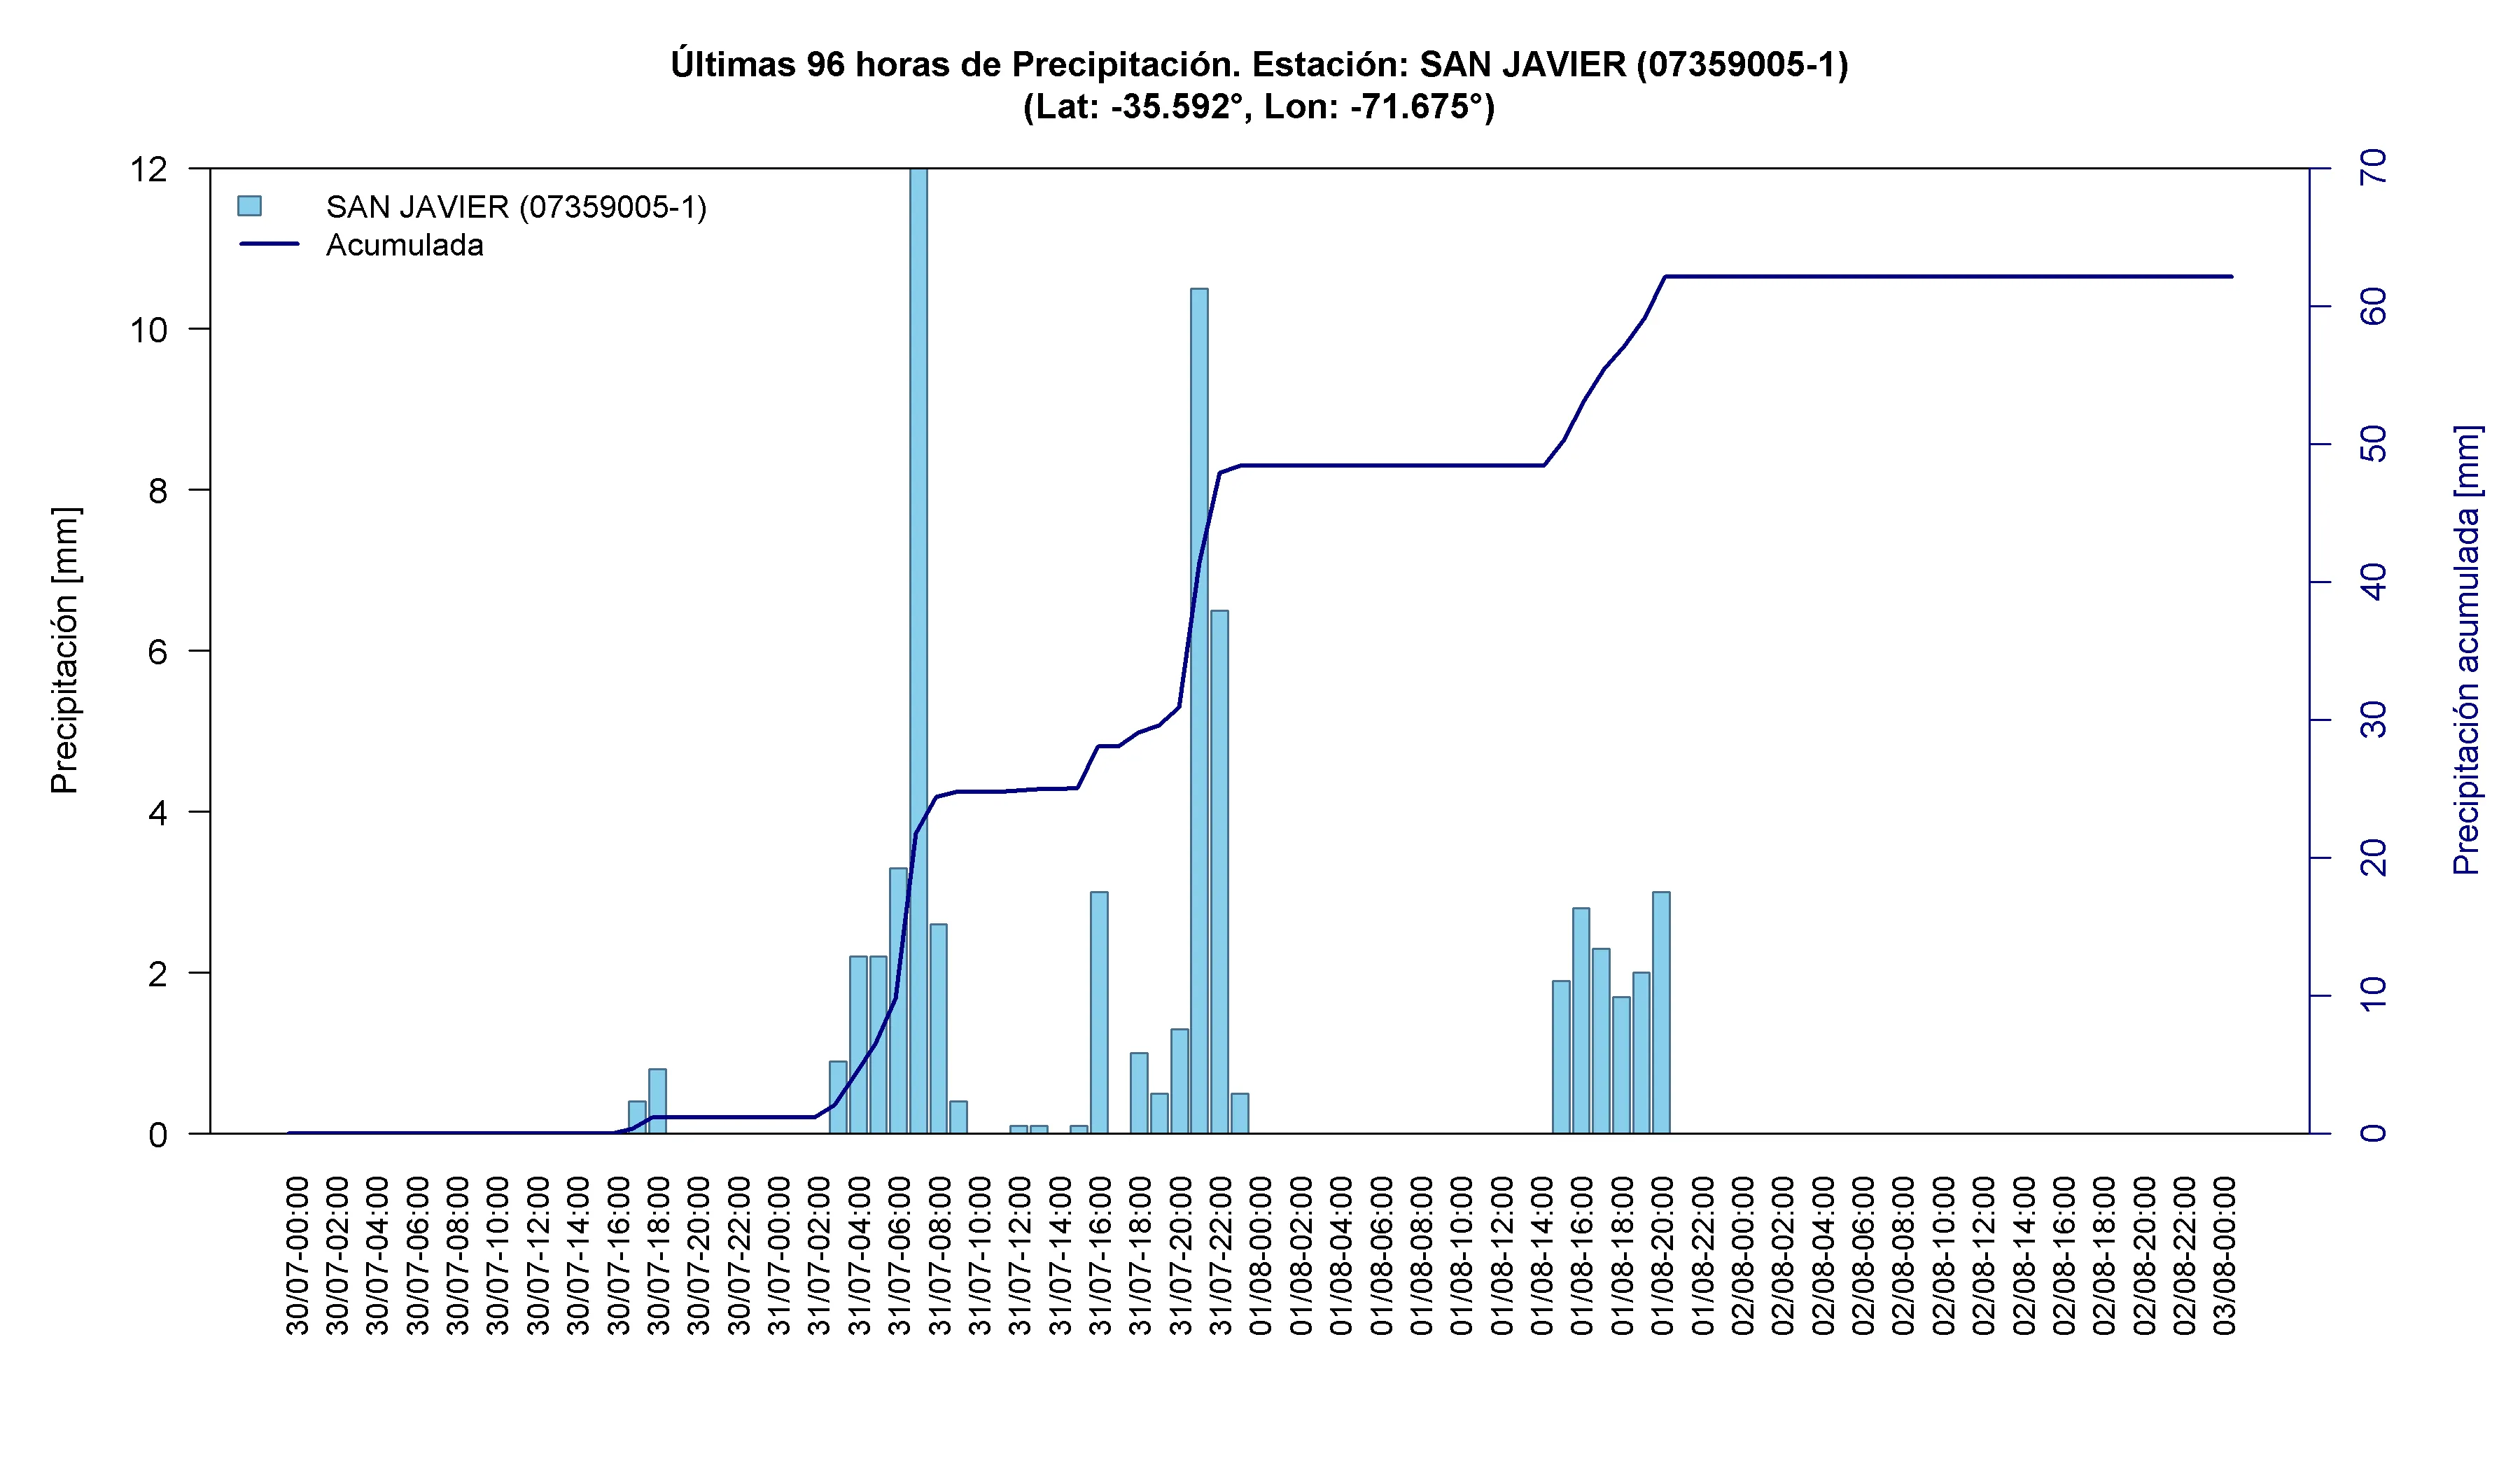
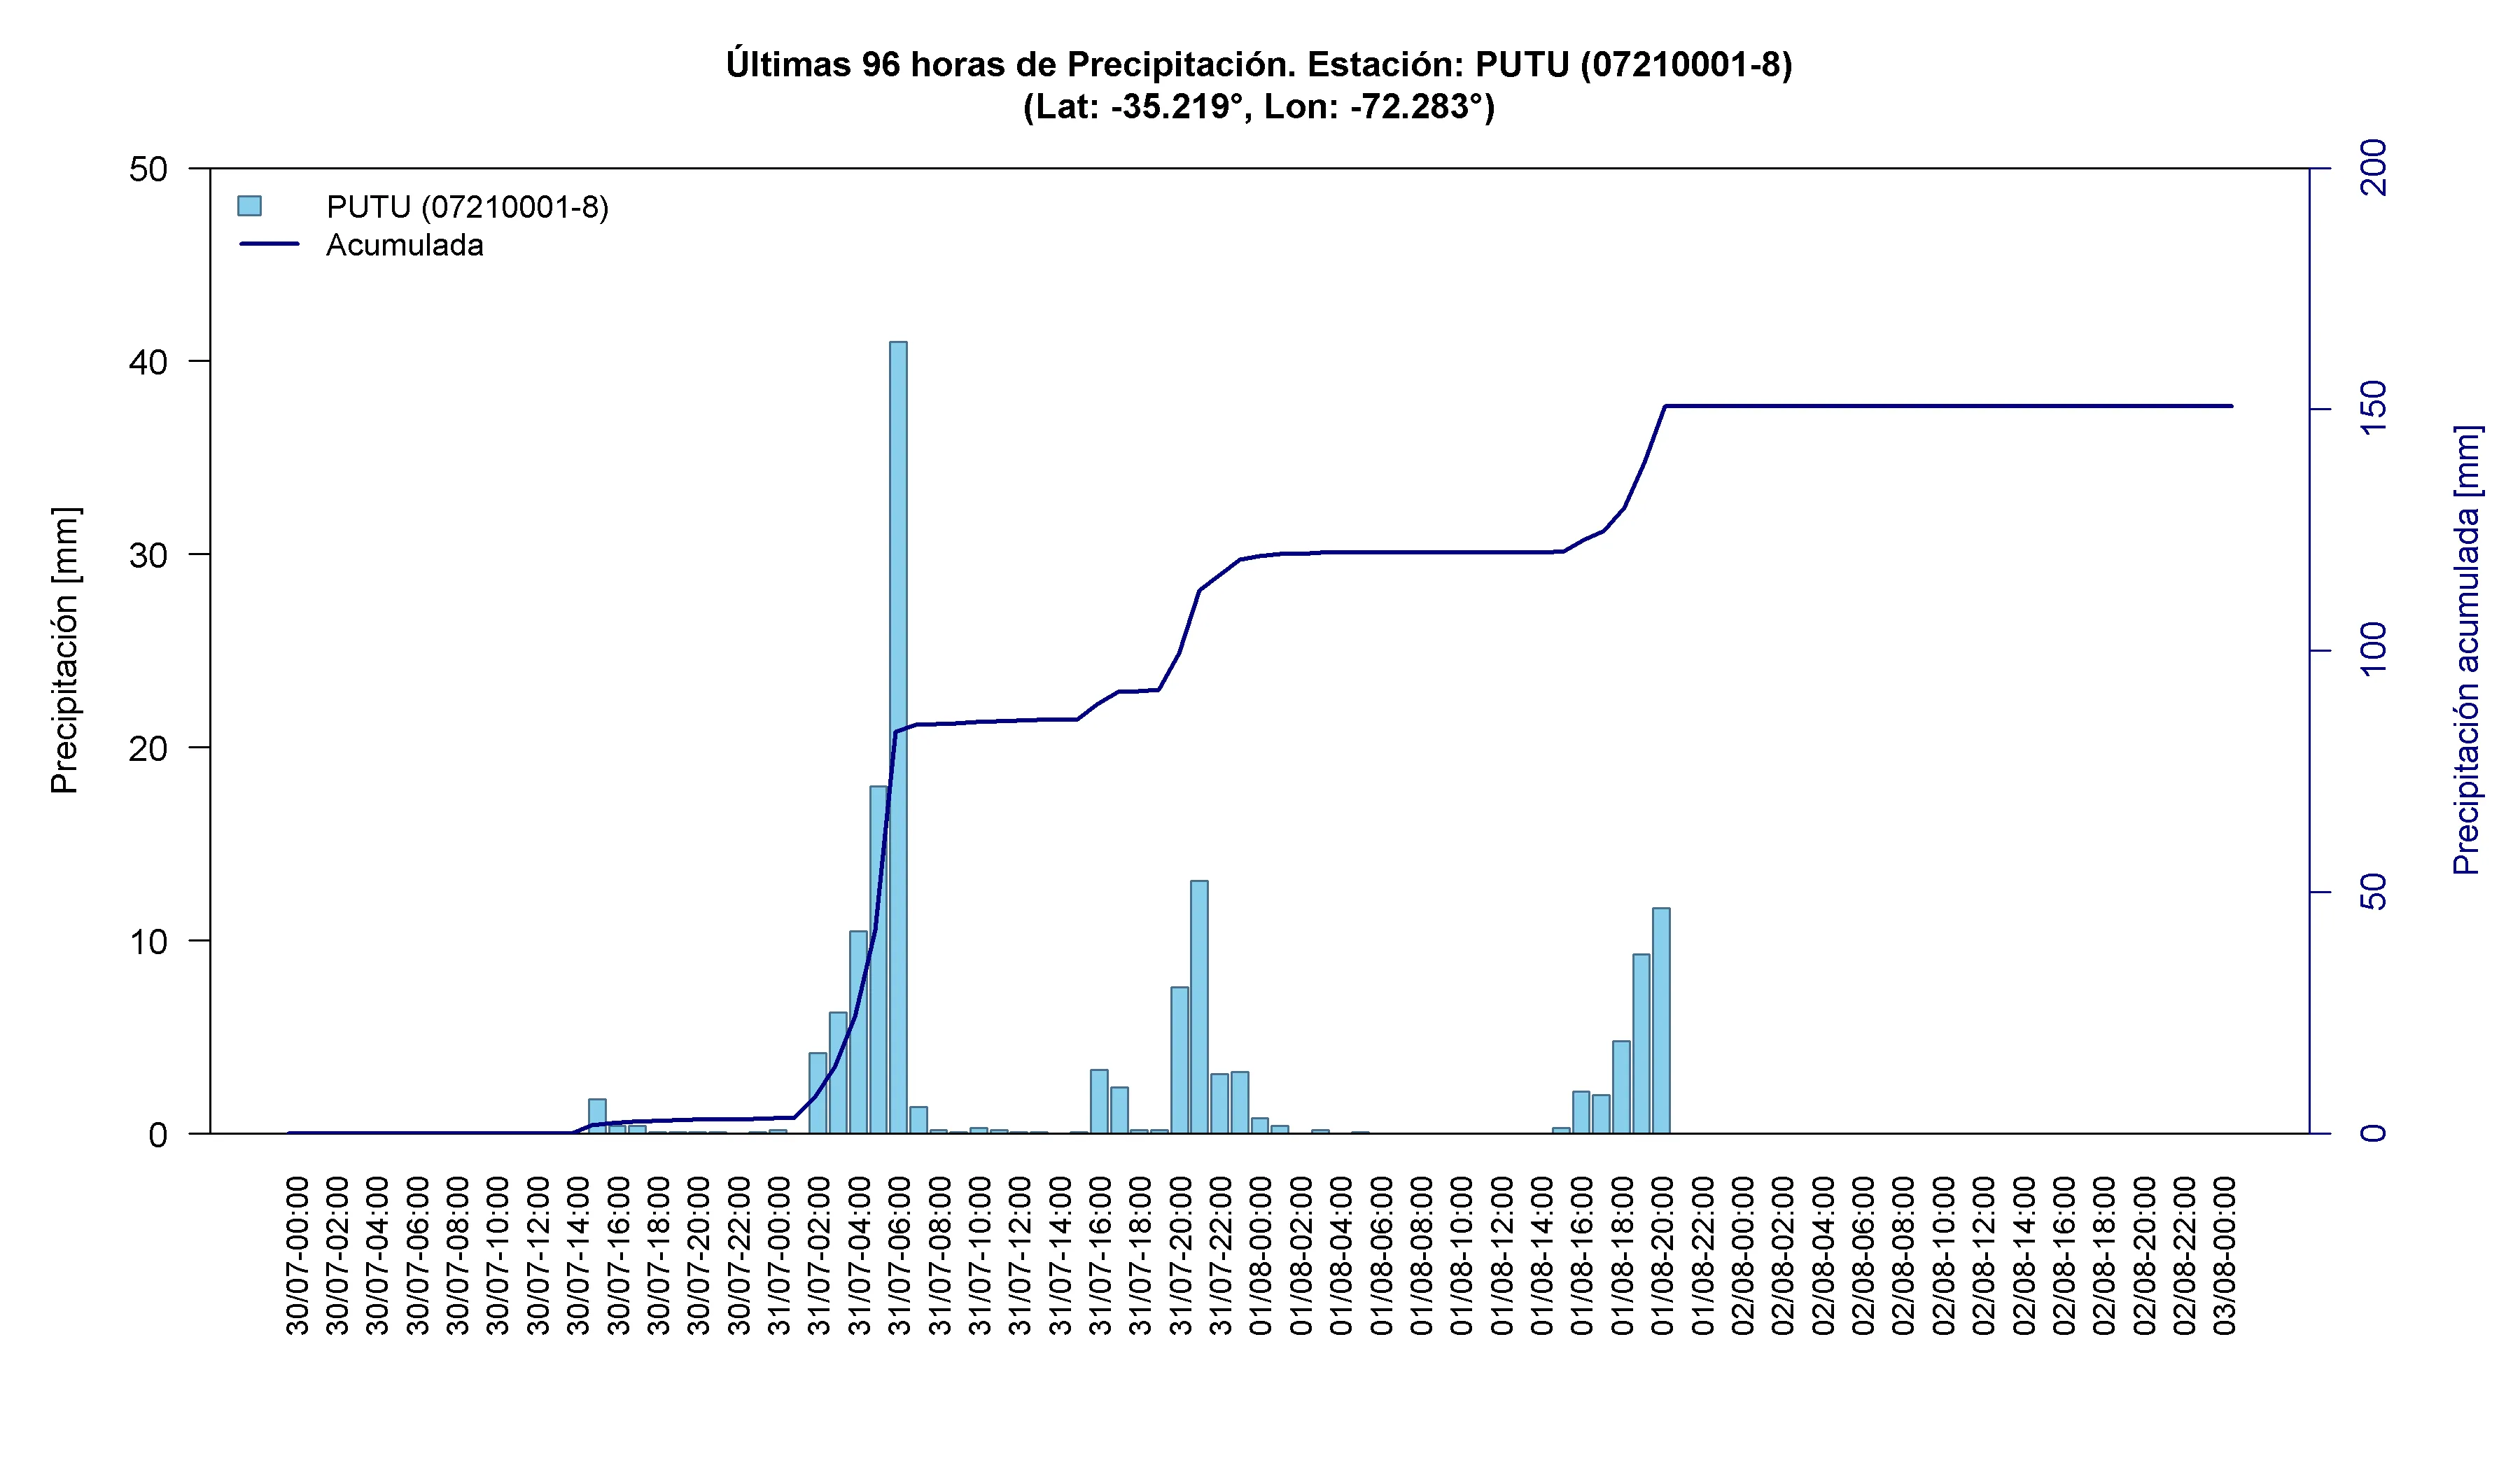
Maule was escalated to regional Red Alert in the early hours of Sunday 2 August after landslides and sustained river rises were detected ²⁵ . During the weekend, SENAPRED also issued local Red Alerts for overflow risk in Cauquenes and Parral, Linares, Villa Alegre, San Javier, Licantén and Curepto ²³ ²⁴ ² . Maule contributed 317 isolated people to the national balance, the second-highest regional count after La Araucanía ⁵ .
Map 5. Location of the rain-gauge stations analyzed in Maule during the frontal system. Source: own elaboration based on VisMet data.
Table 5. Accumulated precipitation at rain-gauge stations in Maule between 30 July and 2 August 2026.
Time series: highest accumulated precipitation stations
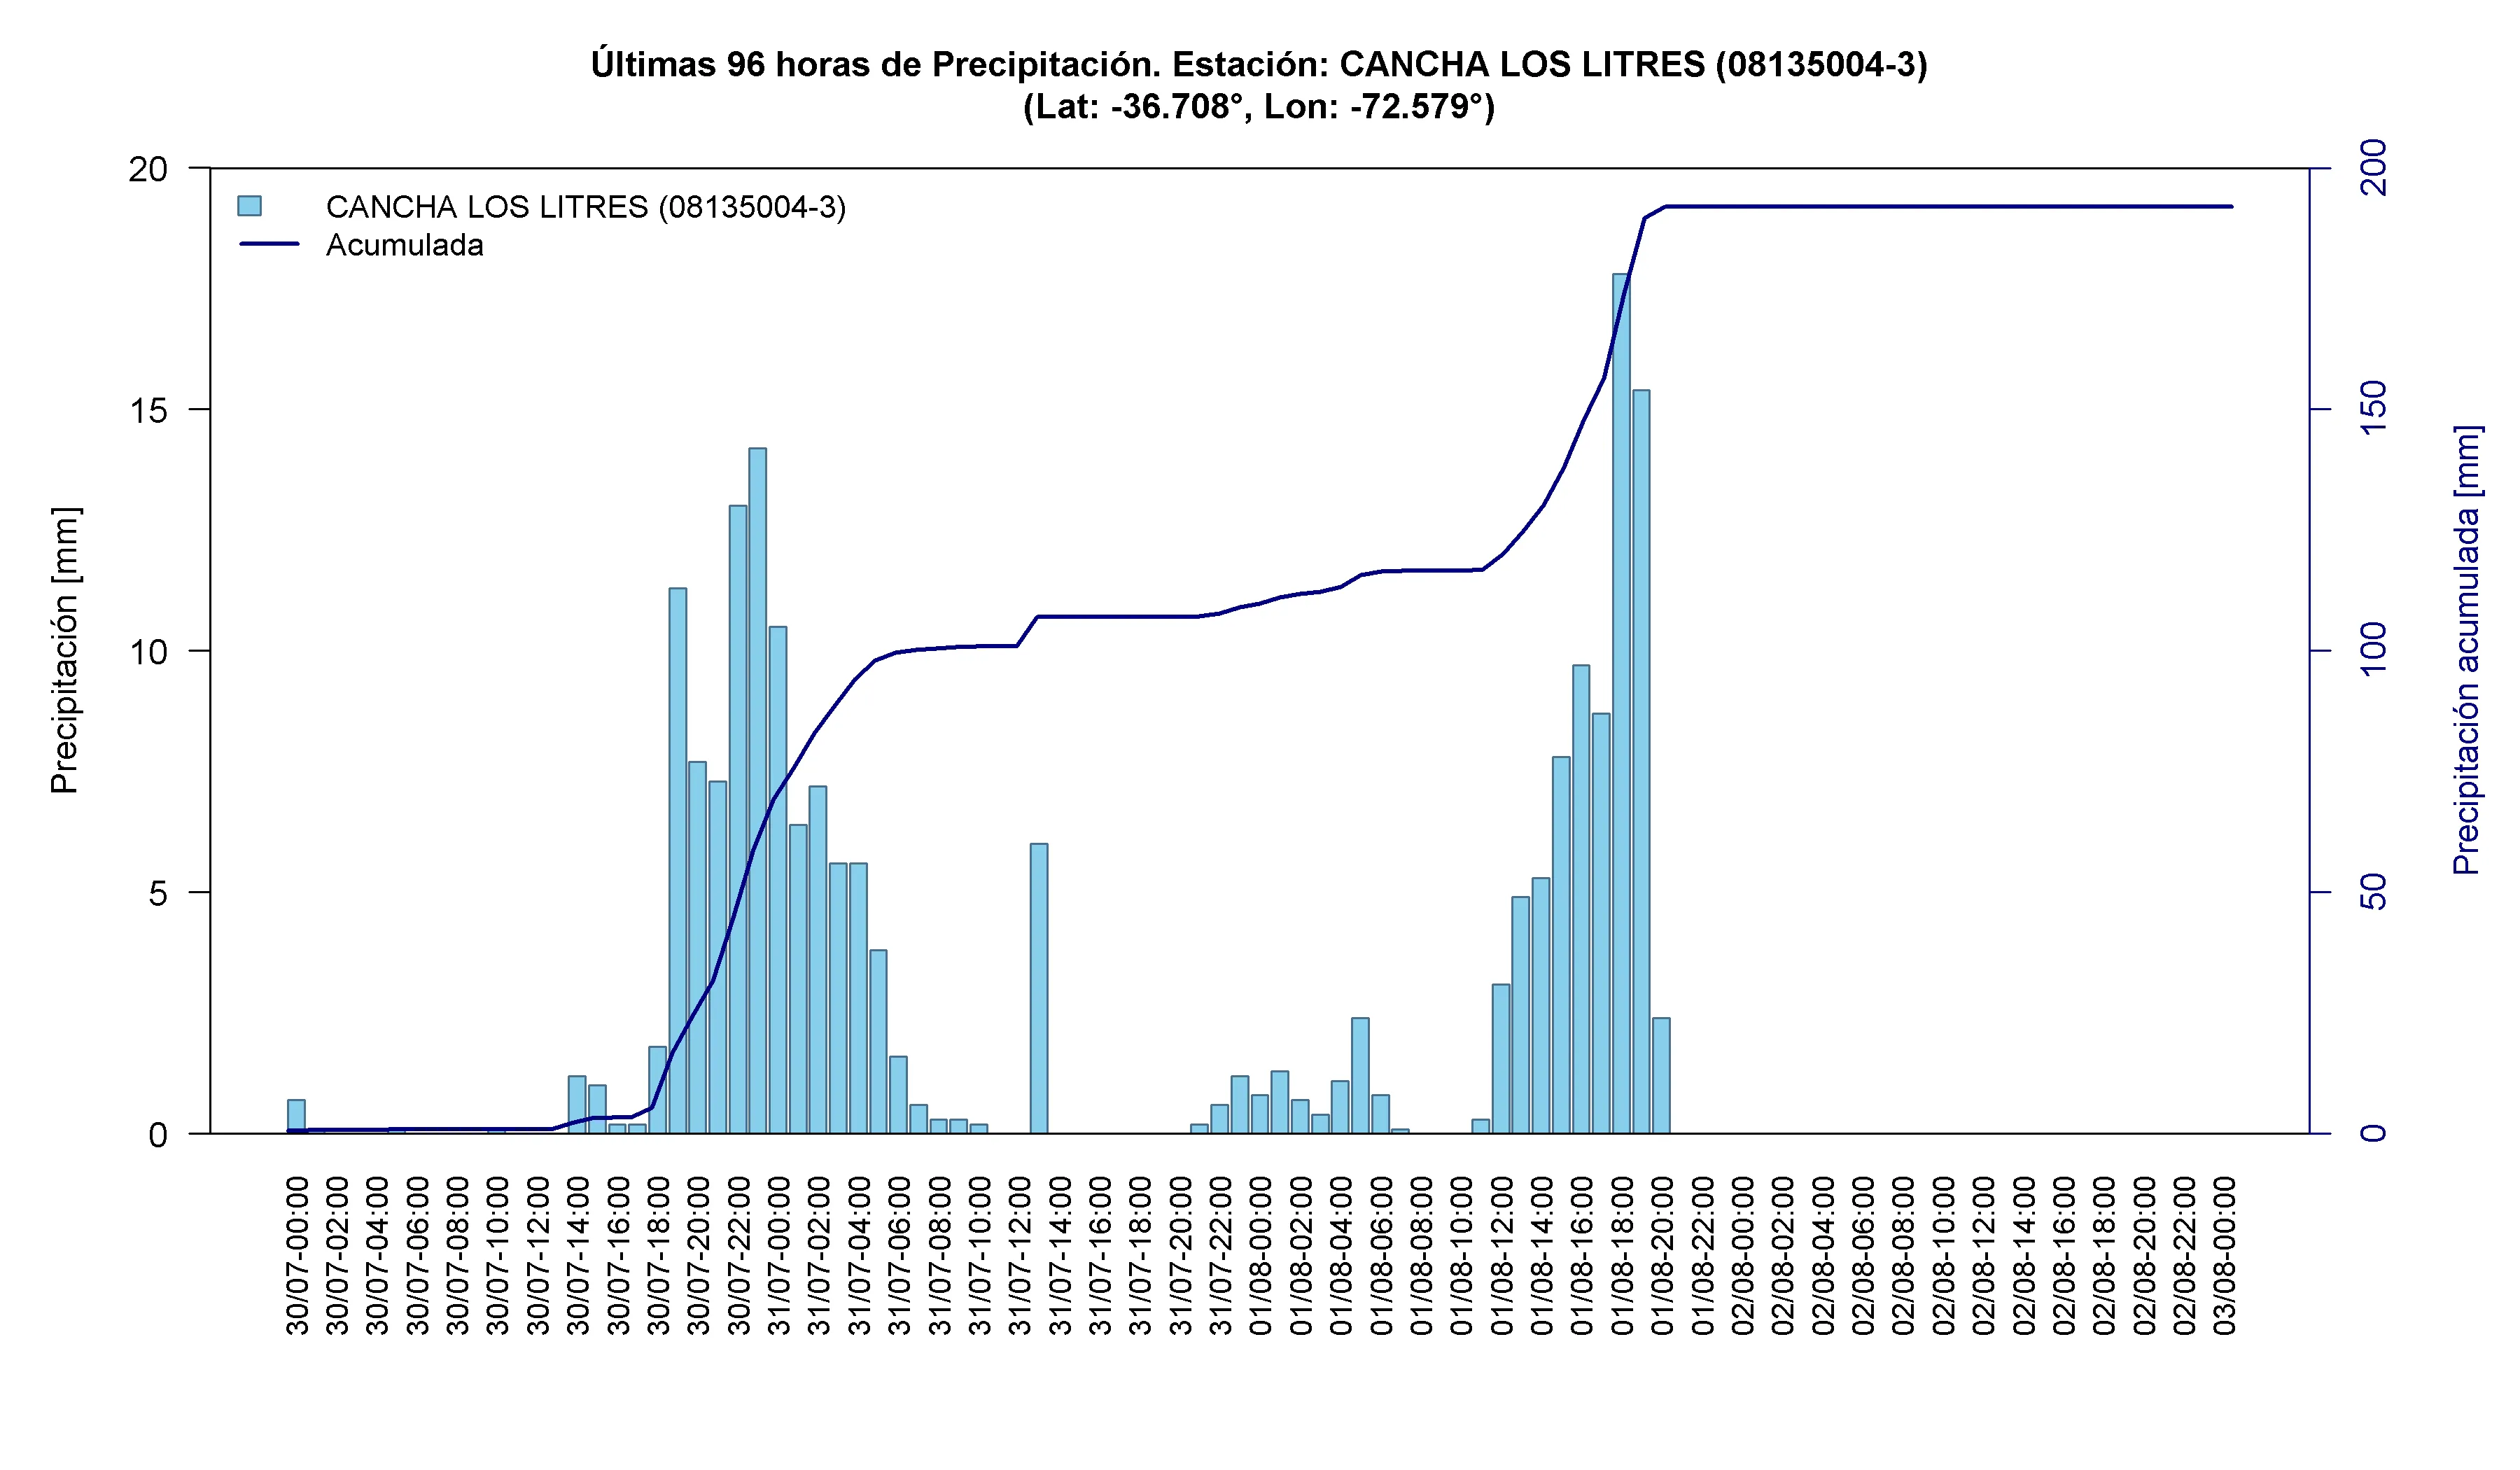
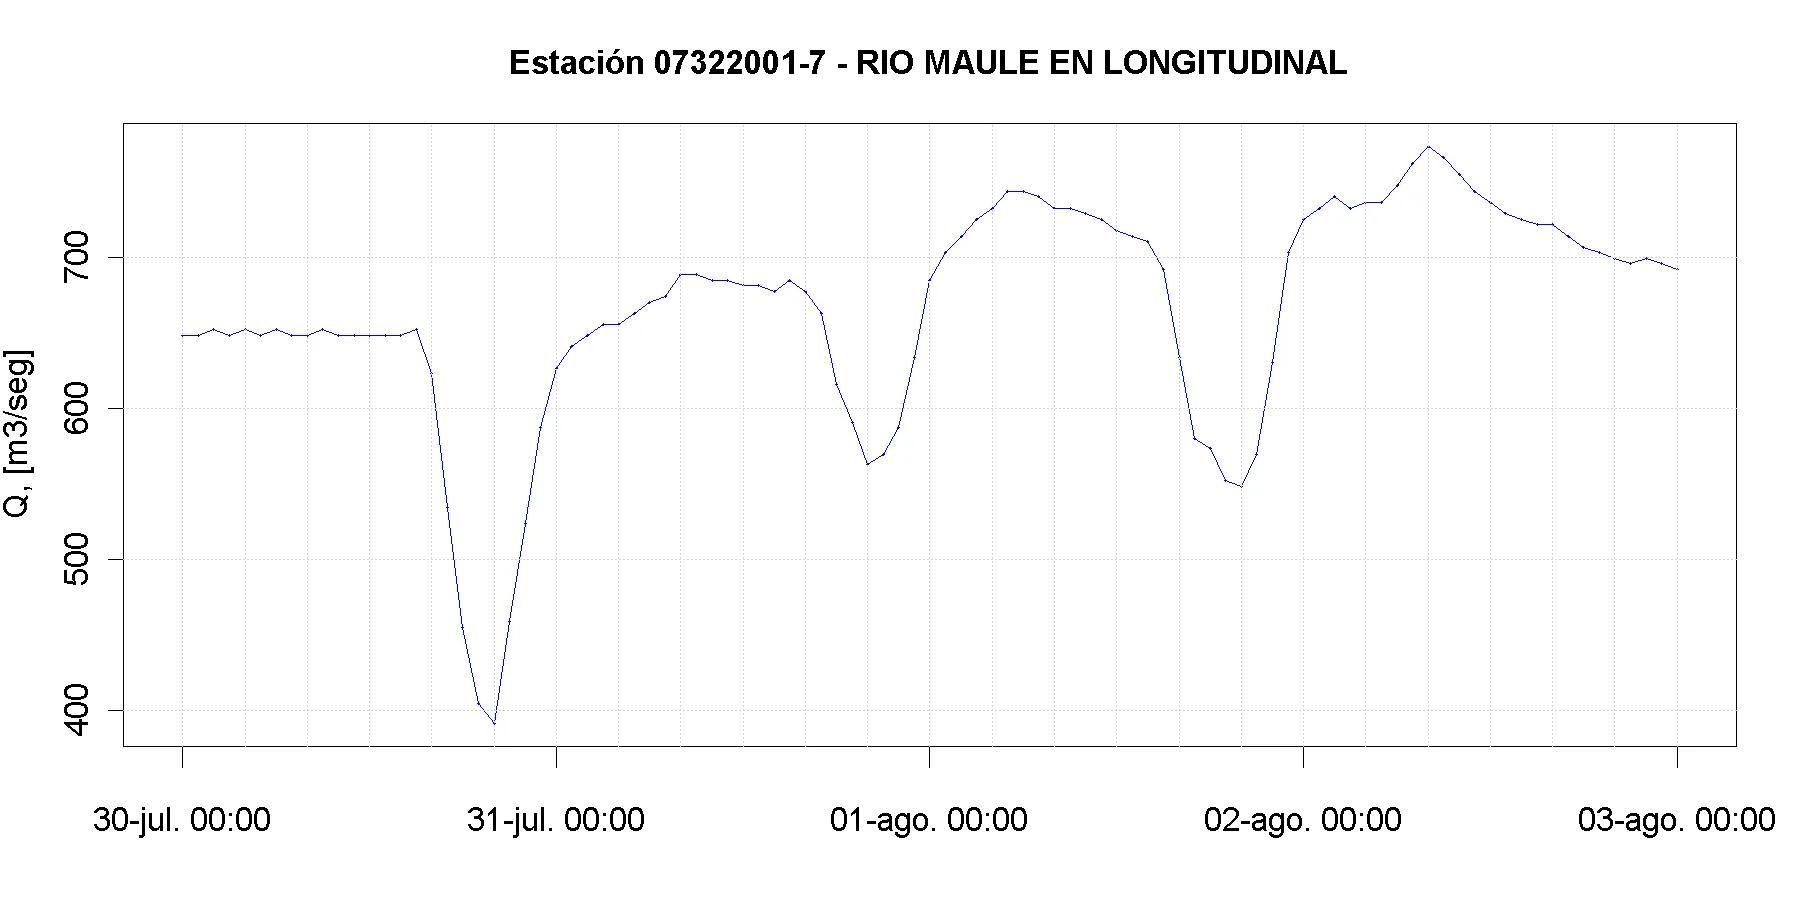
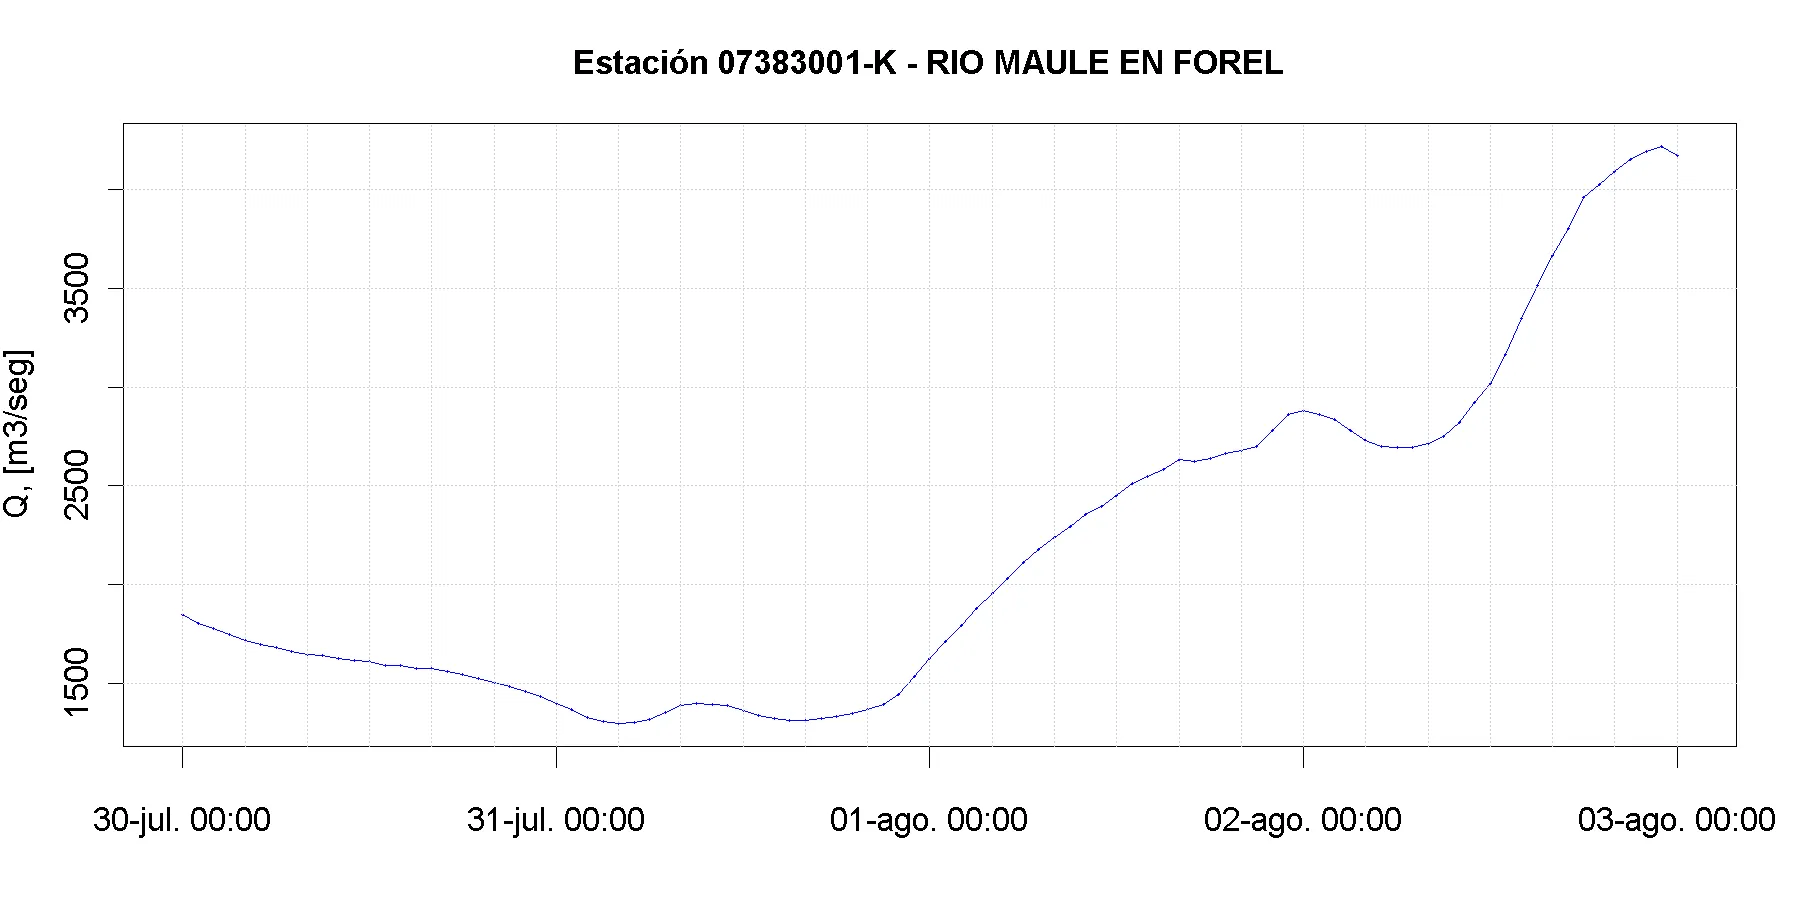
Nearby DGA stations and streamflow
What this event tells us about hydrometeorological risk
This frontal system was not dangerous only because of how much rain fell. The hydrological key was the sequence: the first pulse raised soil moisture and baseflows; the second pulse arrived when hillslopes, small channels and drainage networks had less capacity left to store or move water. Under those conditions, the same rainfall can generate faster and more damaging runoff.
- The double pulse reduced the response margin of catchments. Wet soils absorb less water and pass more of it into streams and rivers. A short break between rainfall bands does not necessarily mean the danger has passed.
- Intensity mattered as much as accumulation. Persistent rainfall becomes damaging when several hours concentrate enough water over roads, bridges, slopes and drainage systems that were already under pressure.
- Small catchments reacted first; larger rivers kept the risk active for longer. Urban streams and coastal channels responded quickly, while larger rivers such as the Itata, Biobío and Maule integrated rainfall over wider areas and maintained elevated flows after the meteorological peak.
- Hydrographs should be read in context. In regulated reaches of the Maule River, hourly oscillations reflect rainfall together with upstream infrastructure operation. In less regulated channels, sharp rises are a more direct signal of event runoff.
- La Araucanía concentrated the country’s isolation impact. More than 5,000 isolated people show how a rural road network exposed to washouts, landslides and small-channel rises can turn a hydrological emergency into a connectivity emergency.
- Wind and convection added hazards away from riverbanks. The Panguipulli deaths and warnings for tornado-like clouds and waterspouts show that frontal systems can also cause damage through falling trees, gusts and localized convective storms.
The core lesson is straightforward but demanding: risk depends not only on how many millimetres fall, but also on where they fall, over how many hours, on which catchments, with what antecedent wetness, and over which exposed communities and infrastructure.
Recommendations for exposed communities
With red and yellow alerts active during the critical stage of the event, prevention remained essential:
- Do not cross flooded roads, even when water looks shallow.
- Stay away from riverbanks, gullies and active streams, especially in areas under red or yellow alert.
- Avoid walking, driving or sheltering under large trees during strong wind.
- Follow official information from SENAPRED, the Chilean Meteorological Directorate, municipalities and regional authorities.
- Identify an alternative route if you live in a rural or pre-Andean sector with a history of road washouts.
- Use sandbags or other temporary barriers if your home is in a low-lying sector exposed to water entry.
- Evacuate early when there is an official instruction or evident local risk; do not wait for water to enter the home.
Extreme rainfall does not affect everyone equally. People living near rivers, gullies, steep slopes, underpasses and rural roads usually face the danger first.
[2]: Live coverage of the frontal system and military protection for evacuated homes - Cooperativa.cl
[3]: Frontal system leaves two people dead after a tree falls in Panguipulli - T13
[4]: Fire commander and partner mourned after Panguipulli tragedy - Diario El Día
[6]: Red Alert declared in Biobío due to overflow risk - Radio Maray
[7]: Regional Red Alert issued for overflow threat in Biobío - 24horas
[8]: SENAPRED warns of overflow risk in Biobío - La Tribuna
[9]: Biobío remains under Red Alert for possible overflows, tornadoes and storms - Sabes.cl
[10]: Frontal system impacts Ñuble - La Discusión
[11]: Frontal system worsens in Punilla - San Carlos Online
[12]: Eight routes cut in Ñuble - San Carlos Online
[13]: Classes suspended in Angol due to intense frontal system - El Periódico
[14]: Ministry of Education announces class suspensions due to frontal system - La Tercera
[15]: Communes that suspended classes for Monday 3 August - T13
[16]: Frontal system: affected people, isolated people, river overflows and affected routes - The Clinic
[17]: Road closures, flooding and overflows between O'Higgins and Los Lagos - La Tercera
[18]: Weather warning for storms, gusts and possible tornado formation - T13
[19]: Alert for possible tornadoes and waterspouts - La Hora
[20]: Maritime authority issues warning for waterspouts in La Araucanía - Temuco Ya!
[21]: SENAPRED declares Red Alert in Maule - 24horas
[22]: SENAPRED maintains Yellow Alert for communes in Ñuble - VLN Radio
[23]: SENAPRED declares Red Alert for Linares, Villa Alegre and San Javier - VLN Radio
[24]: SENAPRED declares Red Alert for Cauquenes and Parral - VLN Radio
[25]: SENAPRED declares Red Alert for Maule due to river overflows - BioBioChile