
Between 15 and 20 July 2026, Chile experienced a meteorological sequence that was unusual in its spatial extent, persistence and geographical progression. Several frontal systems, reinforced by atmospheric rivers, brought rainfall from Los Lagos to Atacama. The maximum did not remain stationary: it began in south-central Chile, reached the central regions on 17 July, and finally concentrated over Coquimbo and southern Atacama during the weekend.
Records from the VisMet meteorological viewer of the Center for Climate Science and Resilience reveal this northward progression. At the analysed gauges, event totals exceeded 250 mm in Coquimbo, Valparaíso and the Santiago Metropolitan Region. Risk, however, was not controlled by the total alone. Hourly intensity, concentration within one or two days, repeated pulses over wet soils, and the exposure of cities, roads, ephemeral channels and drinking-water systems were equally important.
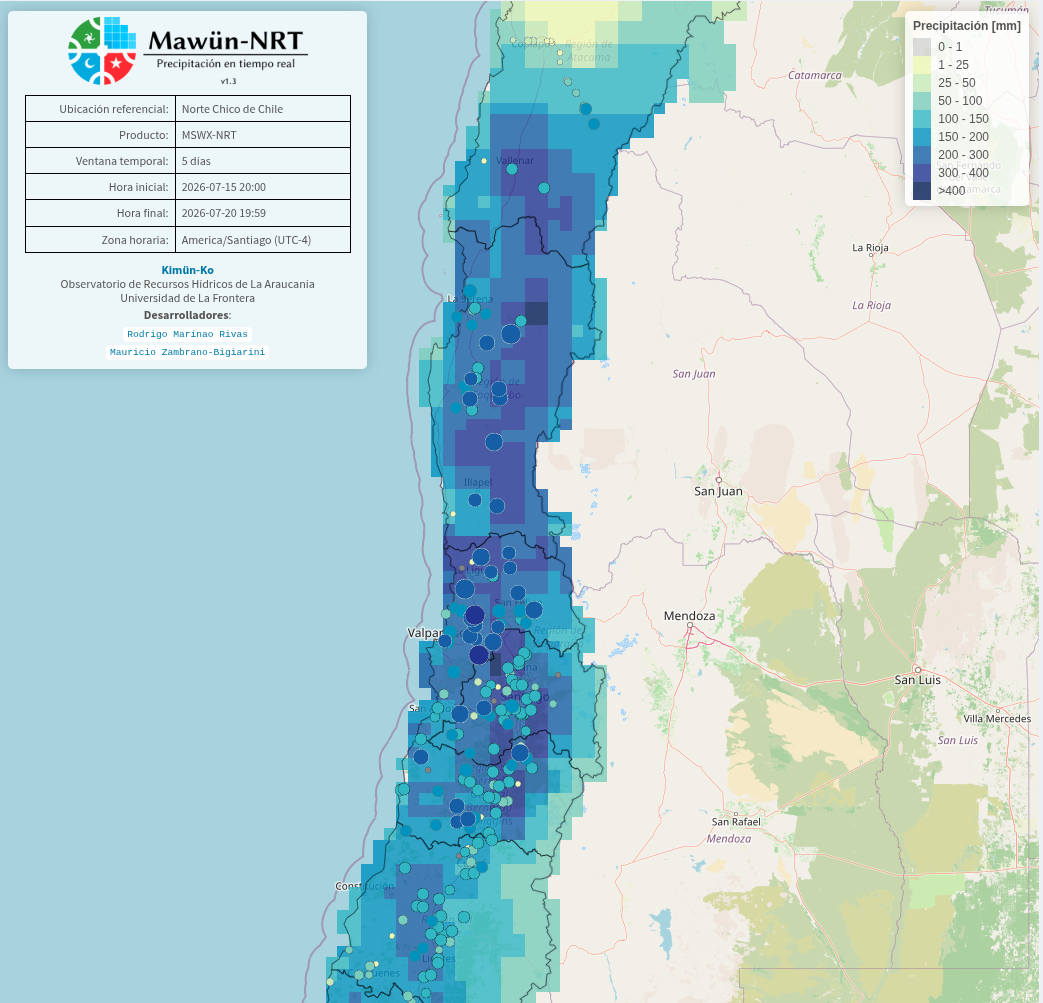
This article summarises the national evolution of the event, presents regional observations for 15-19 July, and uses as its cover image a spatial synthesis of accumulated precipitation for the five-day window from 15 to 20 July. Impact figures are updated with the Senapred balance reported by CNN Chile on 23 July 2026 ¹⁰ .
A nationwide event, but not a simultaneous one
The Senapred balance reported by CNN Chile listed 13 fatalities and 18 missing people. It also recorded 18,254 disaster-affected people, more than 1,700 people in shelters and 45,108 isolated people because of road closures, river overflows and activated ephemeral channels. Housing impacts included 1,679 destroyed homes, 8,492 with major damage, 34,741 with minor damage and 552 still under evaluation ¹⁰ .
The cited balance does not provide a monetary economic-damage figure, so this article does not report an official economic-loss total for the episode ¹⁰ . Coquimbo and Atacama appear as the main focus of the most severe social impacts: the 18 missing people were distributed between Coquimbo and Atacama, and isolated people were concentrated mostly in both regions ¹⁰ .
The sequence had three main hydrometeorological characteristics. First, it covered an exceptional latitudinal range, with substantial rainfall over more than 1,500 km. Secondly, the rainfall maximum migrated from south-central Chile towards the north. Thirdly, the dominant damage mechanism differed among regions: short and very intense bursts in central Chile, persistent rainfall in Coquimbo, and repeated pulses in Ñuble and Biobío.
How the rainfall maximum moved northwards
During the first half of the period, the largest totals were concentrated between La Araucanía and Ñuble. On 17 July, the most intense rainband reached Valparaíso, the Santiago Metropolitan Region and O’Higgins. During 18-19 July, the main focus shifted to Coquimbo and Atacama, where rainfall activated ephemeral channels, increased river flows, and aggravated transport and drinking-water disruptions.
This progression is essential for interpreting the observations: comparisons based only on regional totals conceal the fact that each territory experienced its maximum at a different time and under different antecedent conditions.
Atacama Region
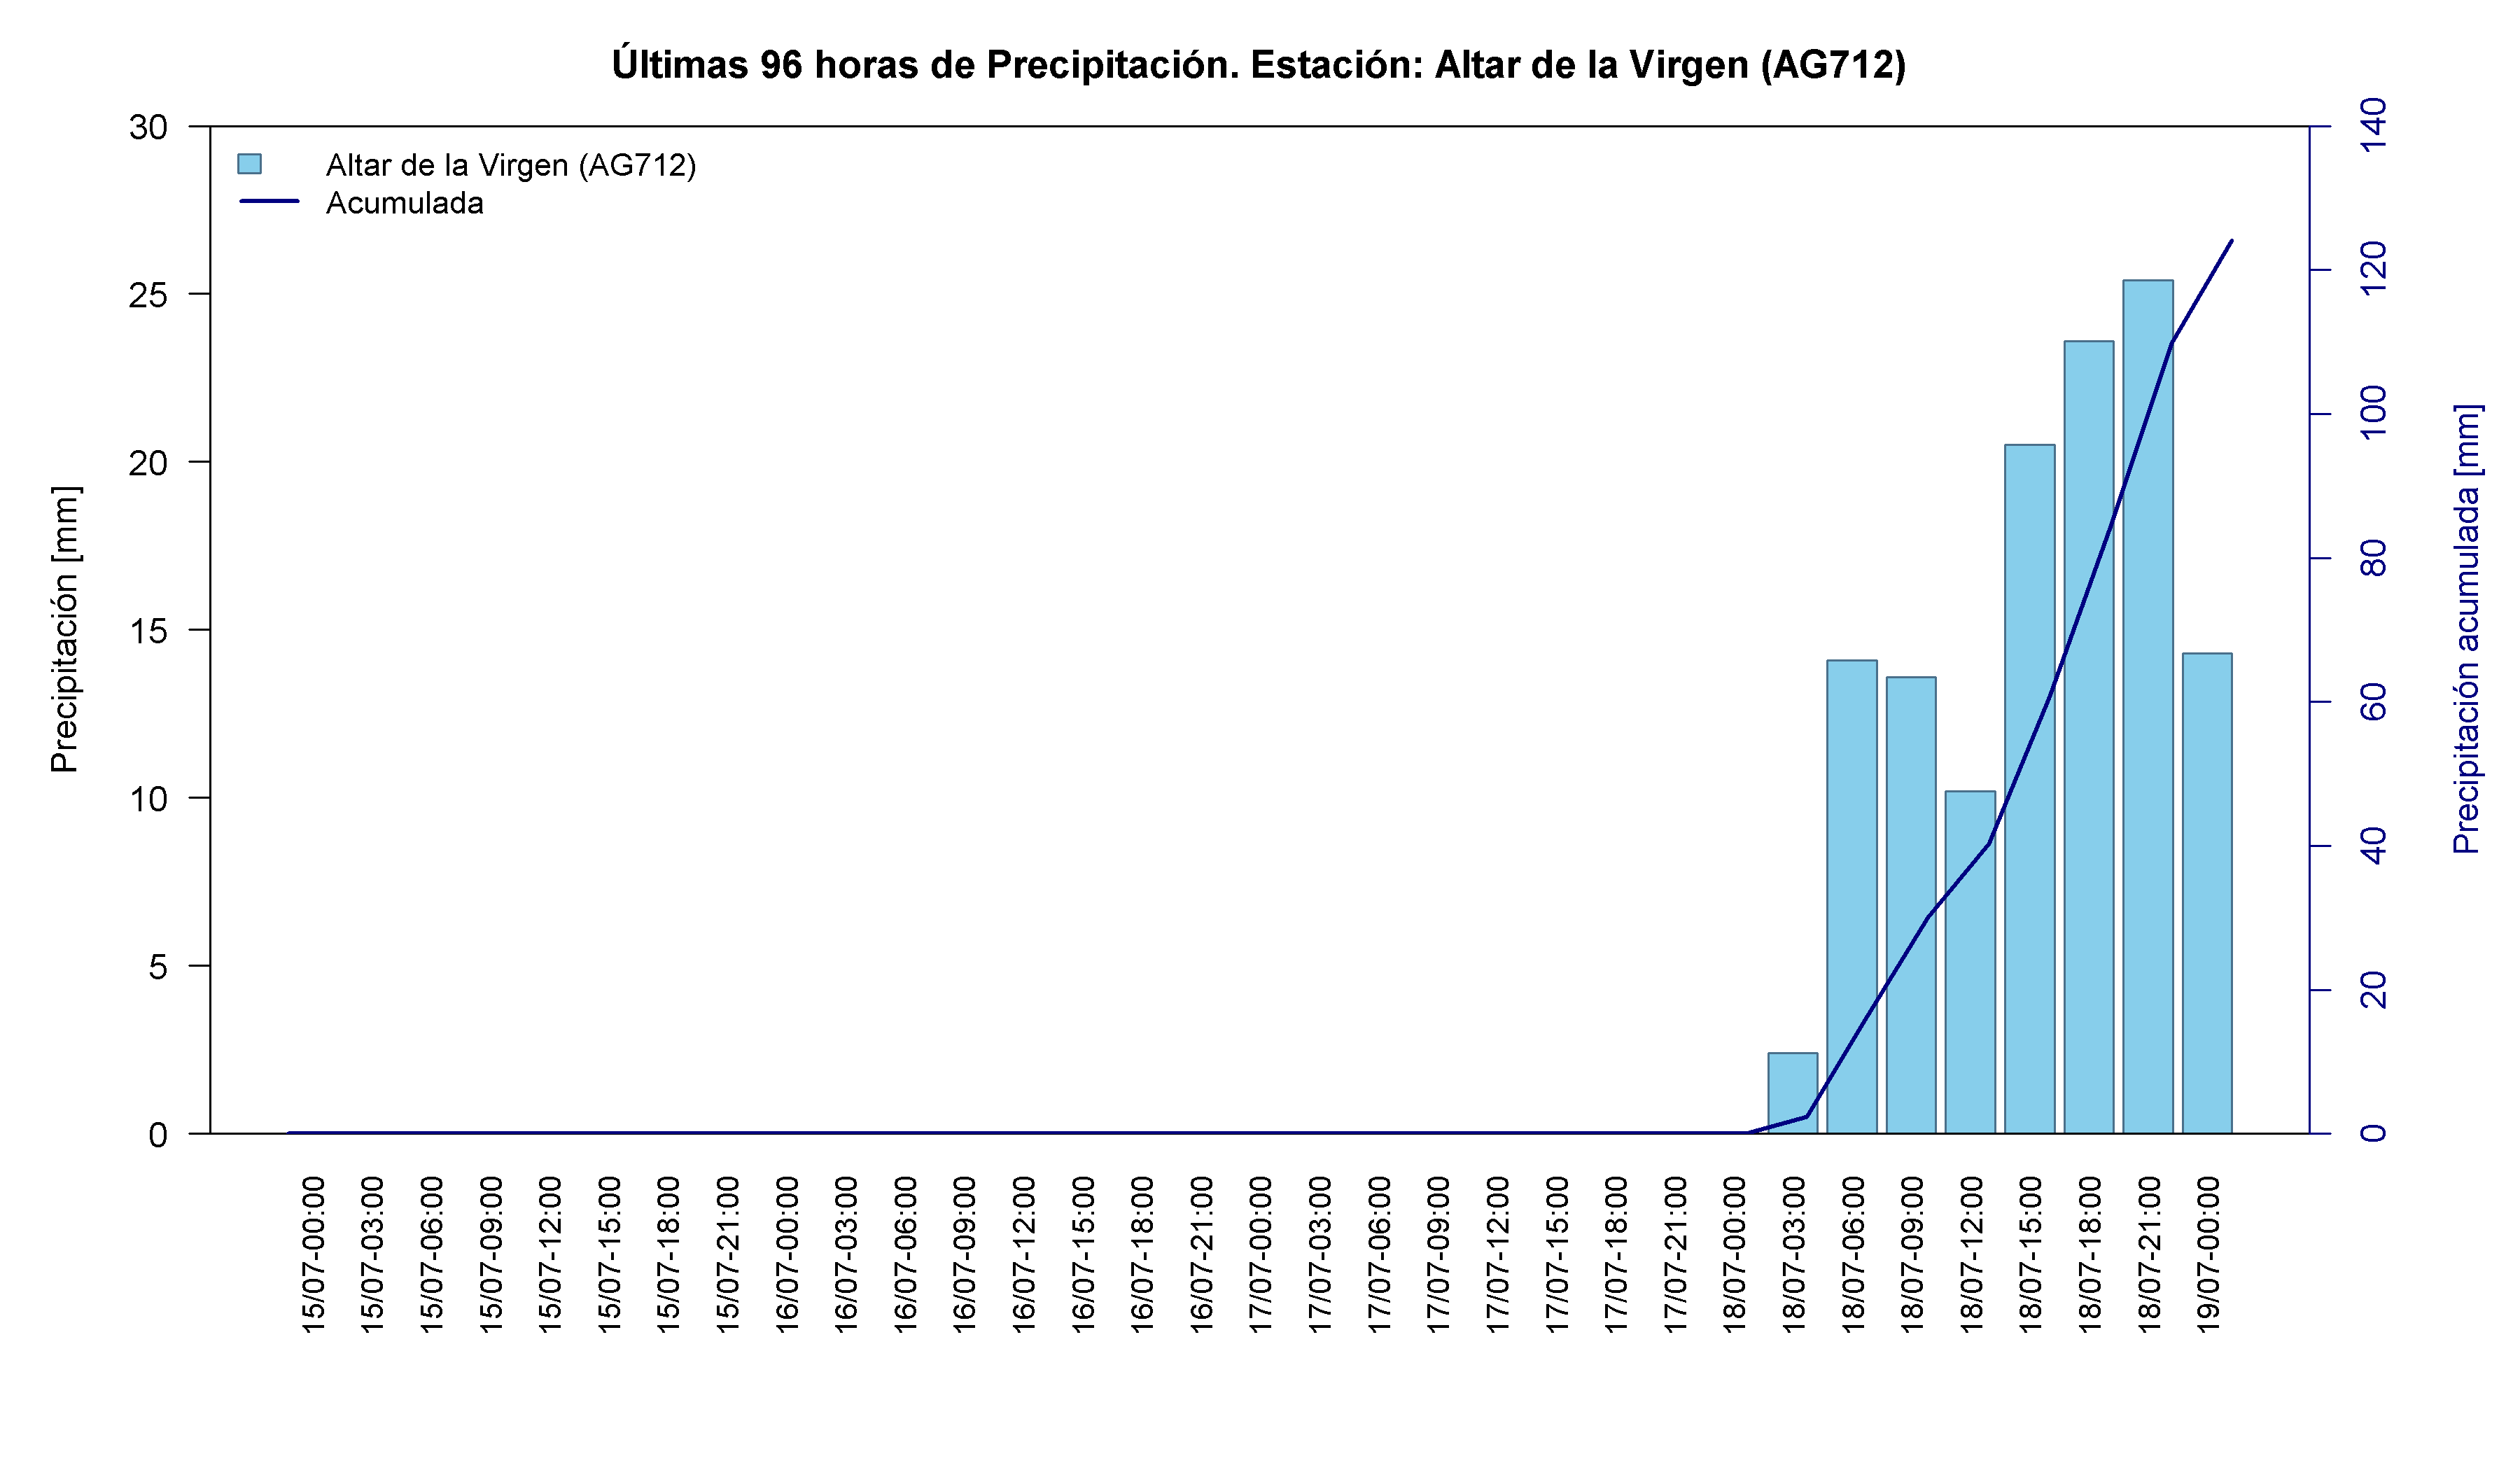
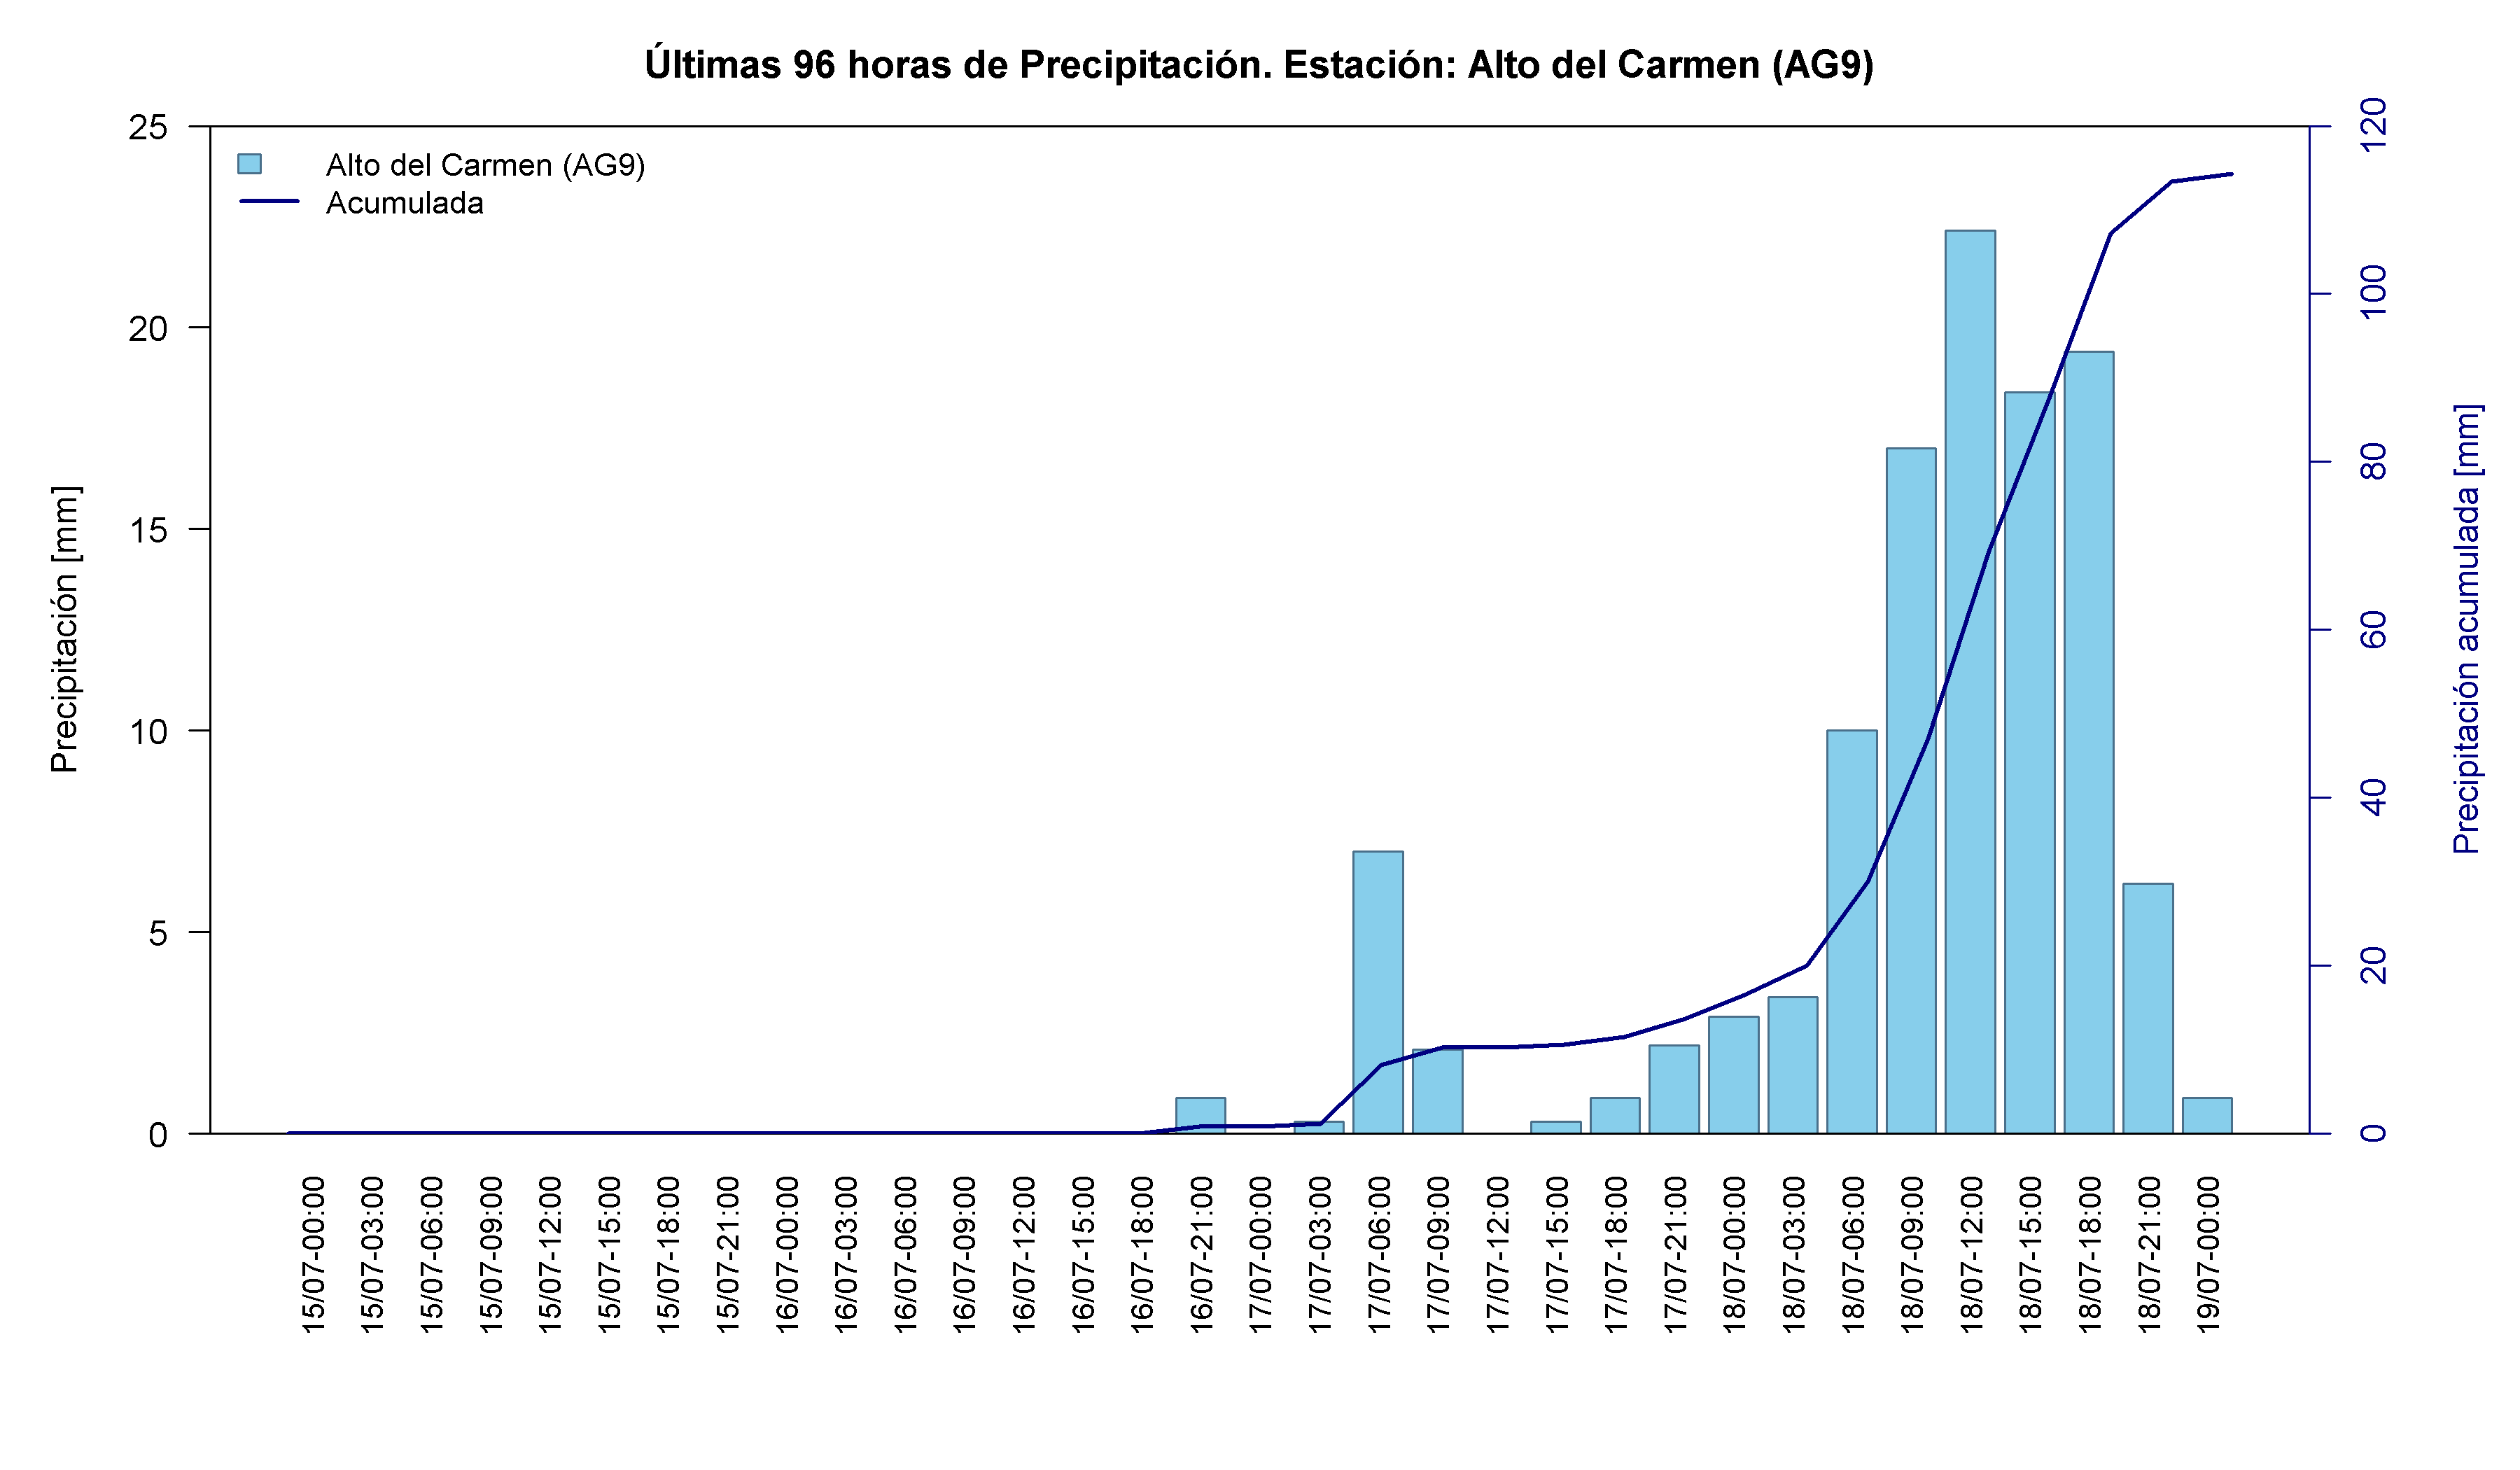
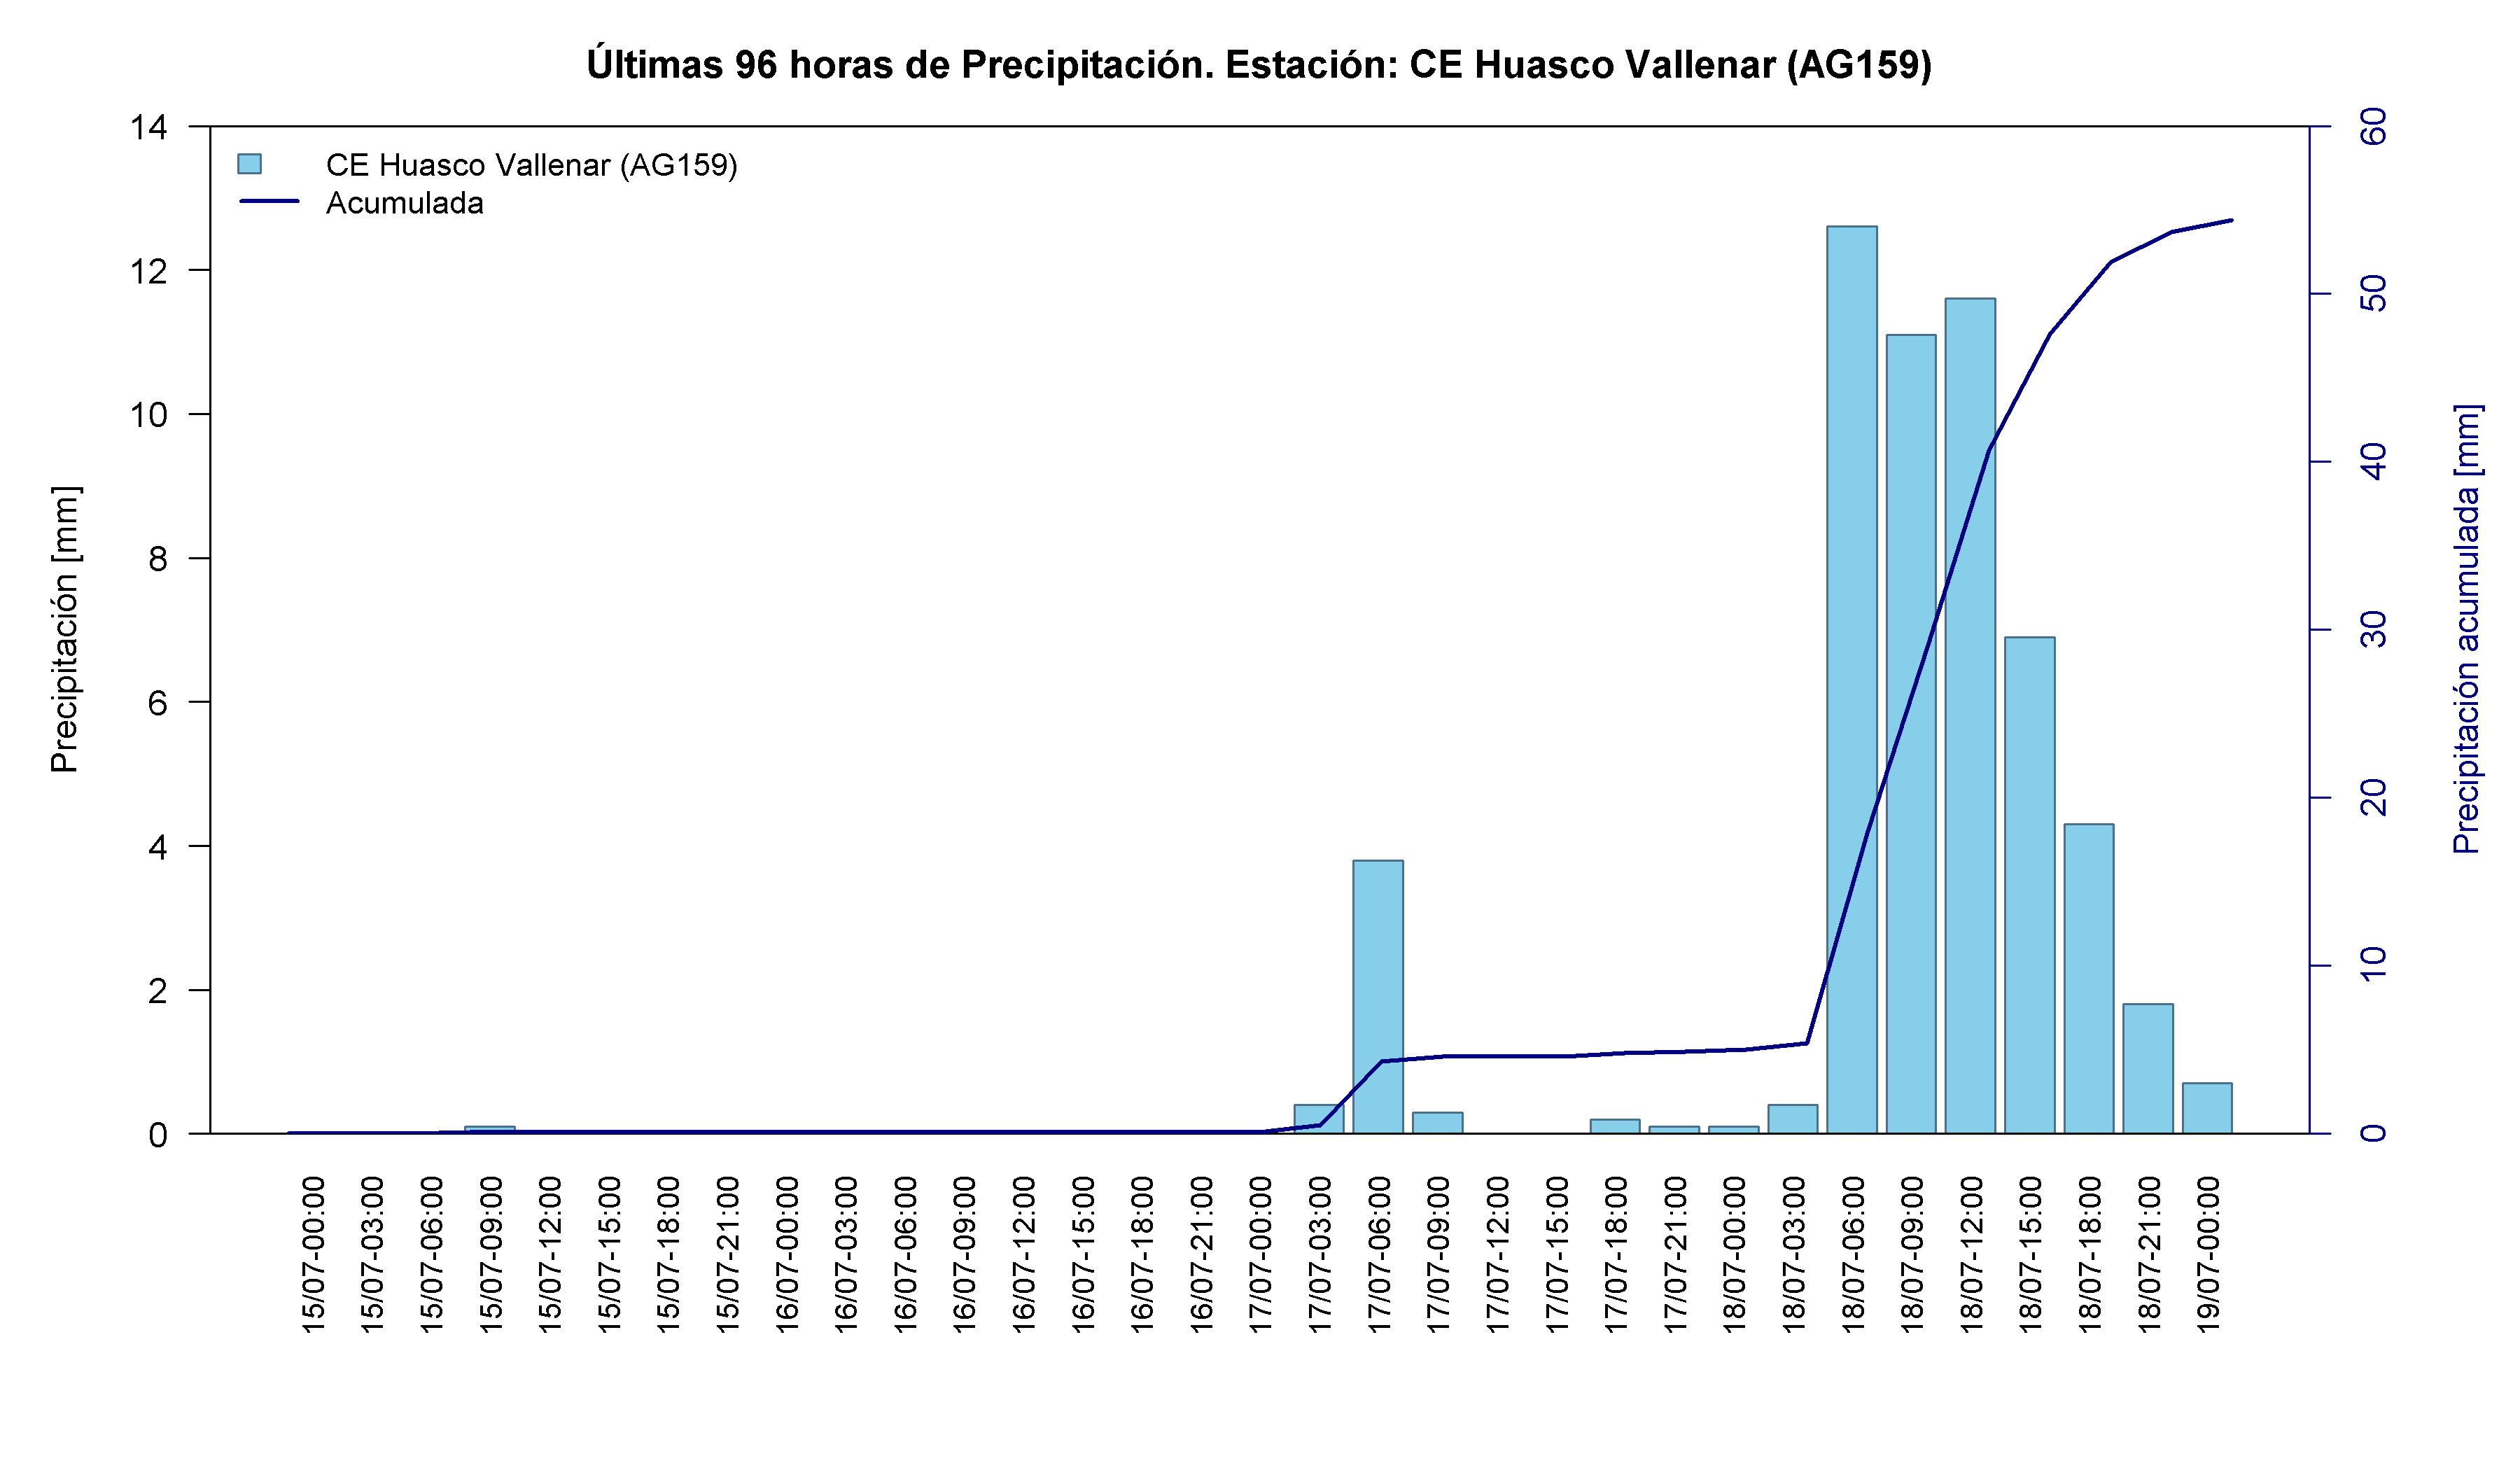
Atacama experienced the final and northernmost phase of the event. Huasco Province and Tierra Amarilla remained under red alert because of rising rivers, activated ephemeral channels and landslide risk. The Senapred balance reported by CNN Chile indicated that 7 of the 18 missing-person reports corresponded to Atacama, while isolated people were concentrated mainly between Atacama and Coquimbo ¹⁰ . The selected gauges show that the maximum shifted to 18-19 July: Altar de la Virgen recorded 159.6 mm and Alto del Carmen 133.3 mm, exceptional totals for an arid region highly sensitive to intense rainfall.
Time series and interactive elements
Map 1. Location of the rain gauges analysed in the Atacama Region during the frontal-system event of 15-19 July 2026. Source: Authors’ analysis based on data from the VisMet meteorological viewer .
Table 1. Accumulated precipitation recorded at rain gauges in the Atacama Region between 15 and 19 July 2026. Source: Authors’ analysis based on data from the VisMet meteorological viewer .

Coquimbo Region
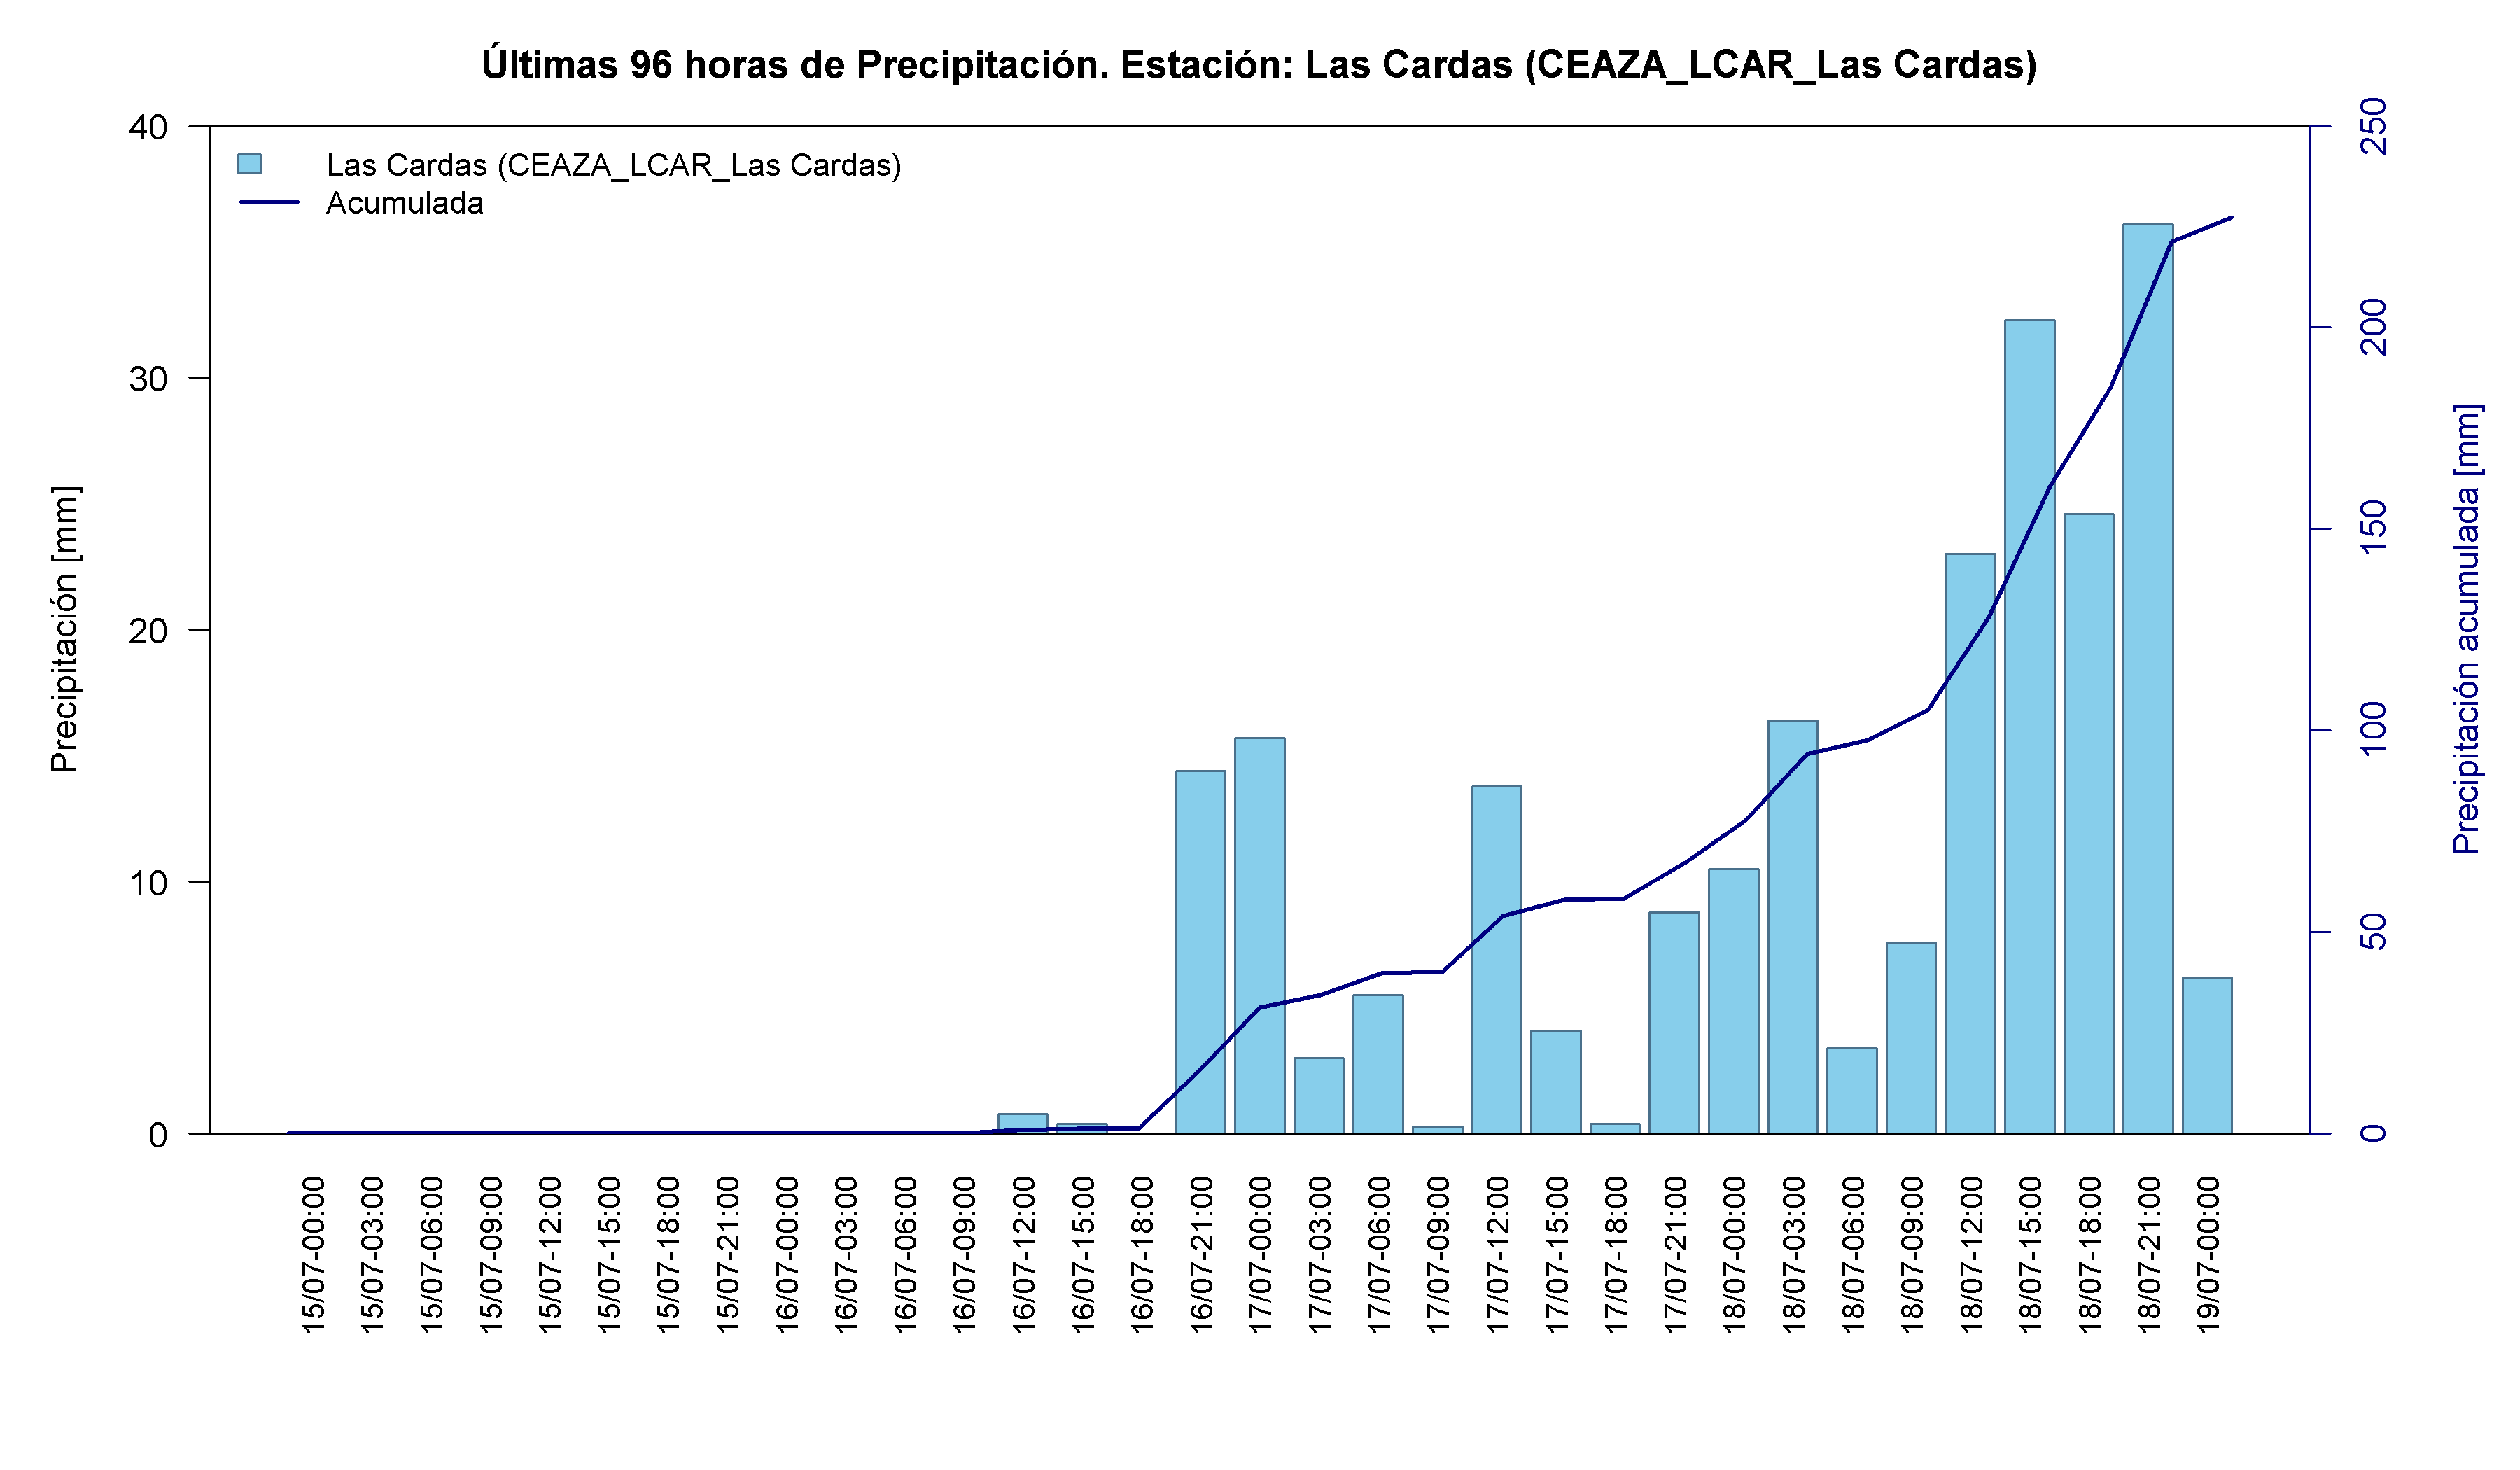
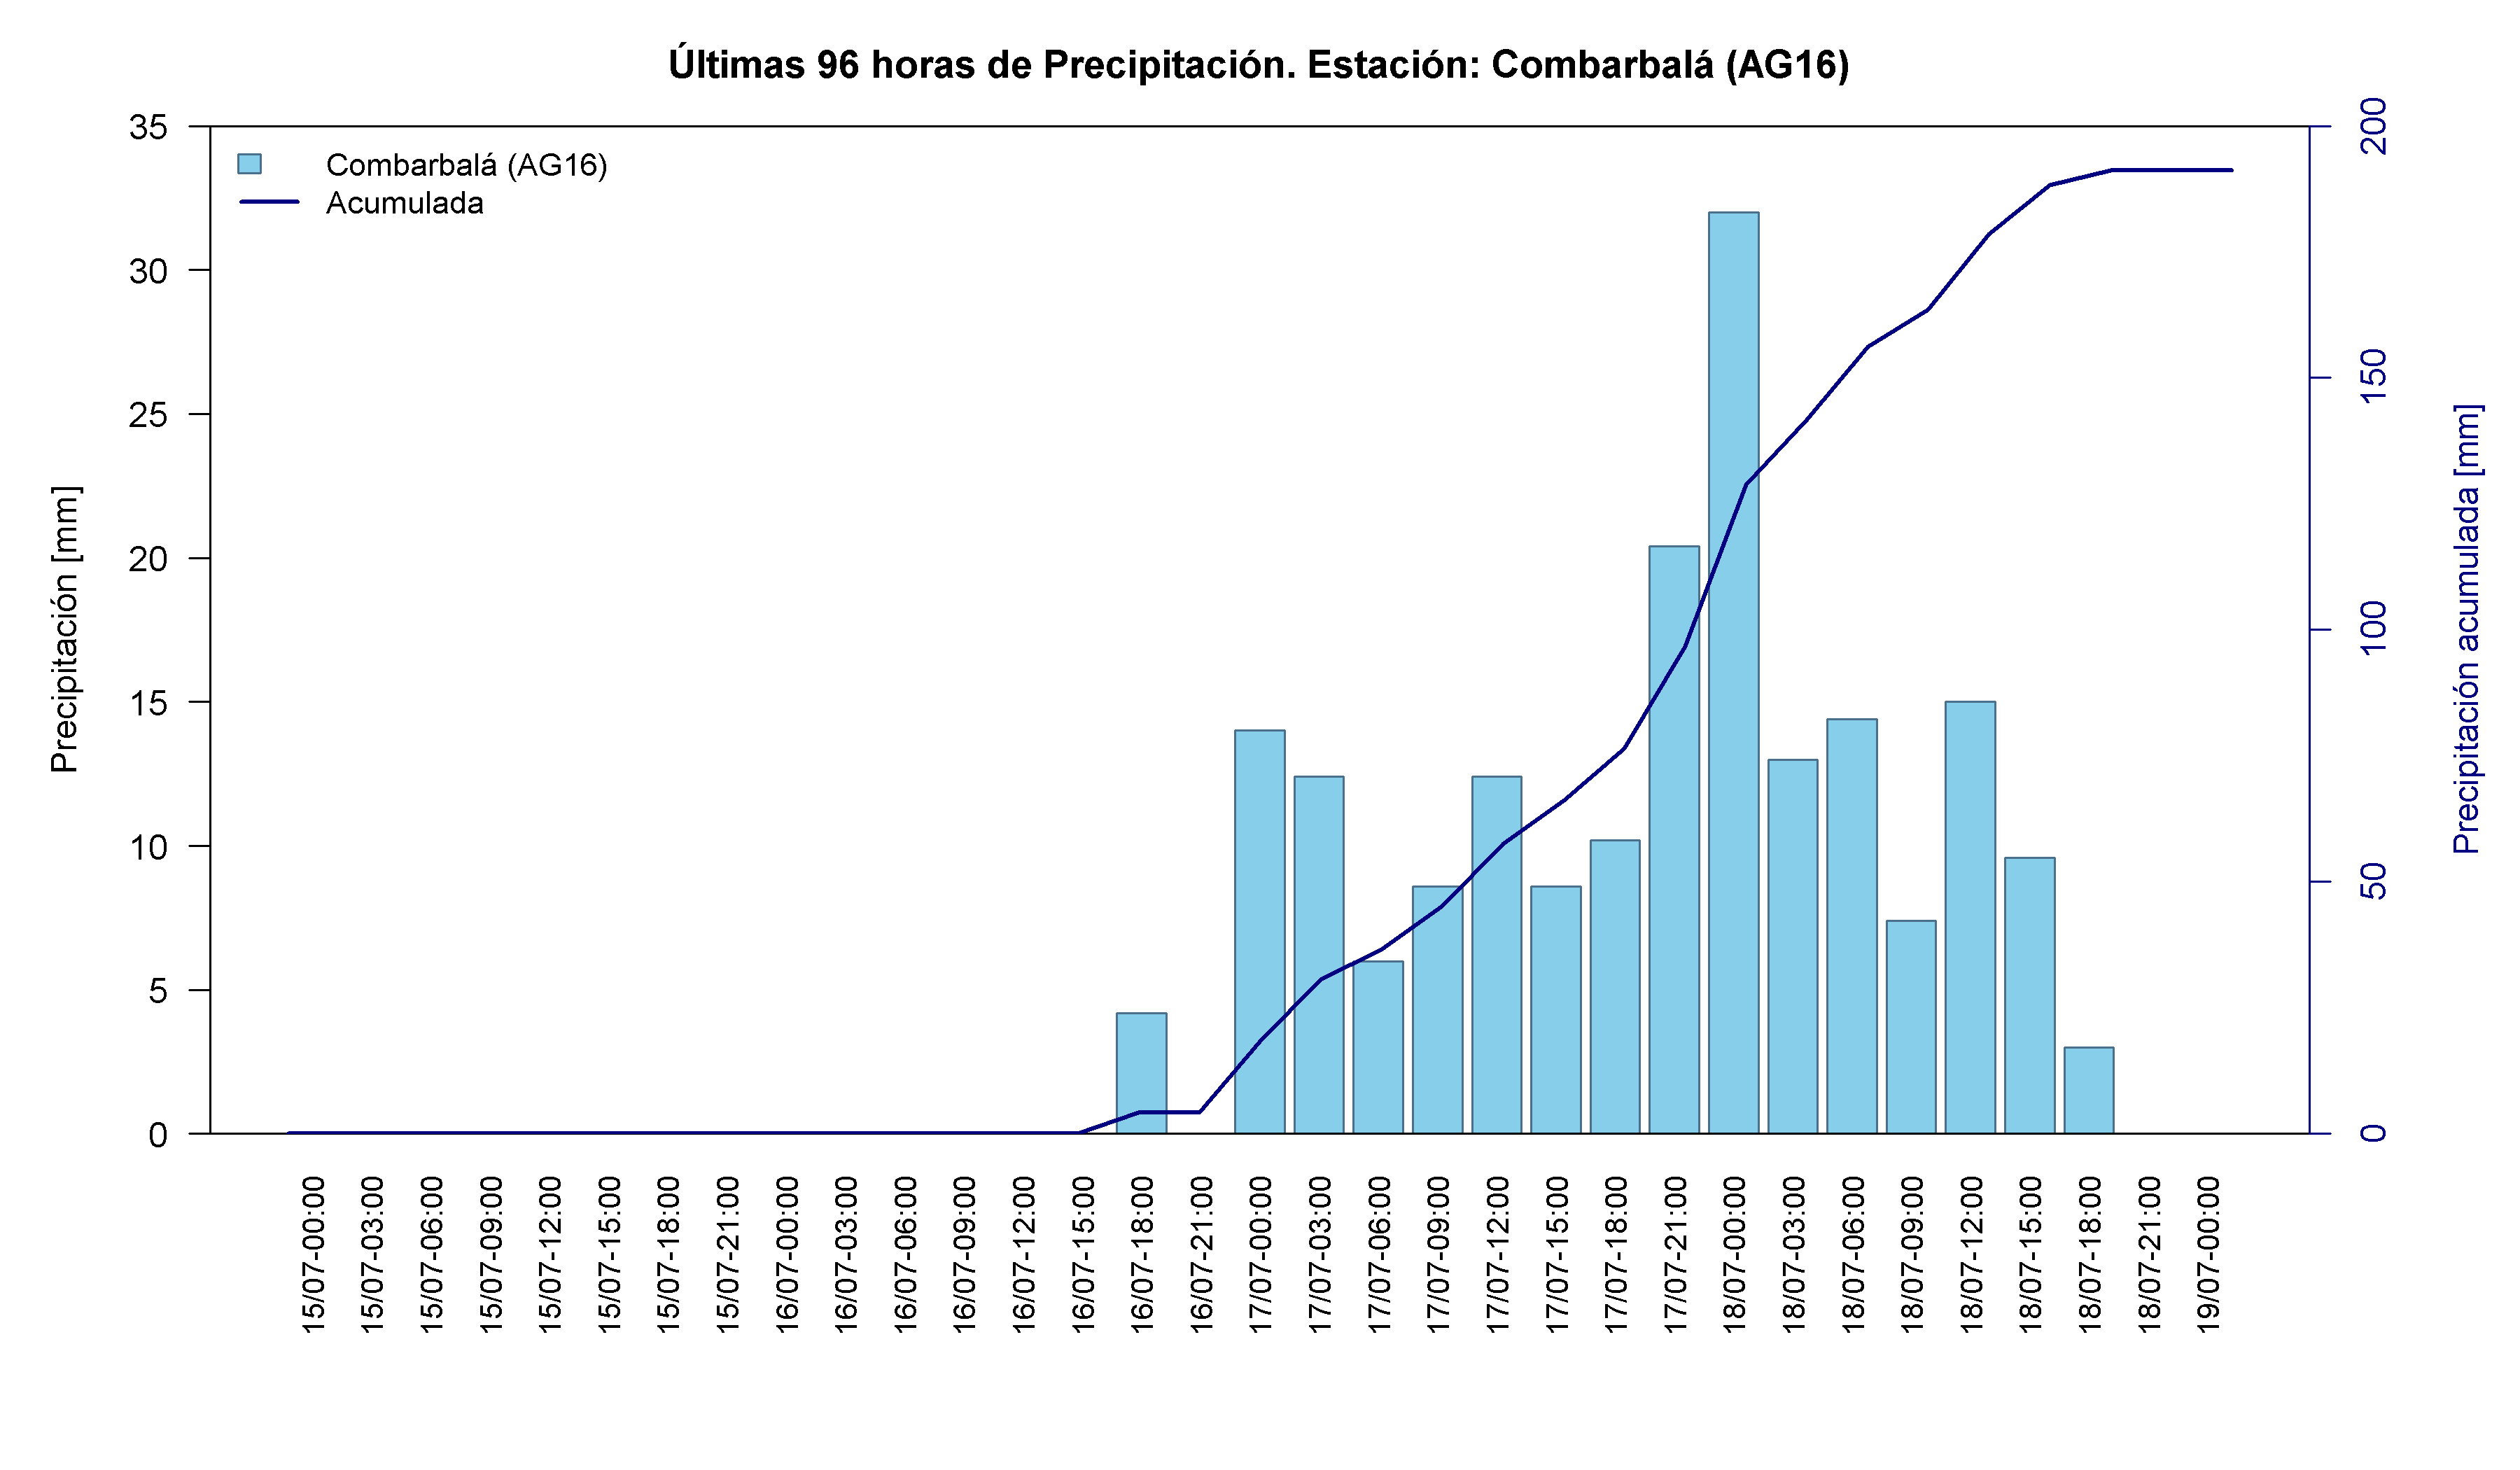
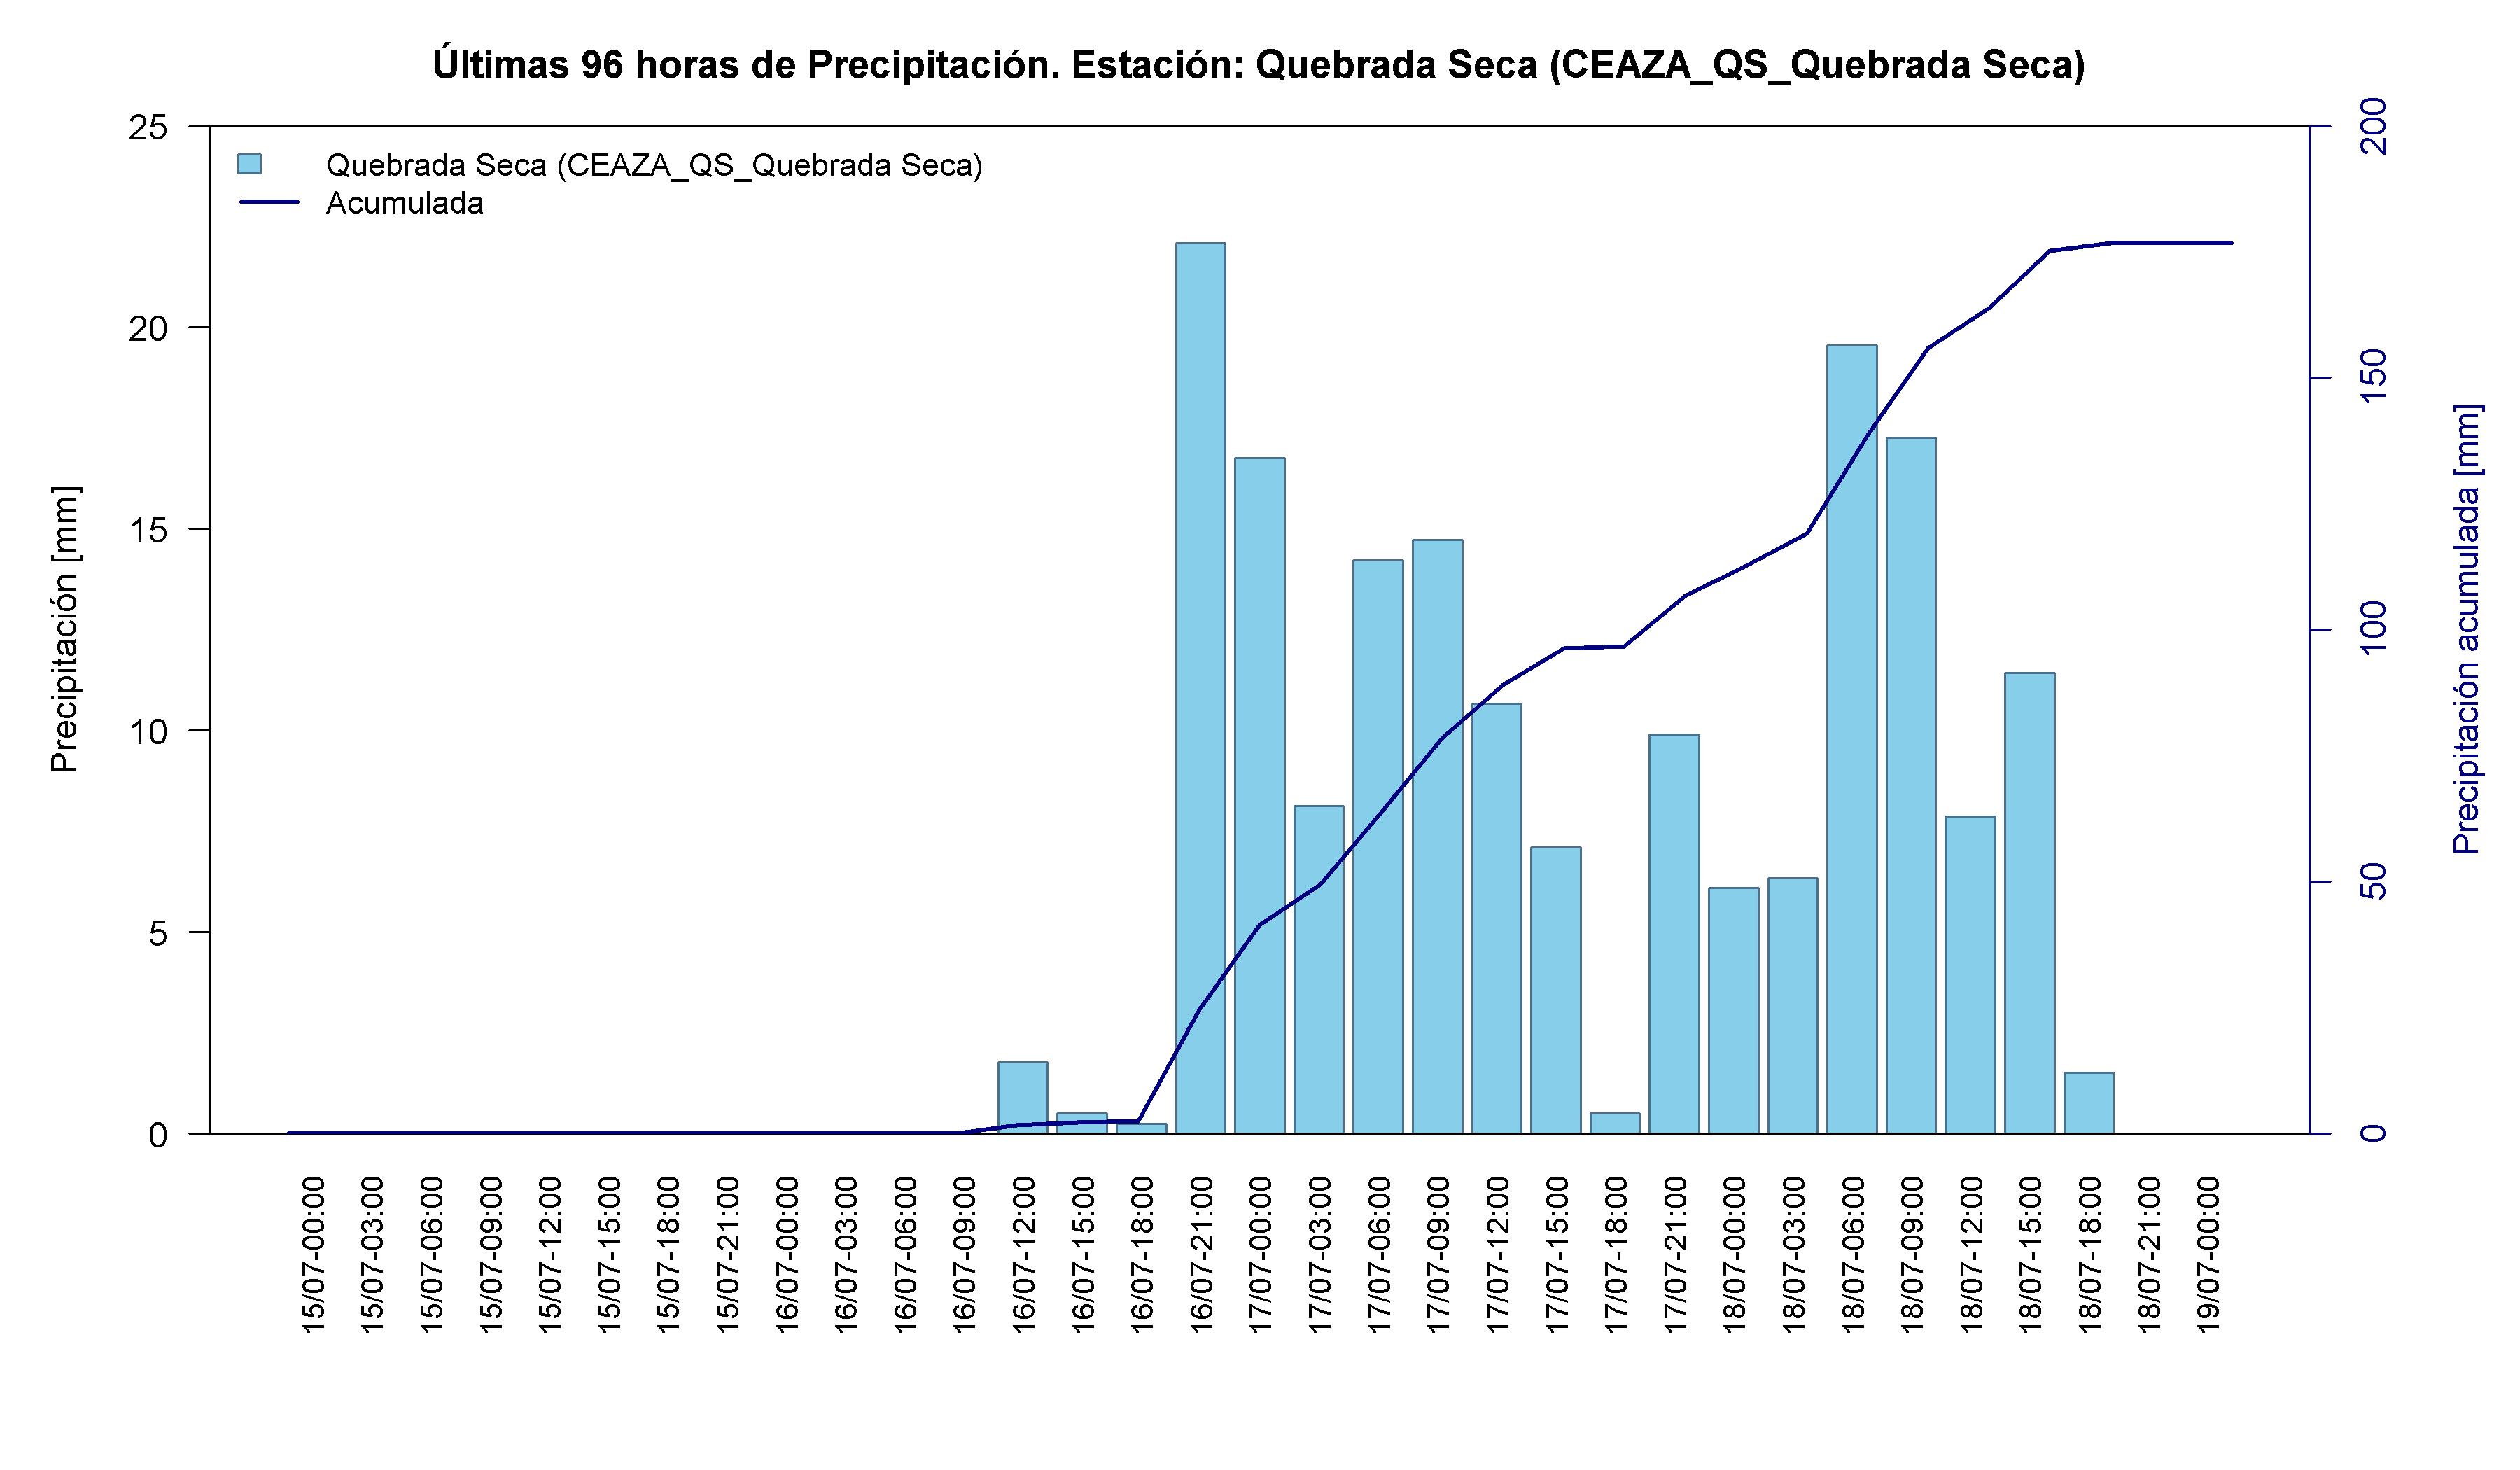
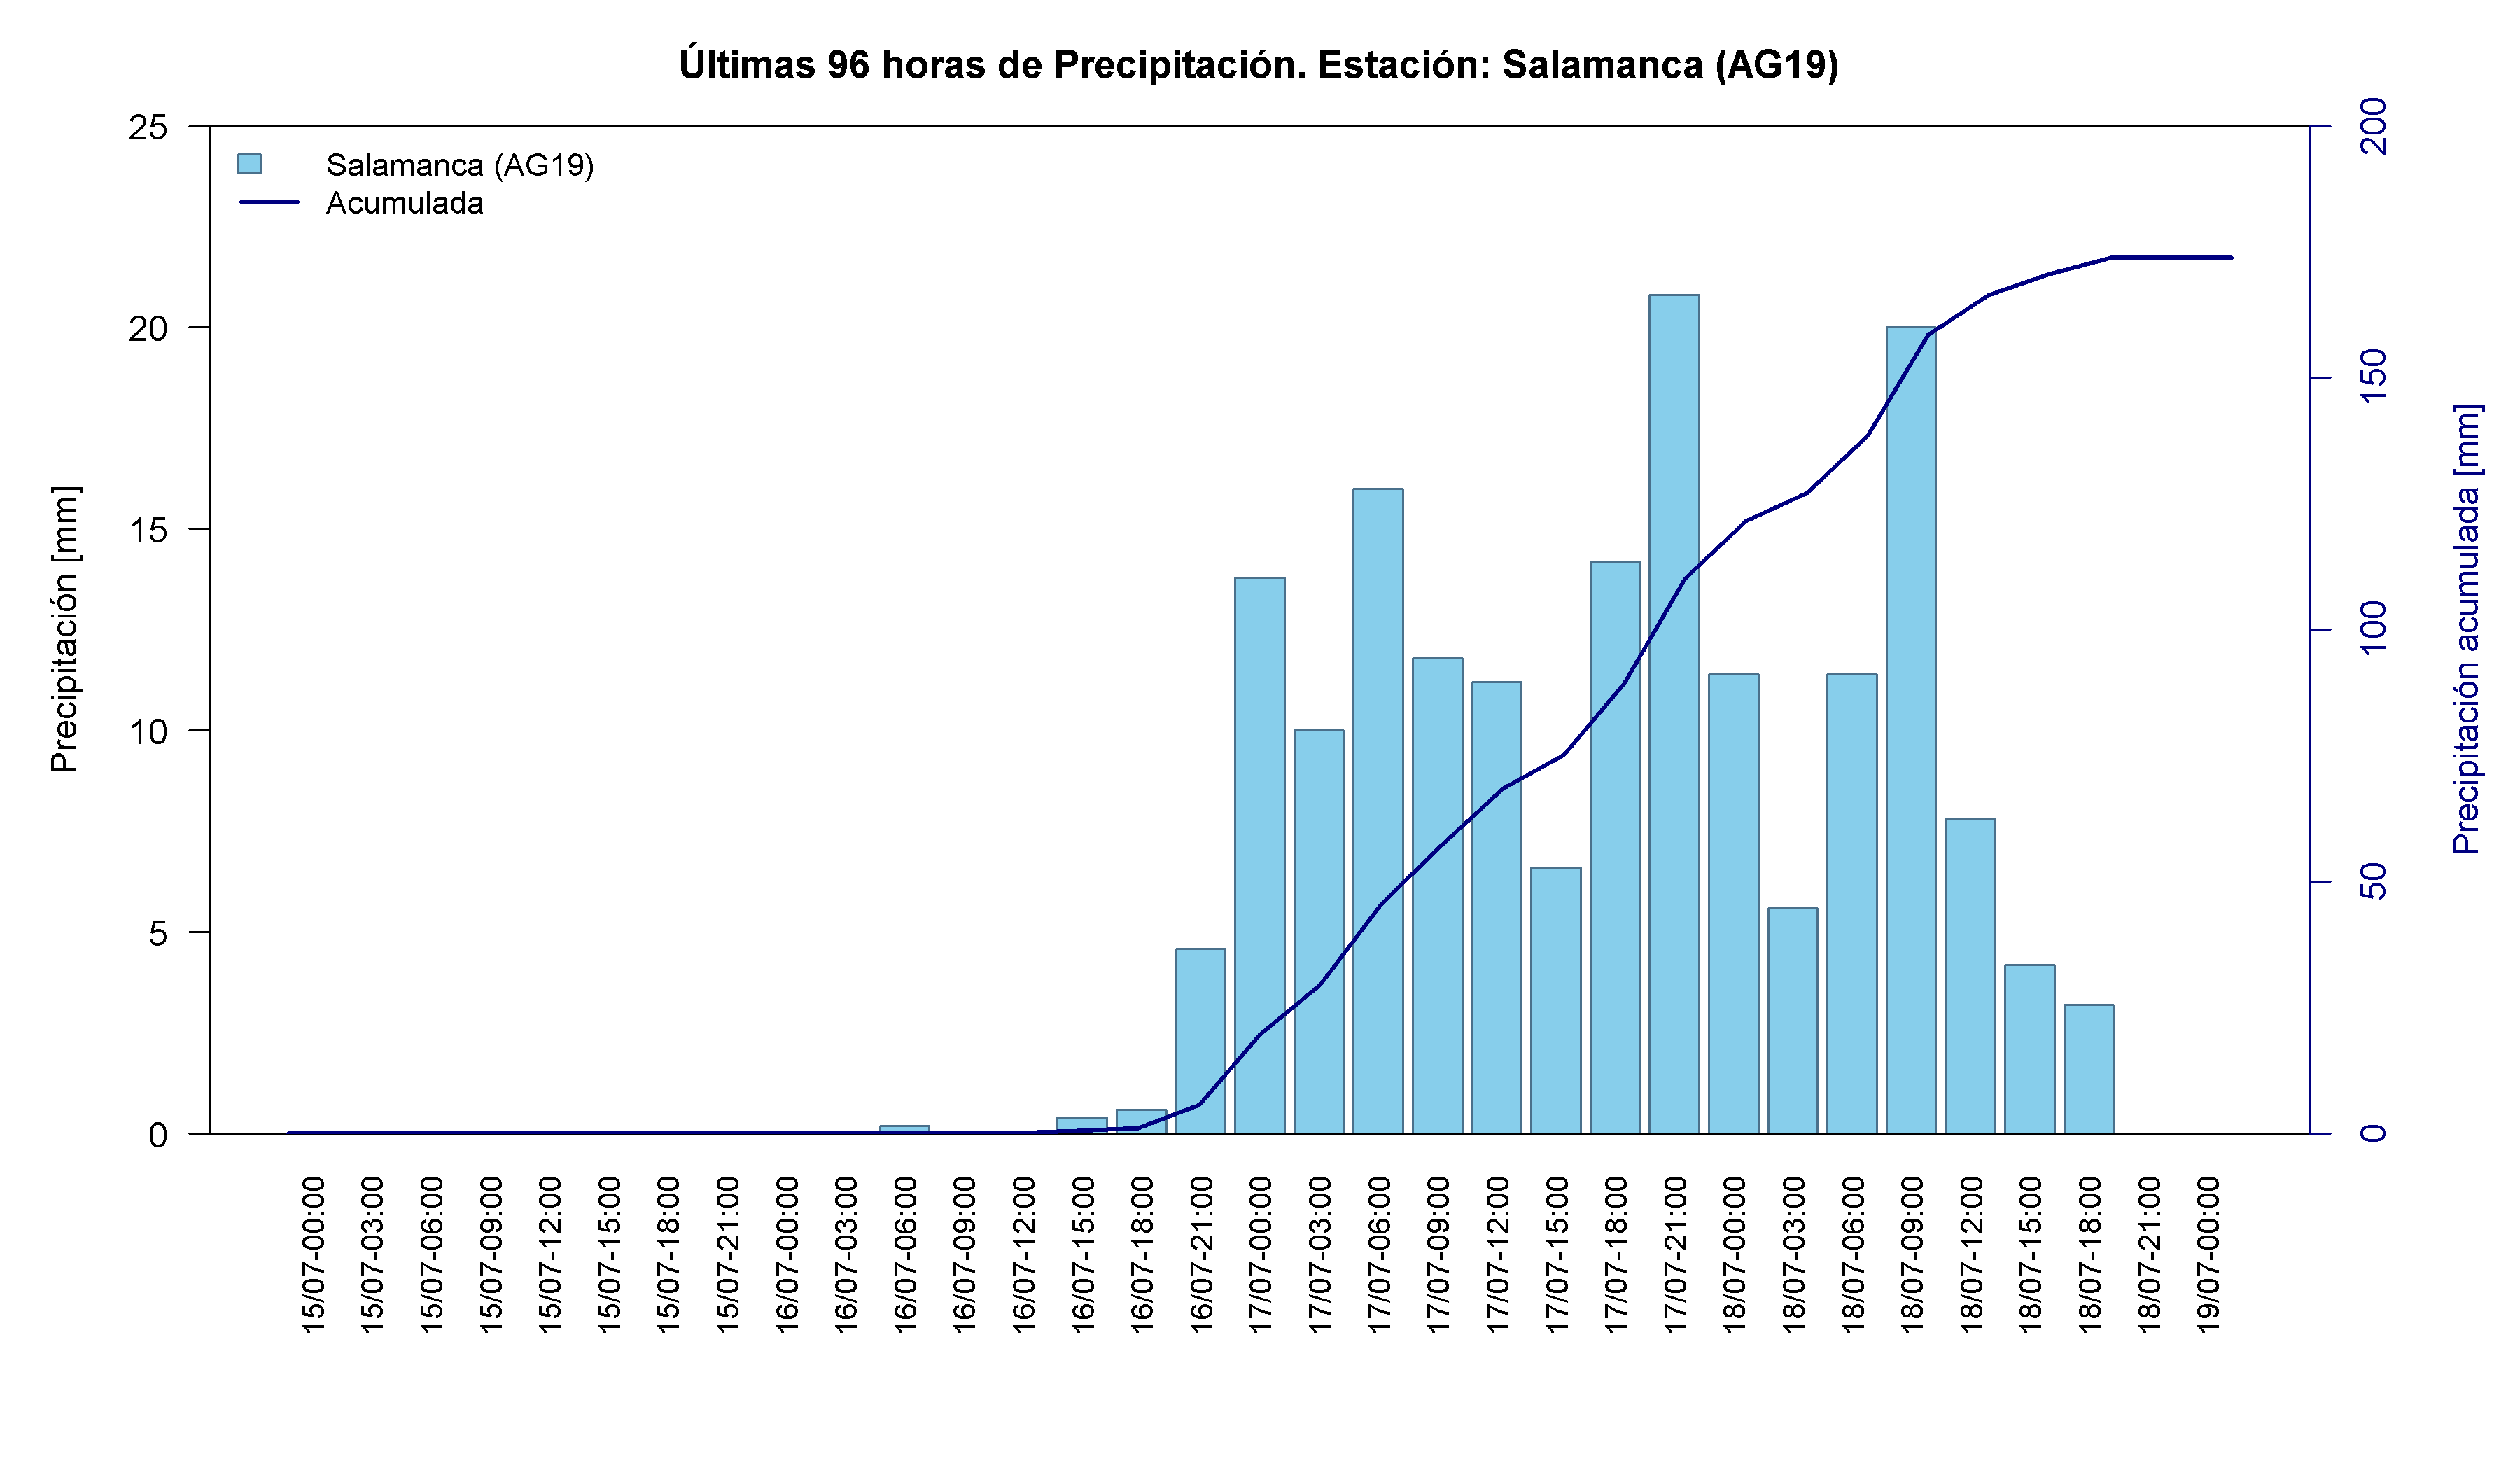
Coquimbo became the main focus of the emergency. Rainfall persisted for roughly 72 hours, saturating soils, disrupting roads and affecting drinking-water systems. The Senapred balance reported by CNN Chile indicated that 11 of the 18 missing people corresponded to Coquimbo, that people in shelters were concentrated in this region, and that isolated people were located mostly between Coquimbo and Atacama ¹⁰ . Las Cardas recorded 256.2 mm and Combarbalá 204.6 mm. The regional maximum occurred later than in central Chile, consistent with the northward movement of the system.
Time series and interactive elements
Map 2. Location of the rain gauges analysed in the Coquimbo Region during the frontal-system event of 15-19 July 2026. Source: Authors’ analysis based on data from the VisMet meteorological viewer .
Table 2. Accumulated precipitation recorded at rain gauges in the Coquimbo Region between 15 and 19 July 2026. Source: Authors’ analysis based on data from the VisMet meteorological viewer .
Valparaíso Region
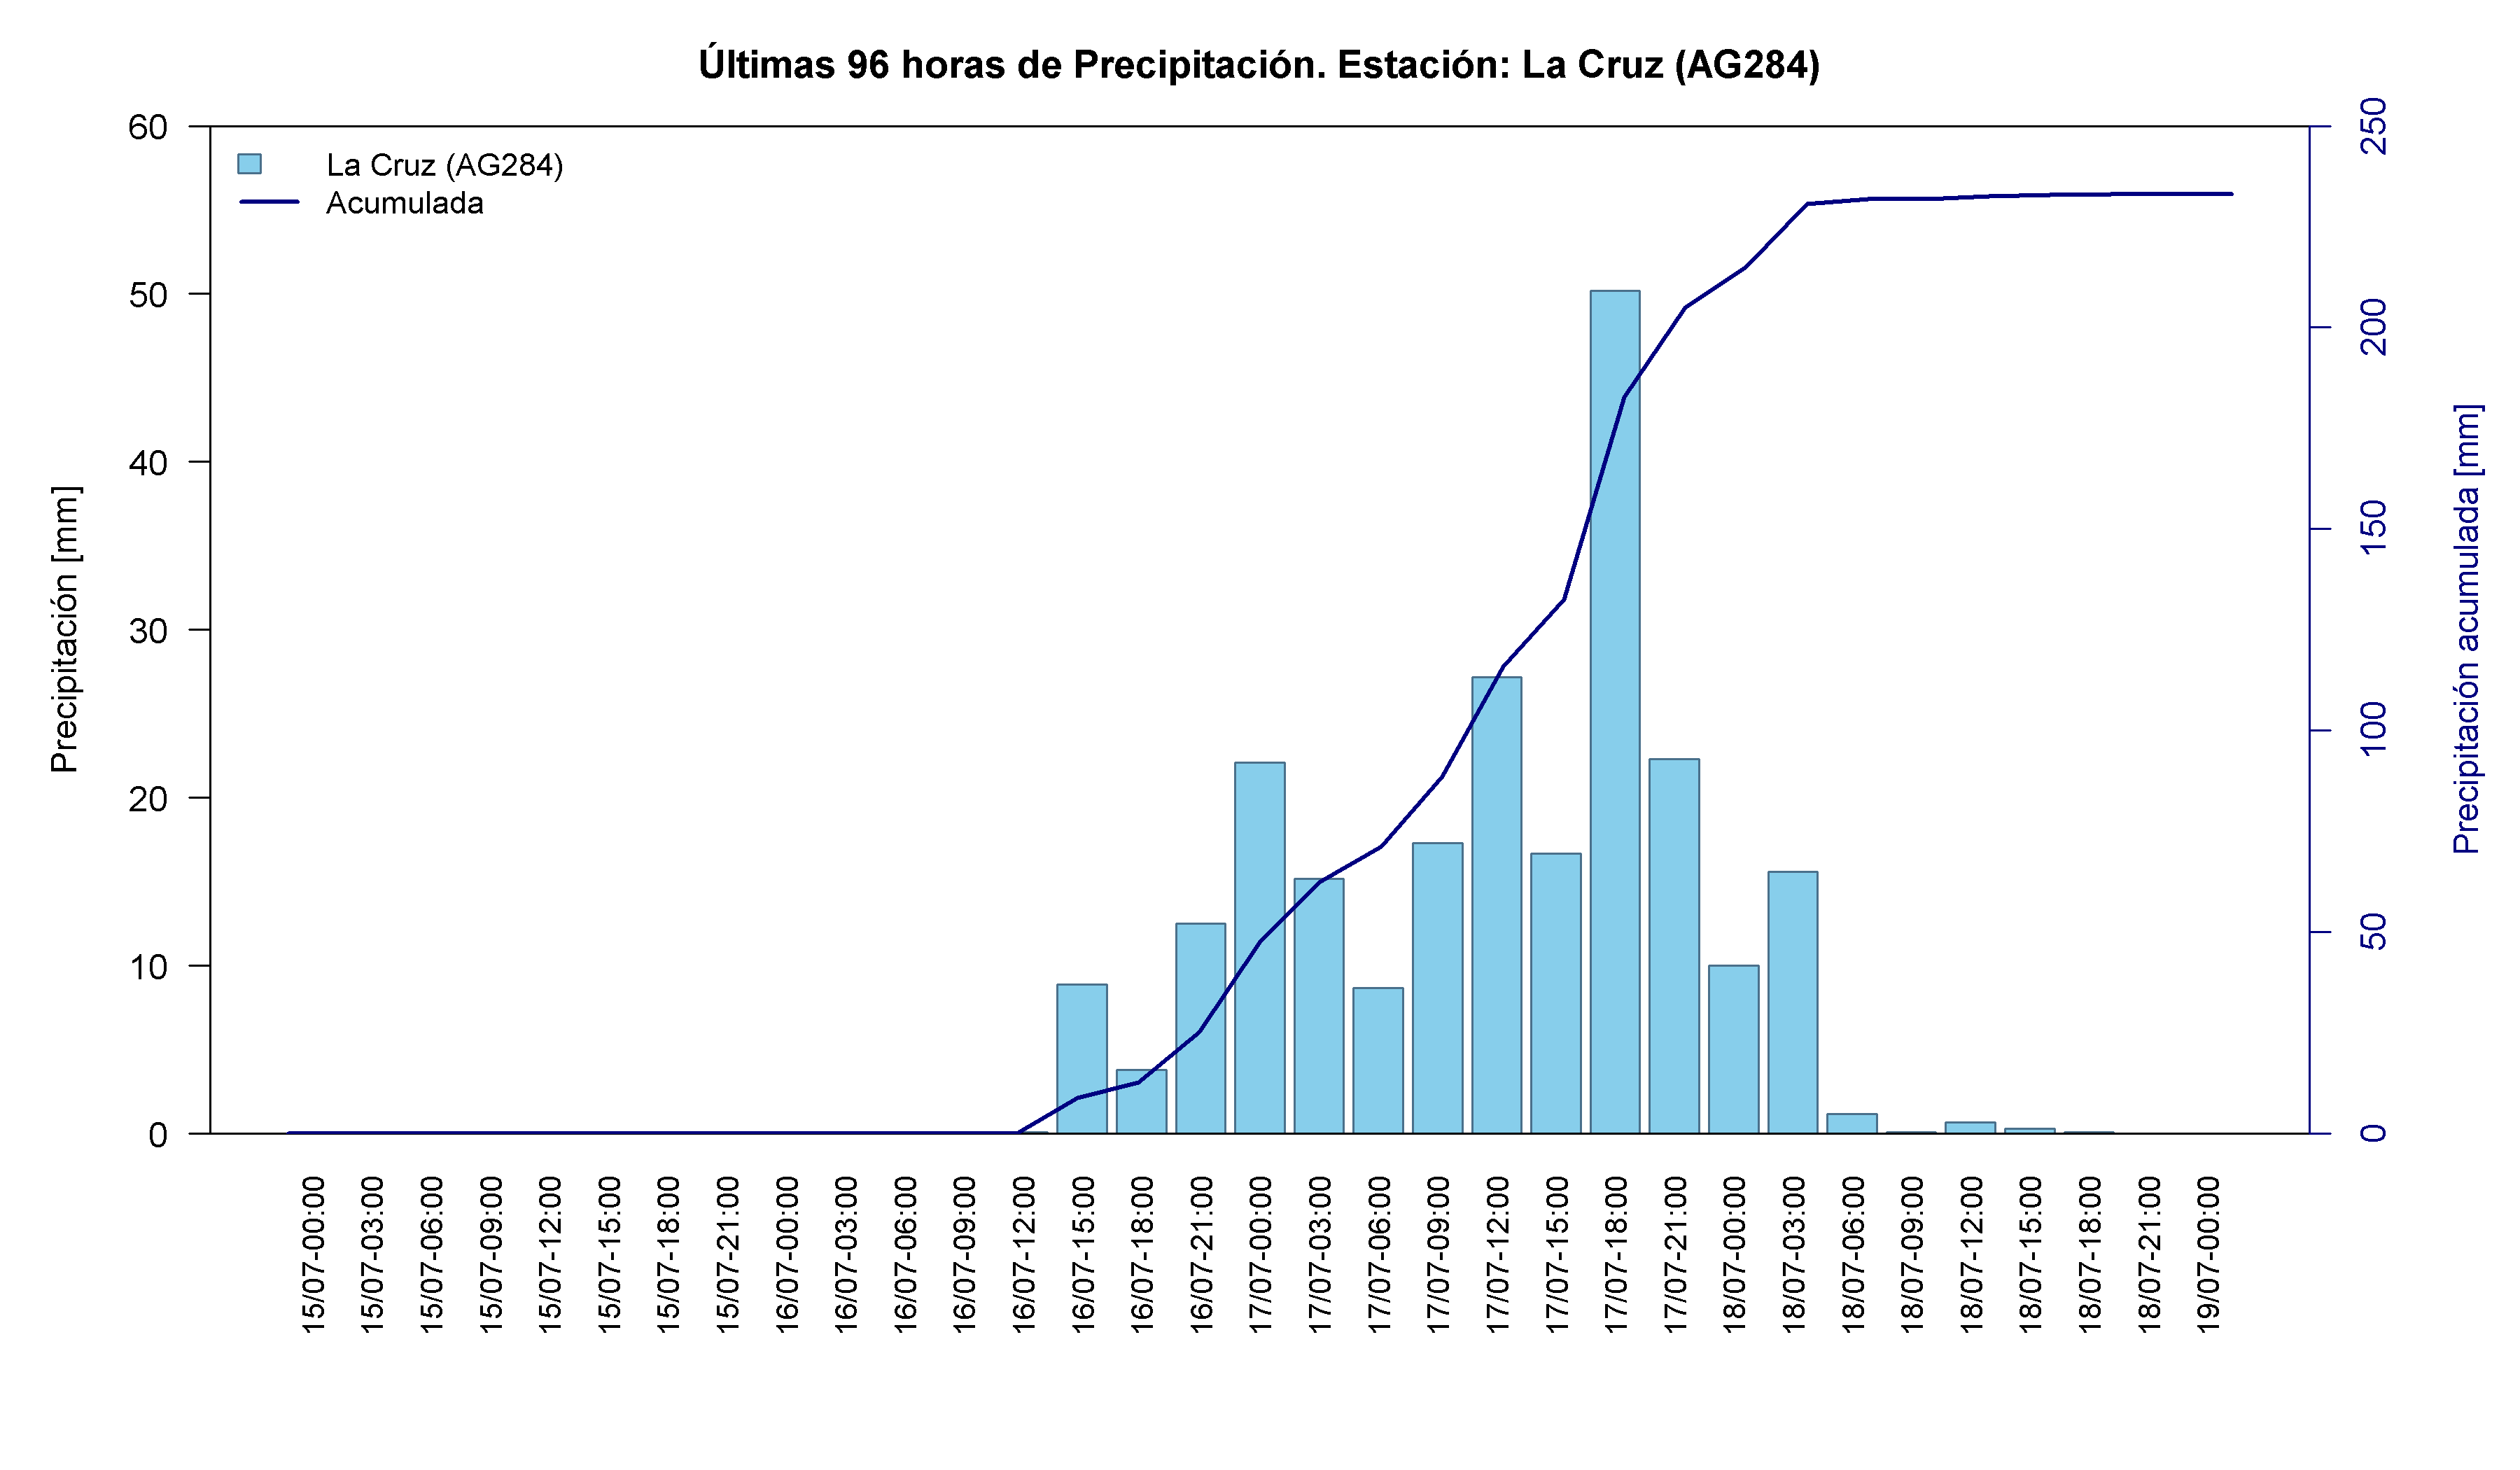
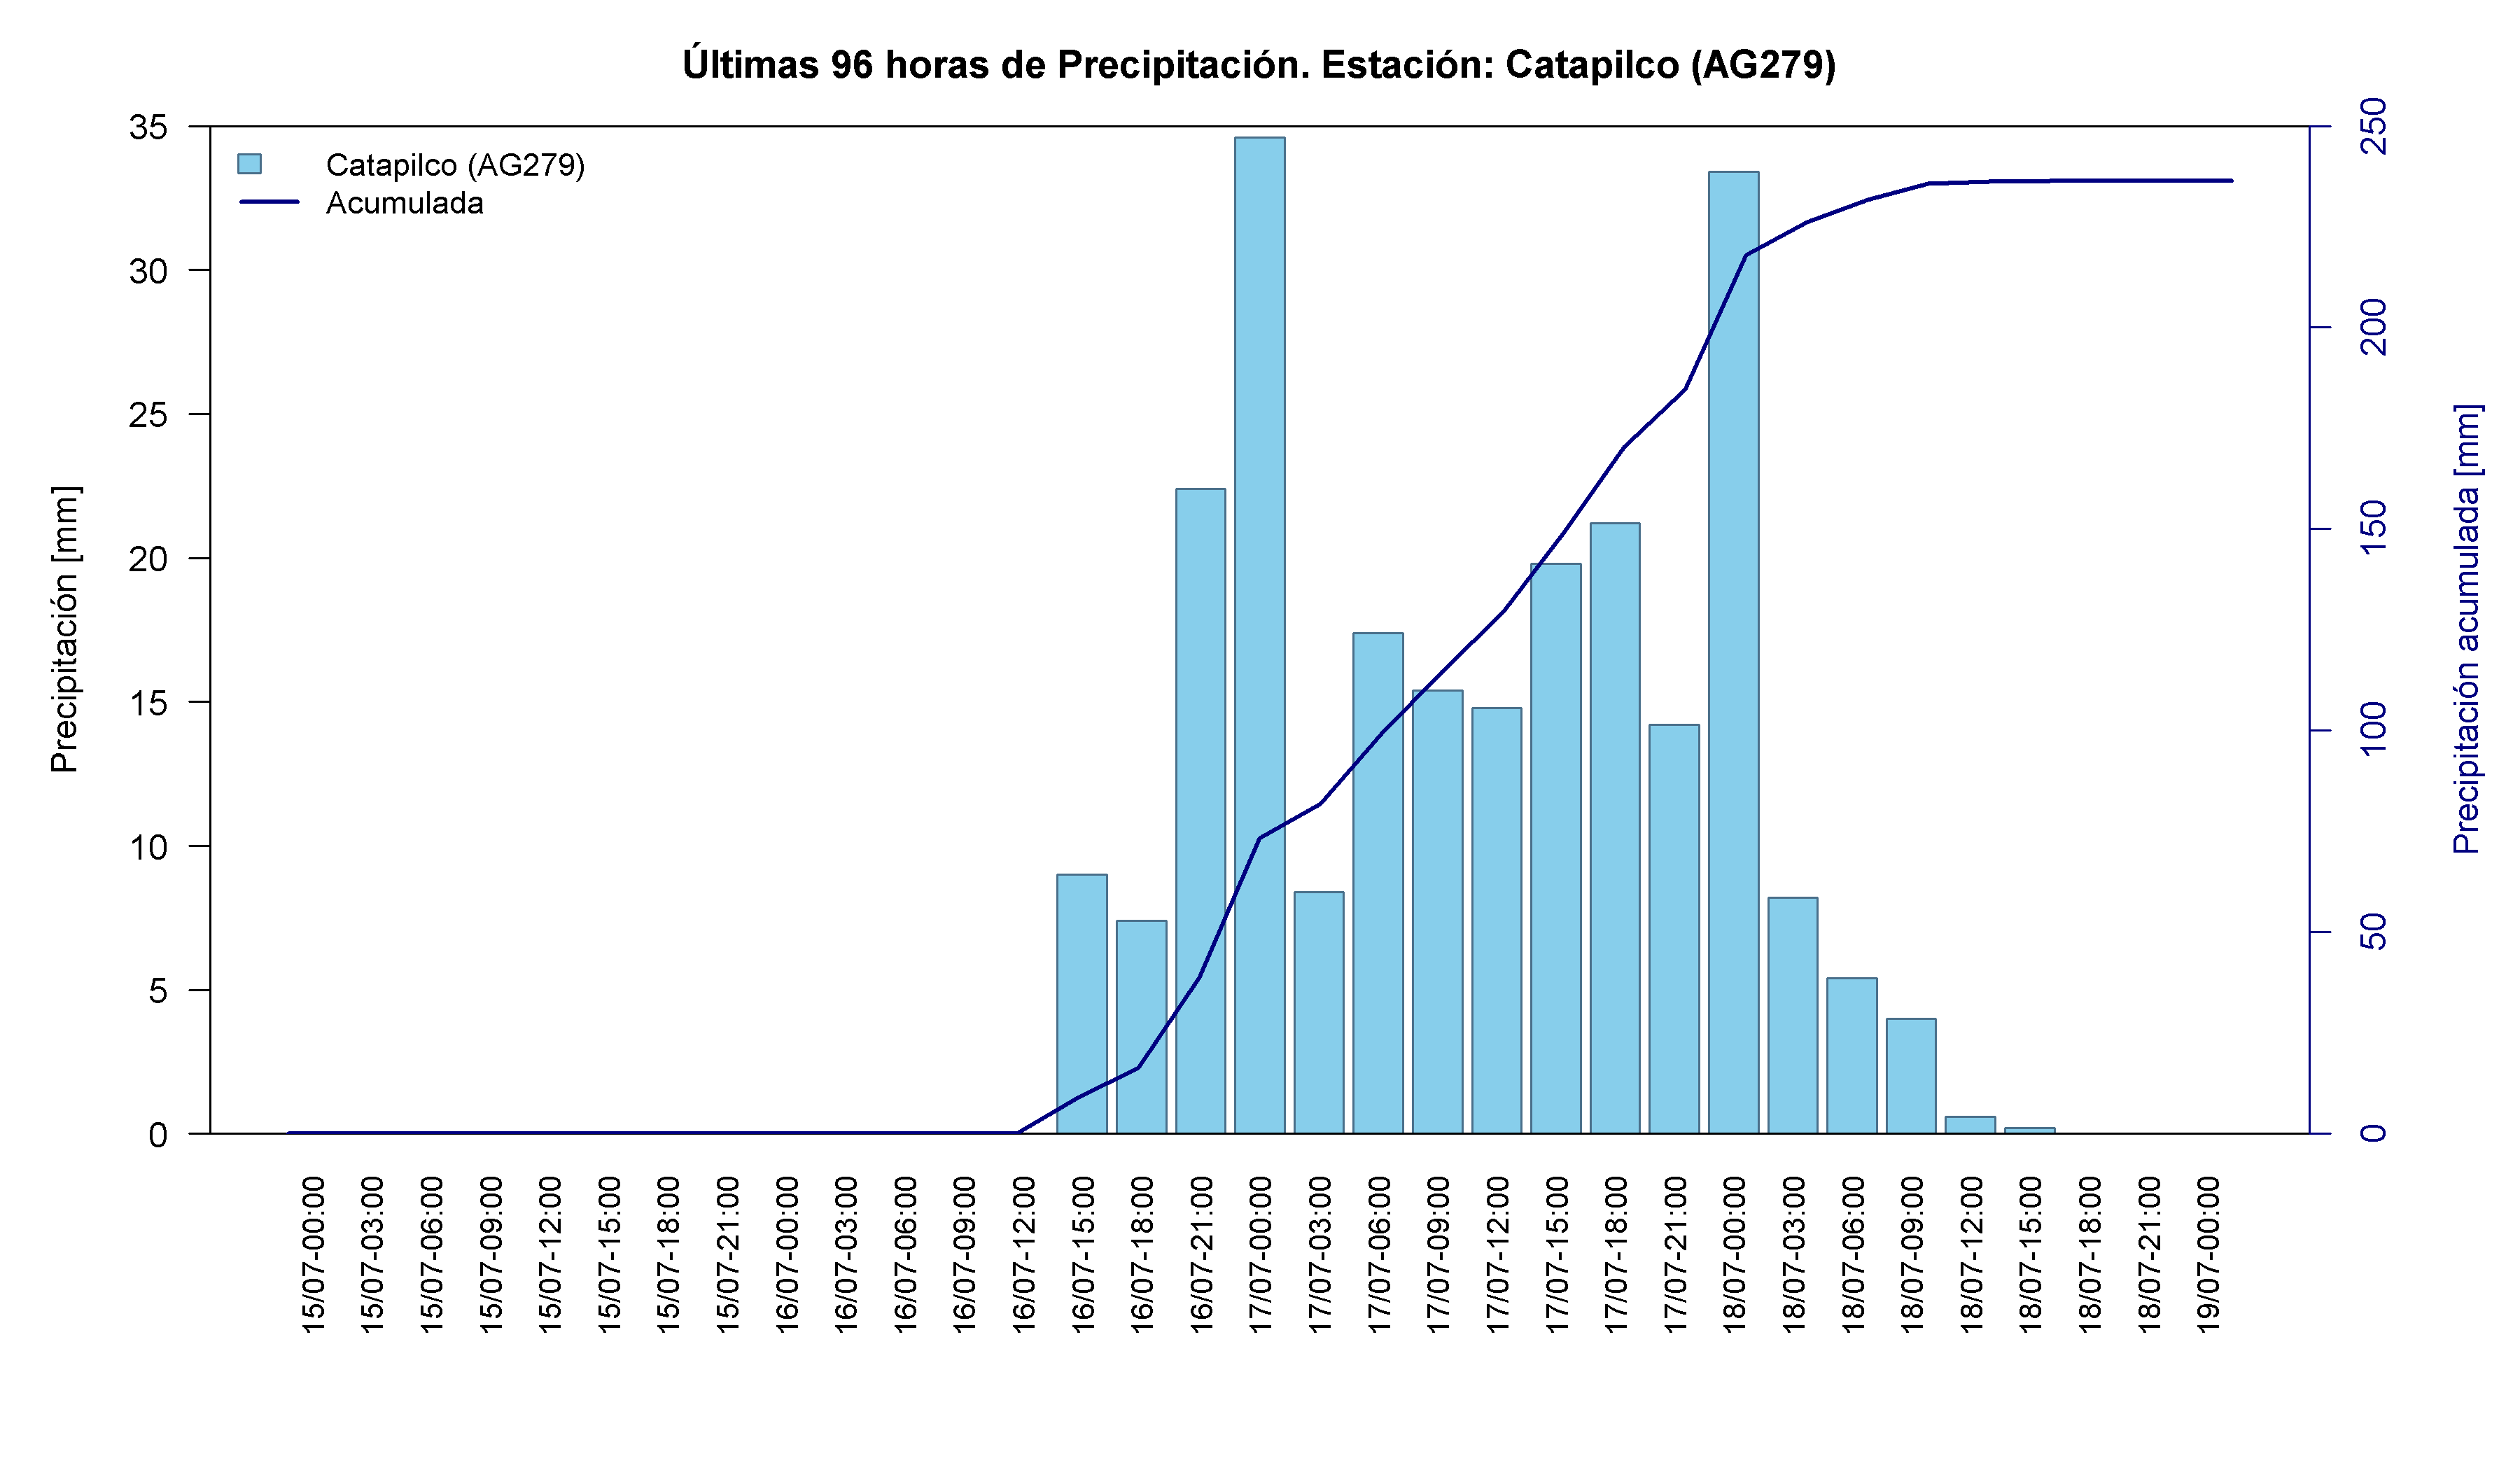
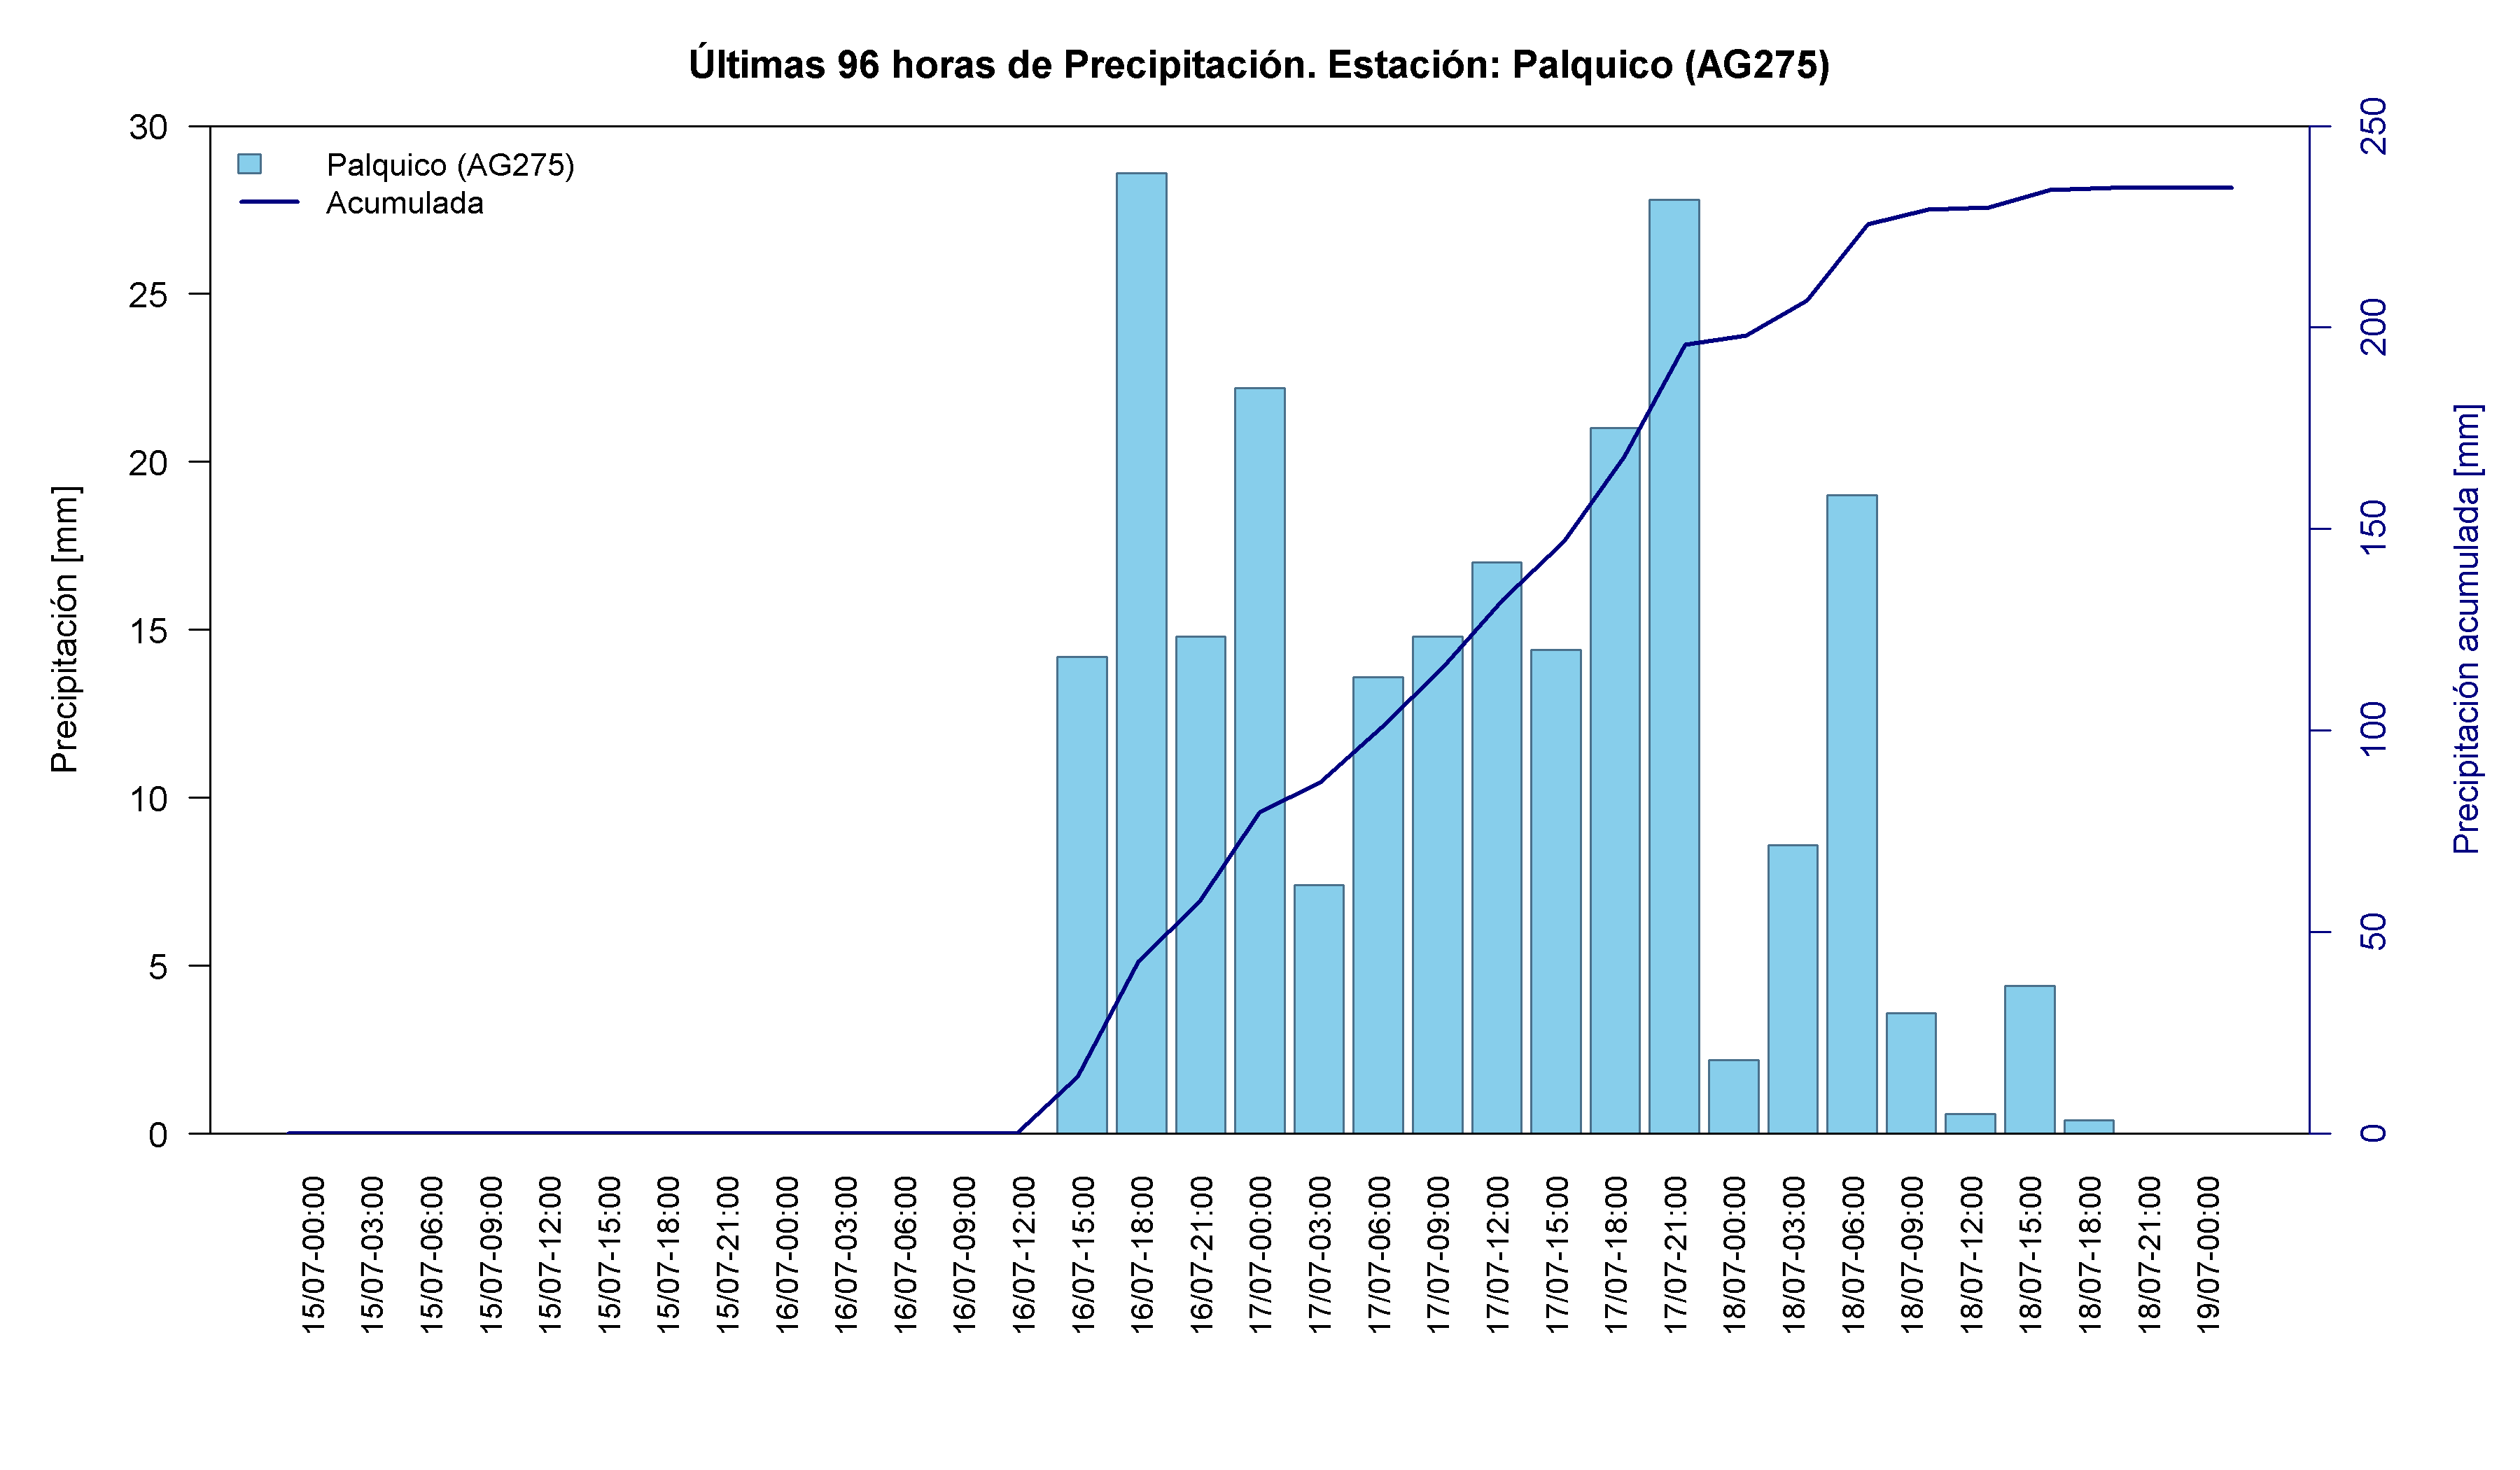
Valparaíso combined very large totals with exceptionally intense bursts. La Cruz recorded 250.6 mm, including 214.4 mm on 17 July, while Catapilco and Palquico exceeded 235 mm. The combination of volume, intensity and short duration increased the likelihood of flooding, slope failures and prolonged electricity outages.
Time series and interactive elements
Map 3. Location of the rain gauges analysed in the Valparaíso Region during the frontal-system event of 15-19 July 2026. Source: Authors’ analysis based on data from the VisMet meteorological viewer .
Table 3. Accumulated precipitation recorded at rain gauges in the Valparaíso Region between 15 and 19 July 2026. Source: Authors’ analysis based on data from the VisMet meteorological viewer .
Santiago Metropolitan Region
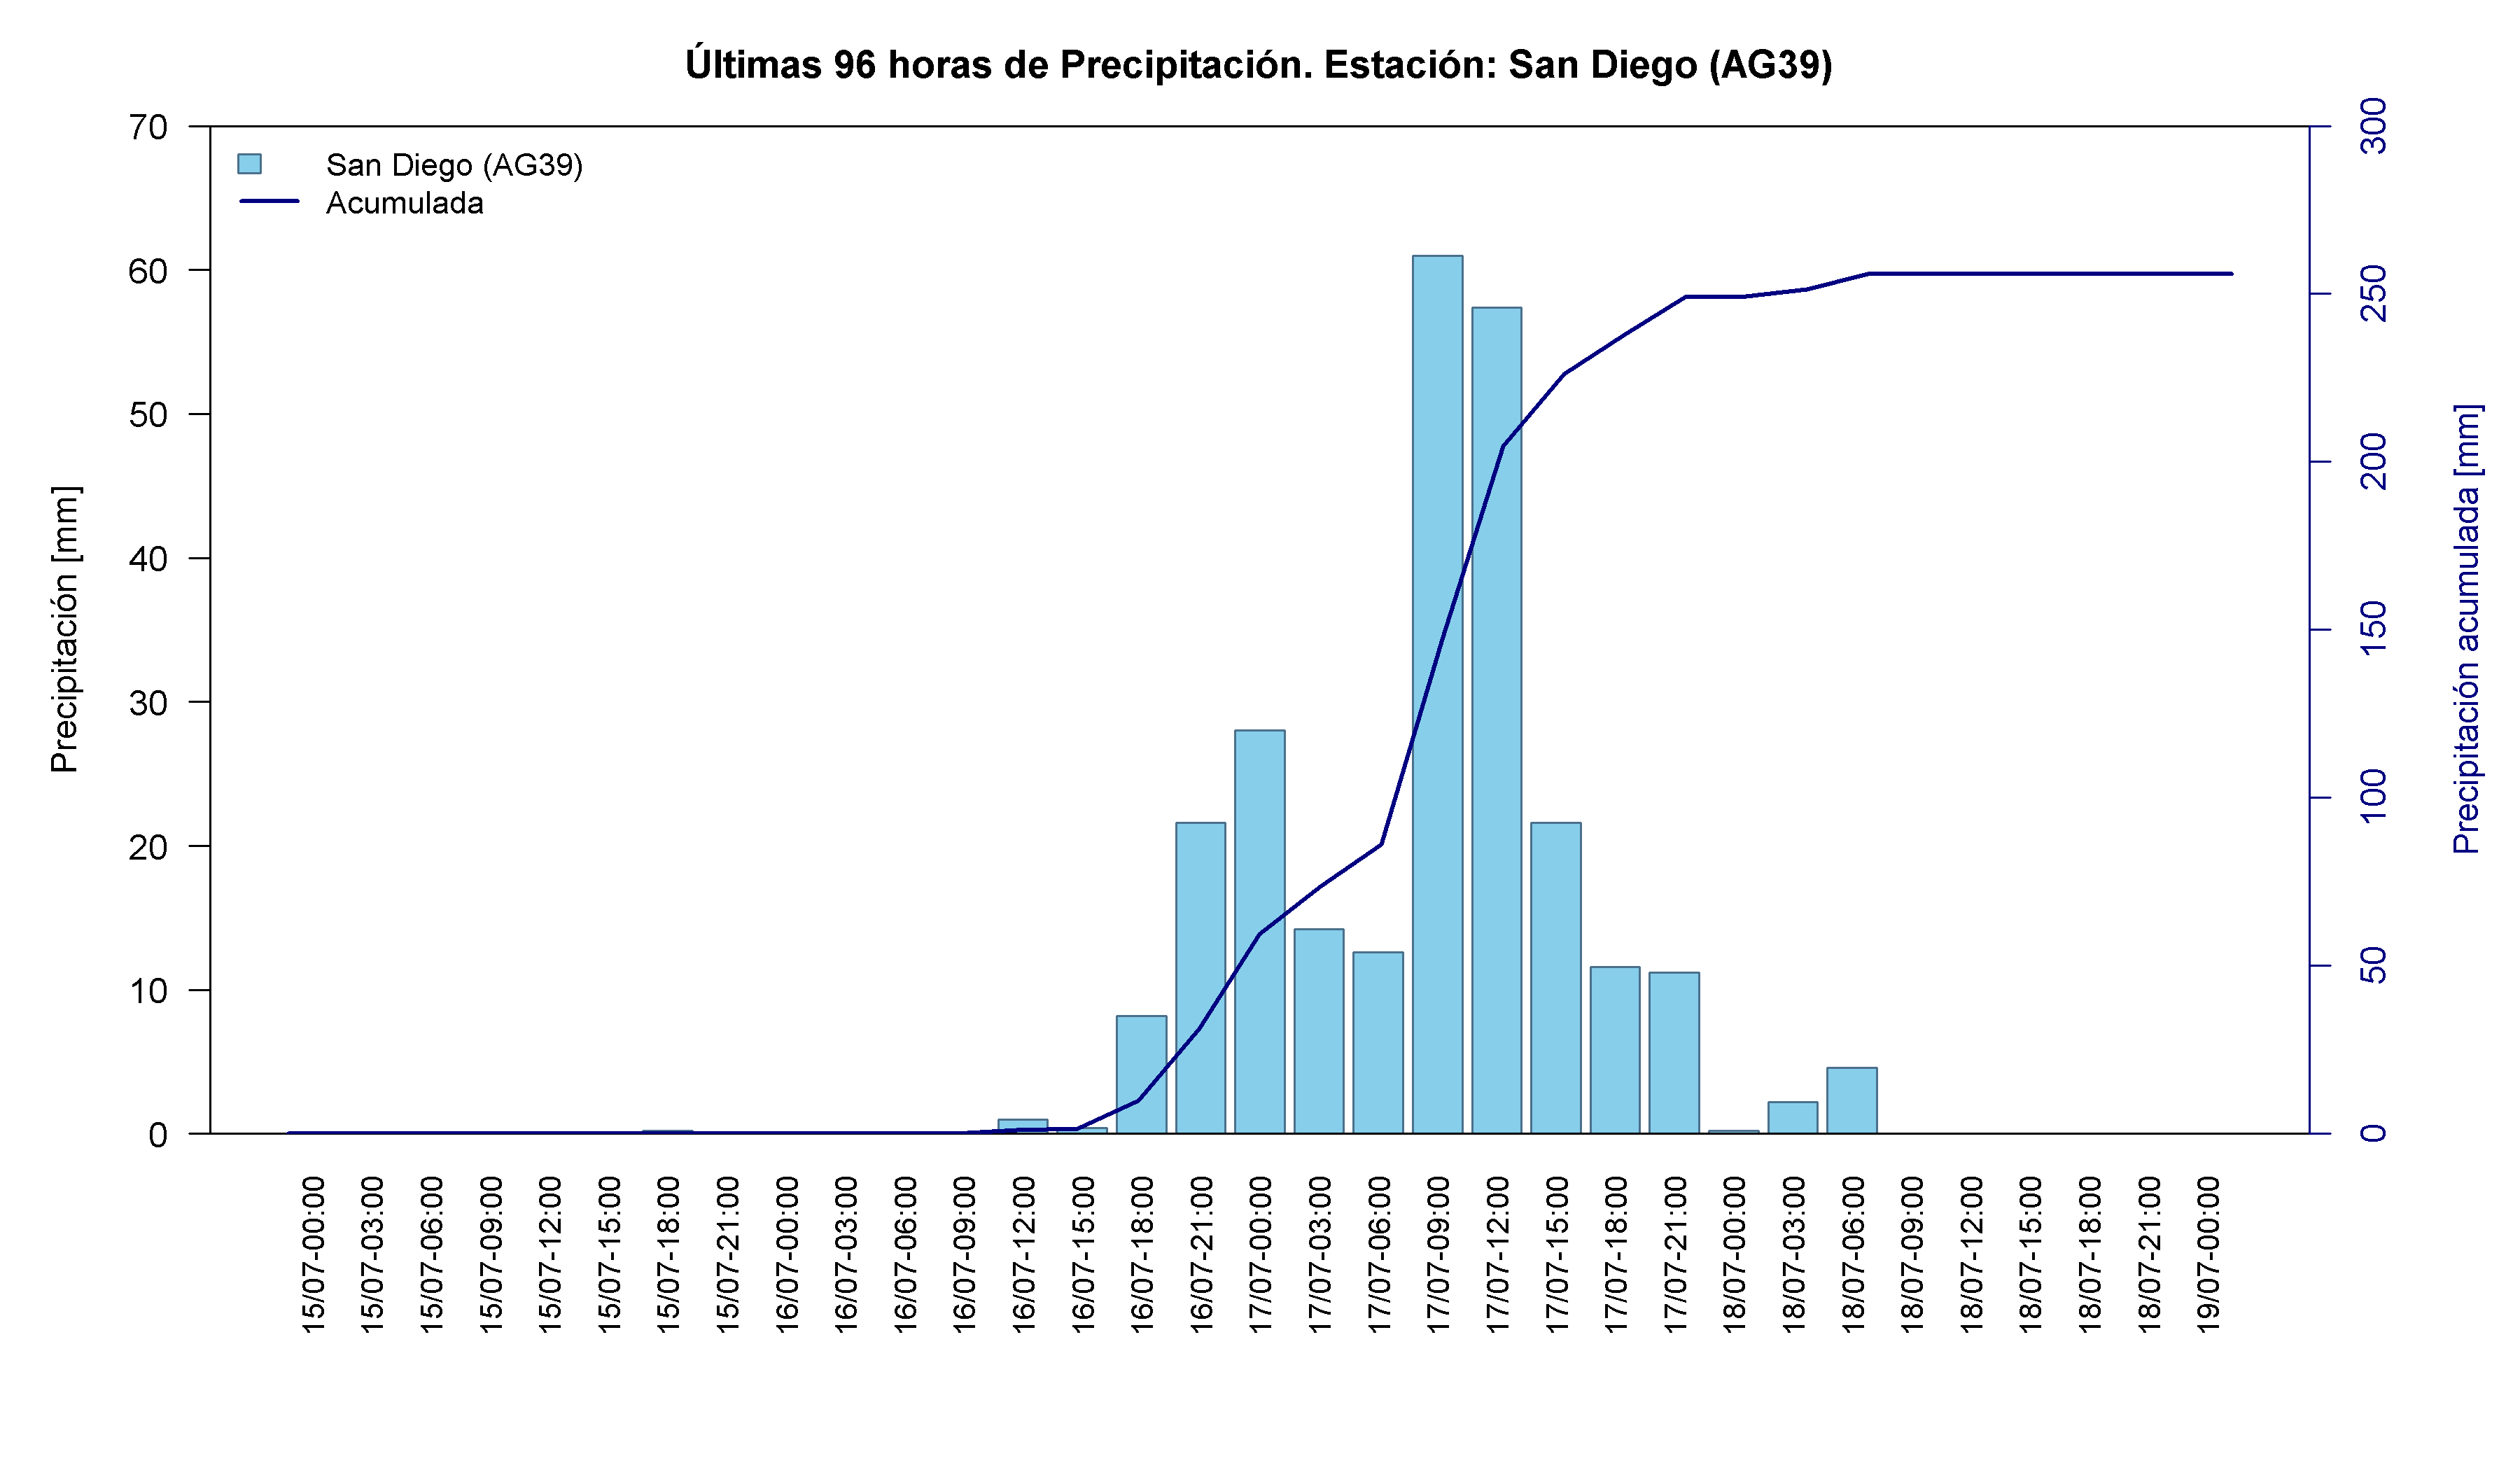
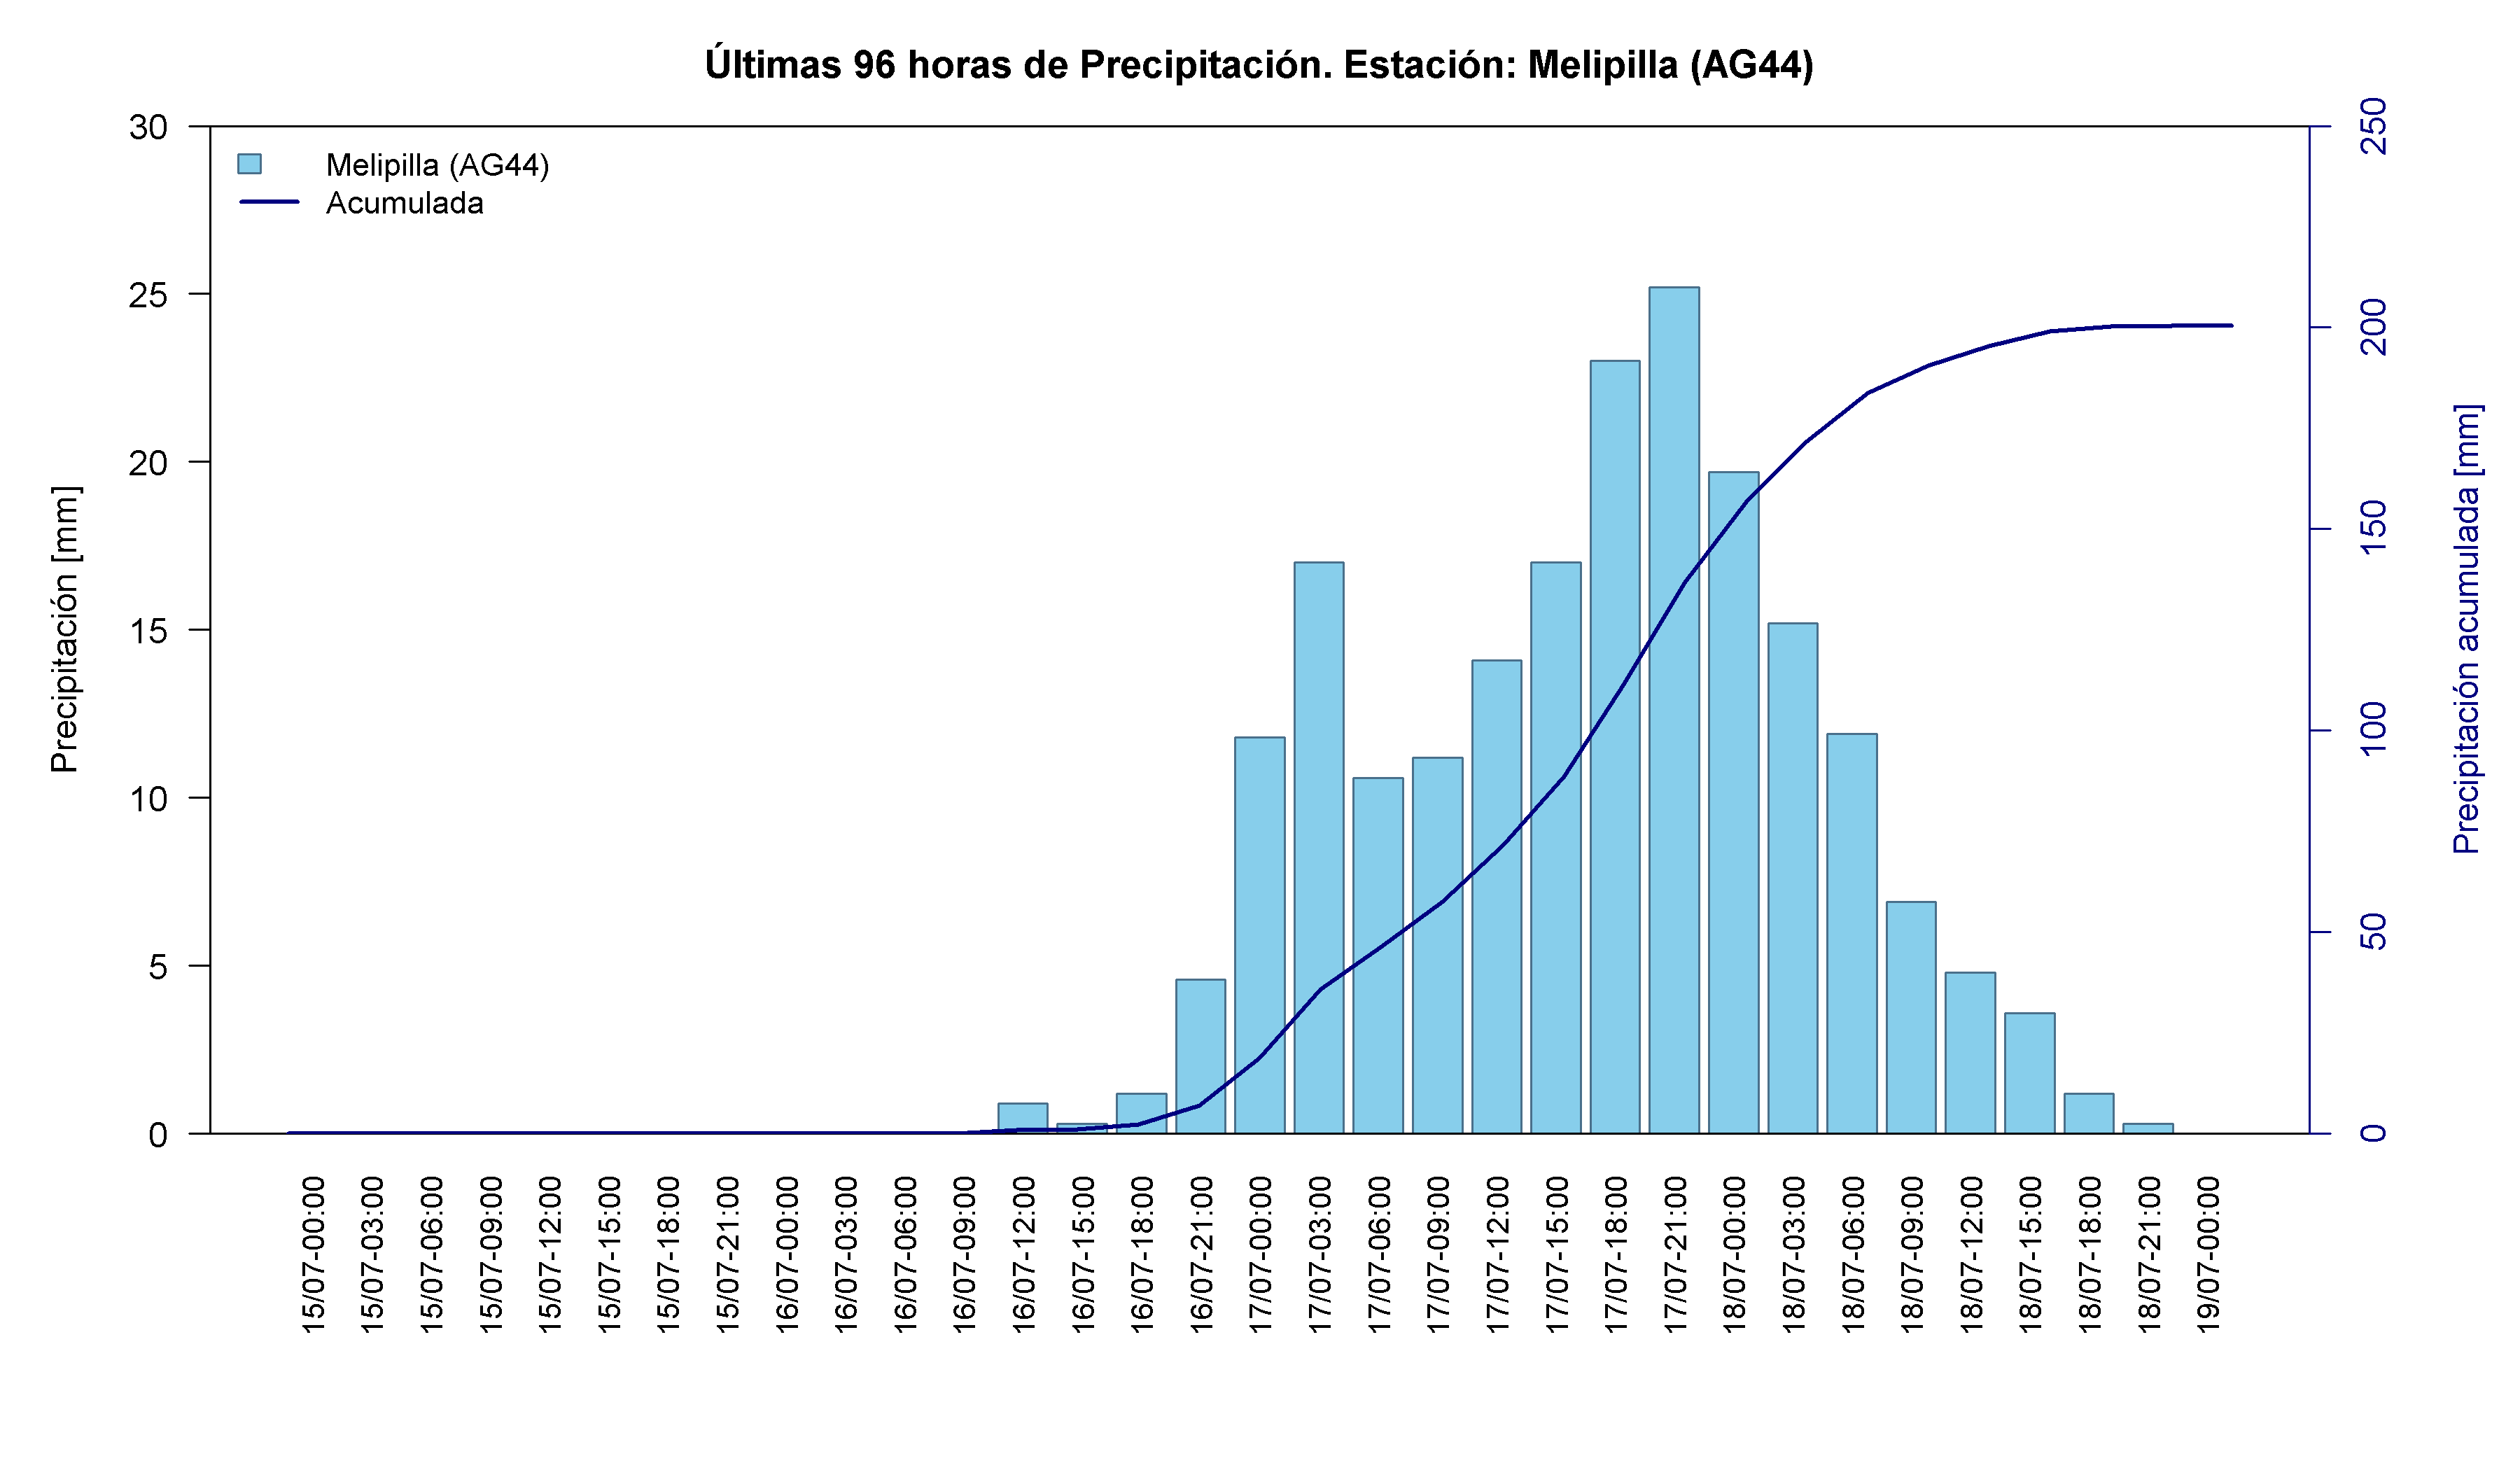
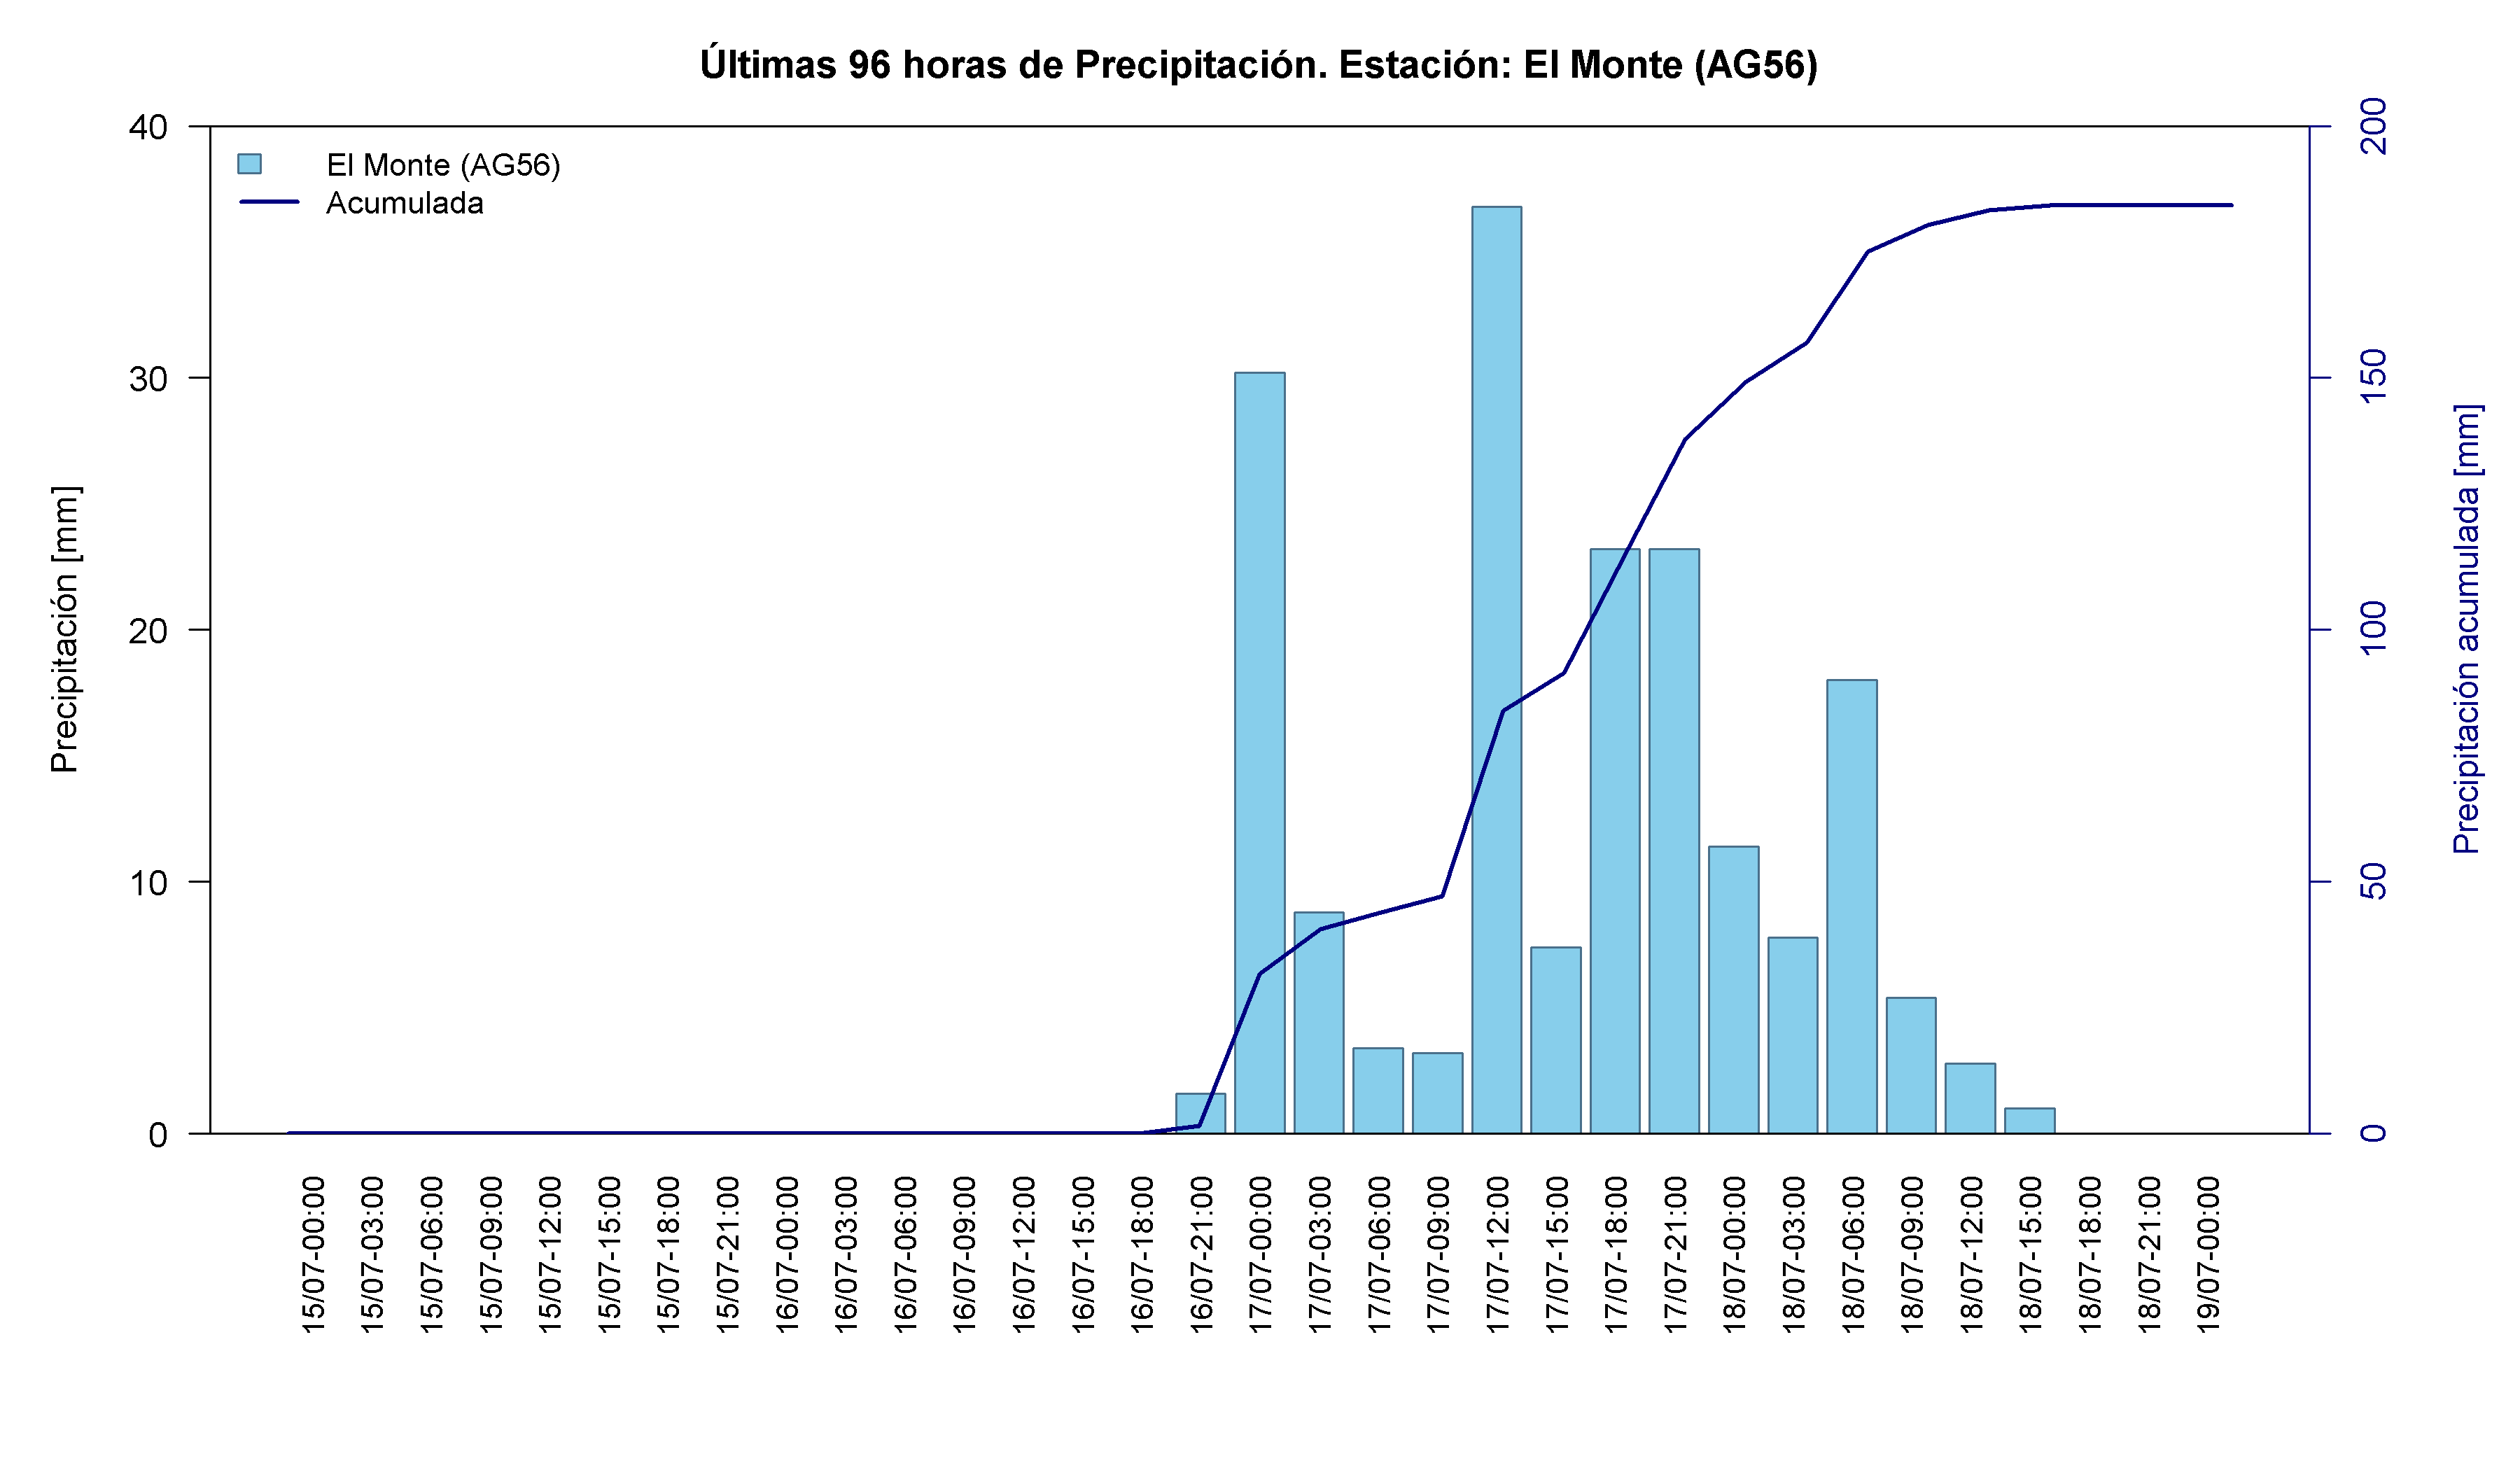
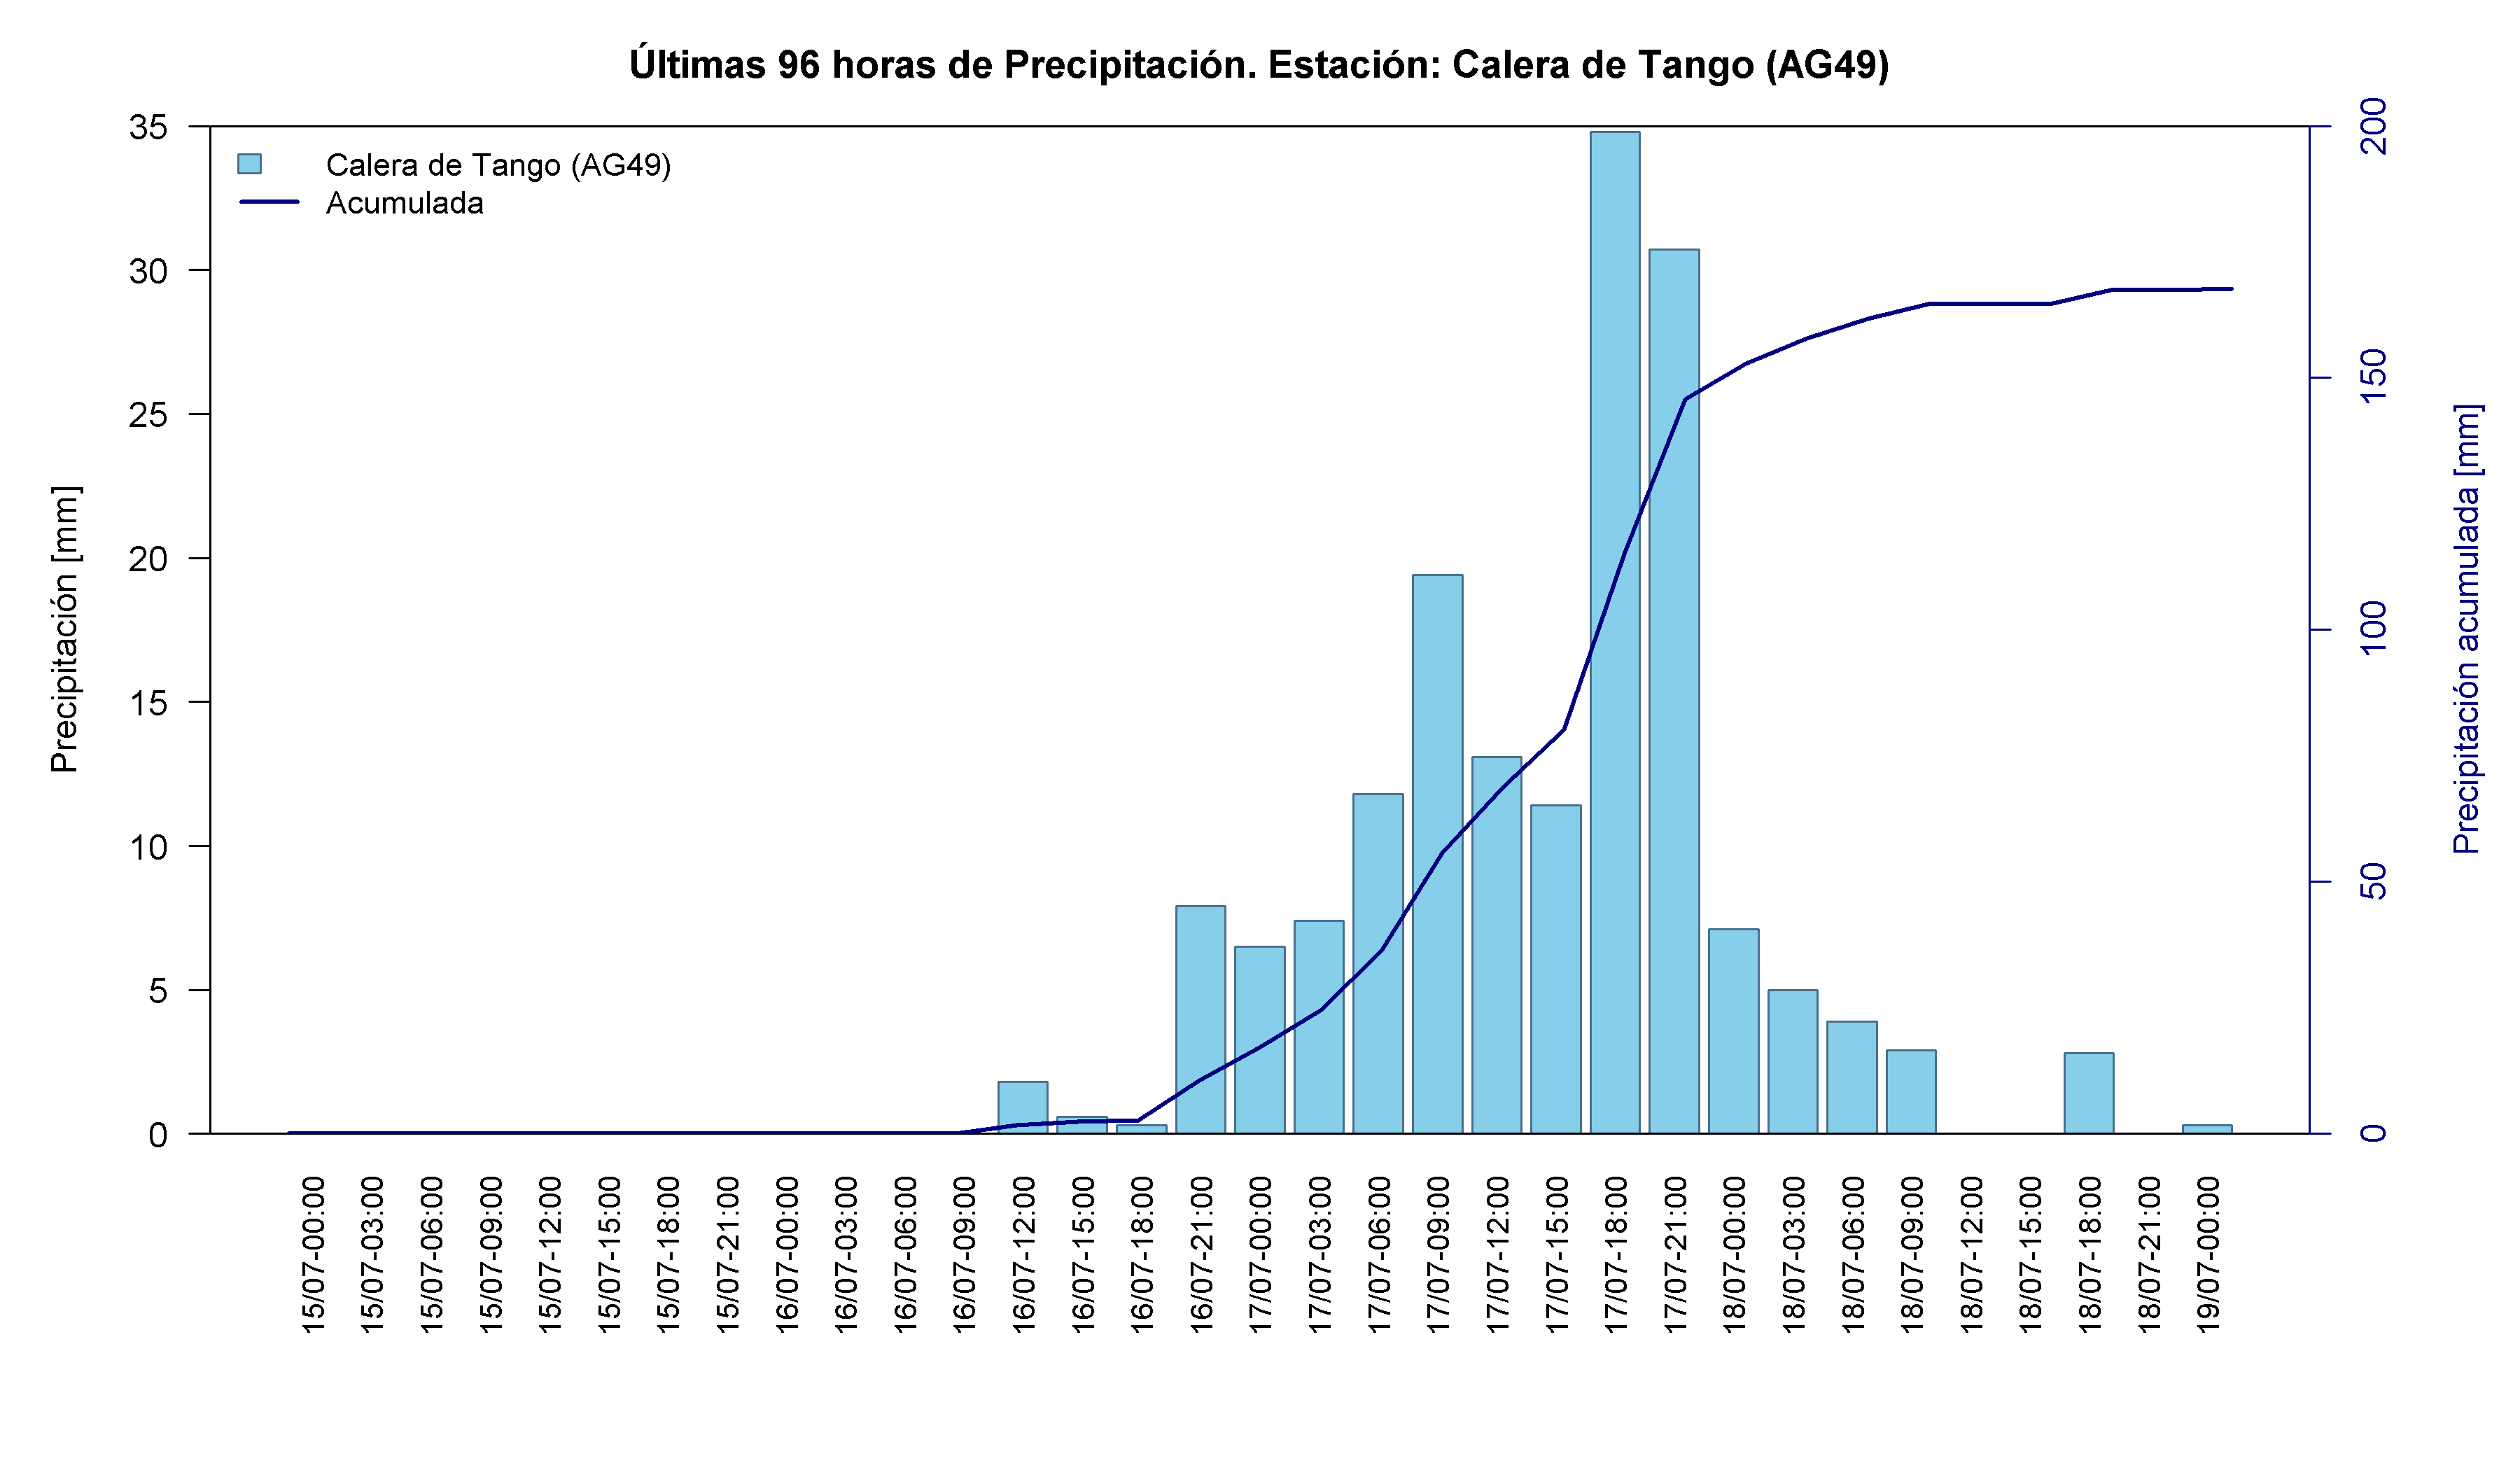
The Santiago Metropolitan Region recorded the largest daily total in the analysed network. San Diego received 217.6 mm on 17 July and 256.2 mm over the full period. Melipilla, El Monte and Calera de Tango followed a similar pattern, with much of the rainfall concentrated within 48 hours - a particularly critical configuration in urbanised catchments.
Time series and interactive elements
Map 4. Location of the rain gauges analysed in the Santiago Metropolitan Region during the frontal-system event of 15-19 July 2026. Source: Authors’ analysis based on data from the VisMet meteorological viewer .
Table 4. Accumulated precipitation recorded at rain gauges in the Santiago Metropolitan Region between 15 and 19 July 2026. Source: Authors’ analysis based on data from the VisMet meteorological viewer .
Libertador General Bernardo O’Higgins Region
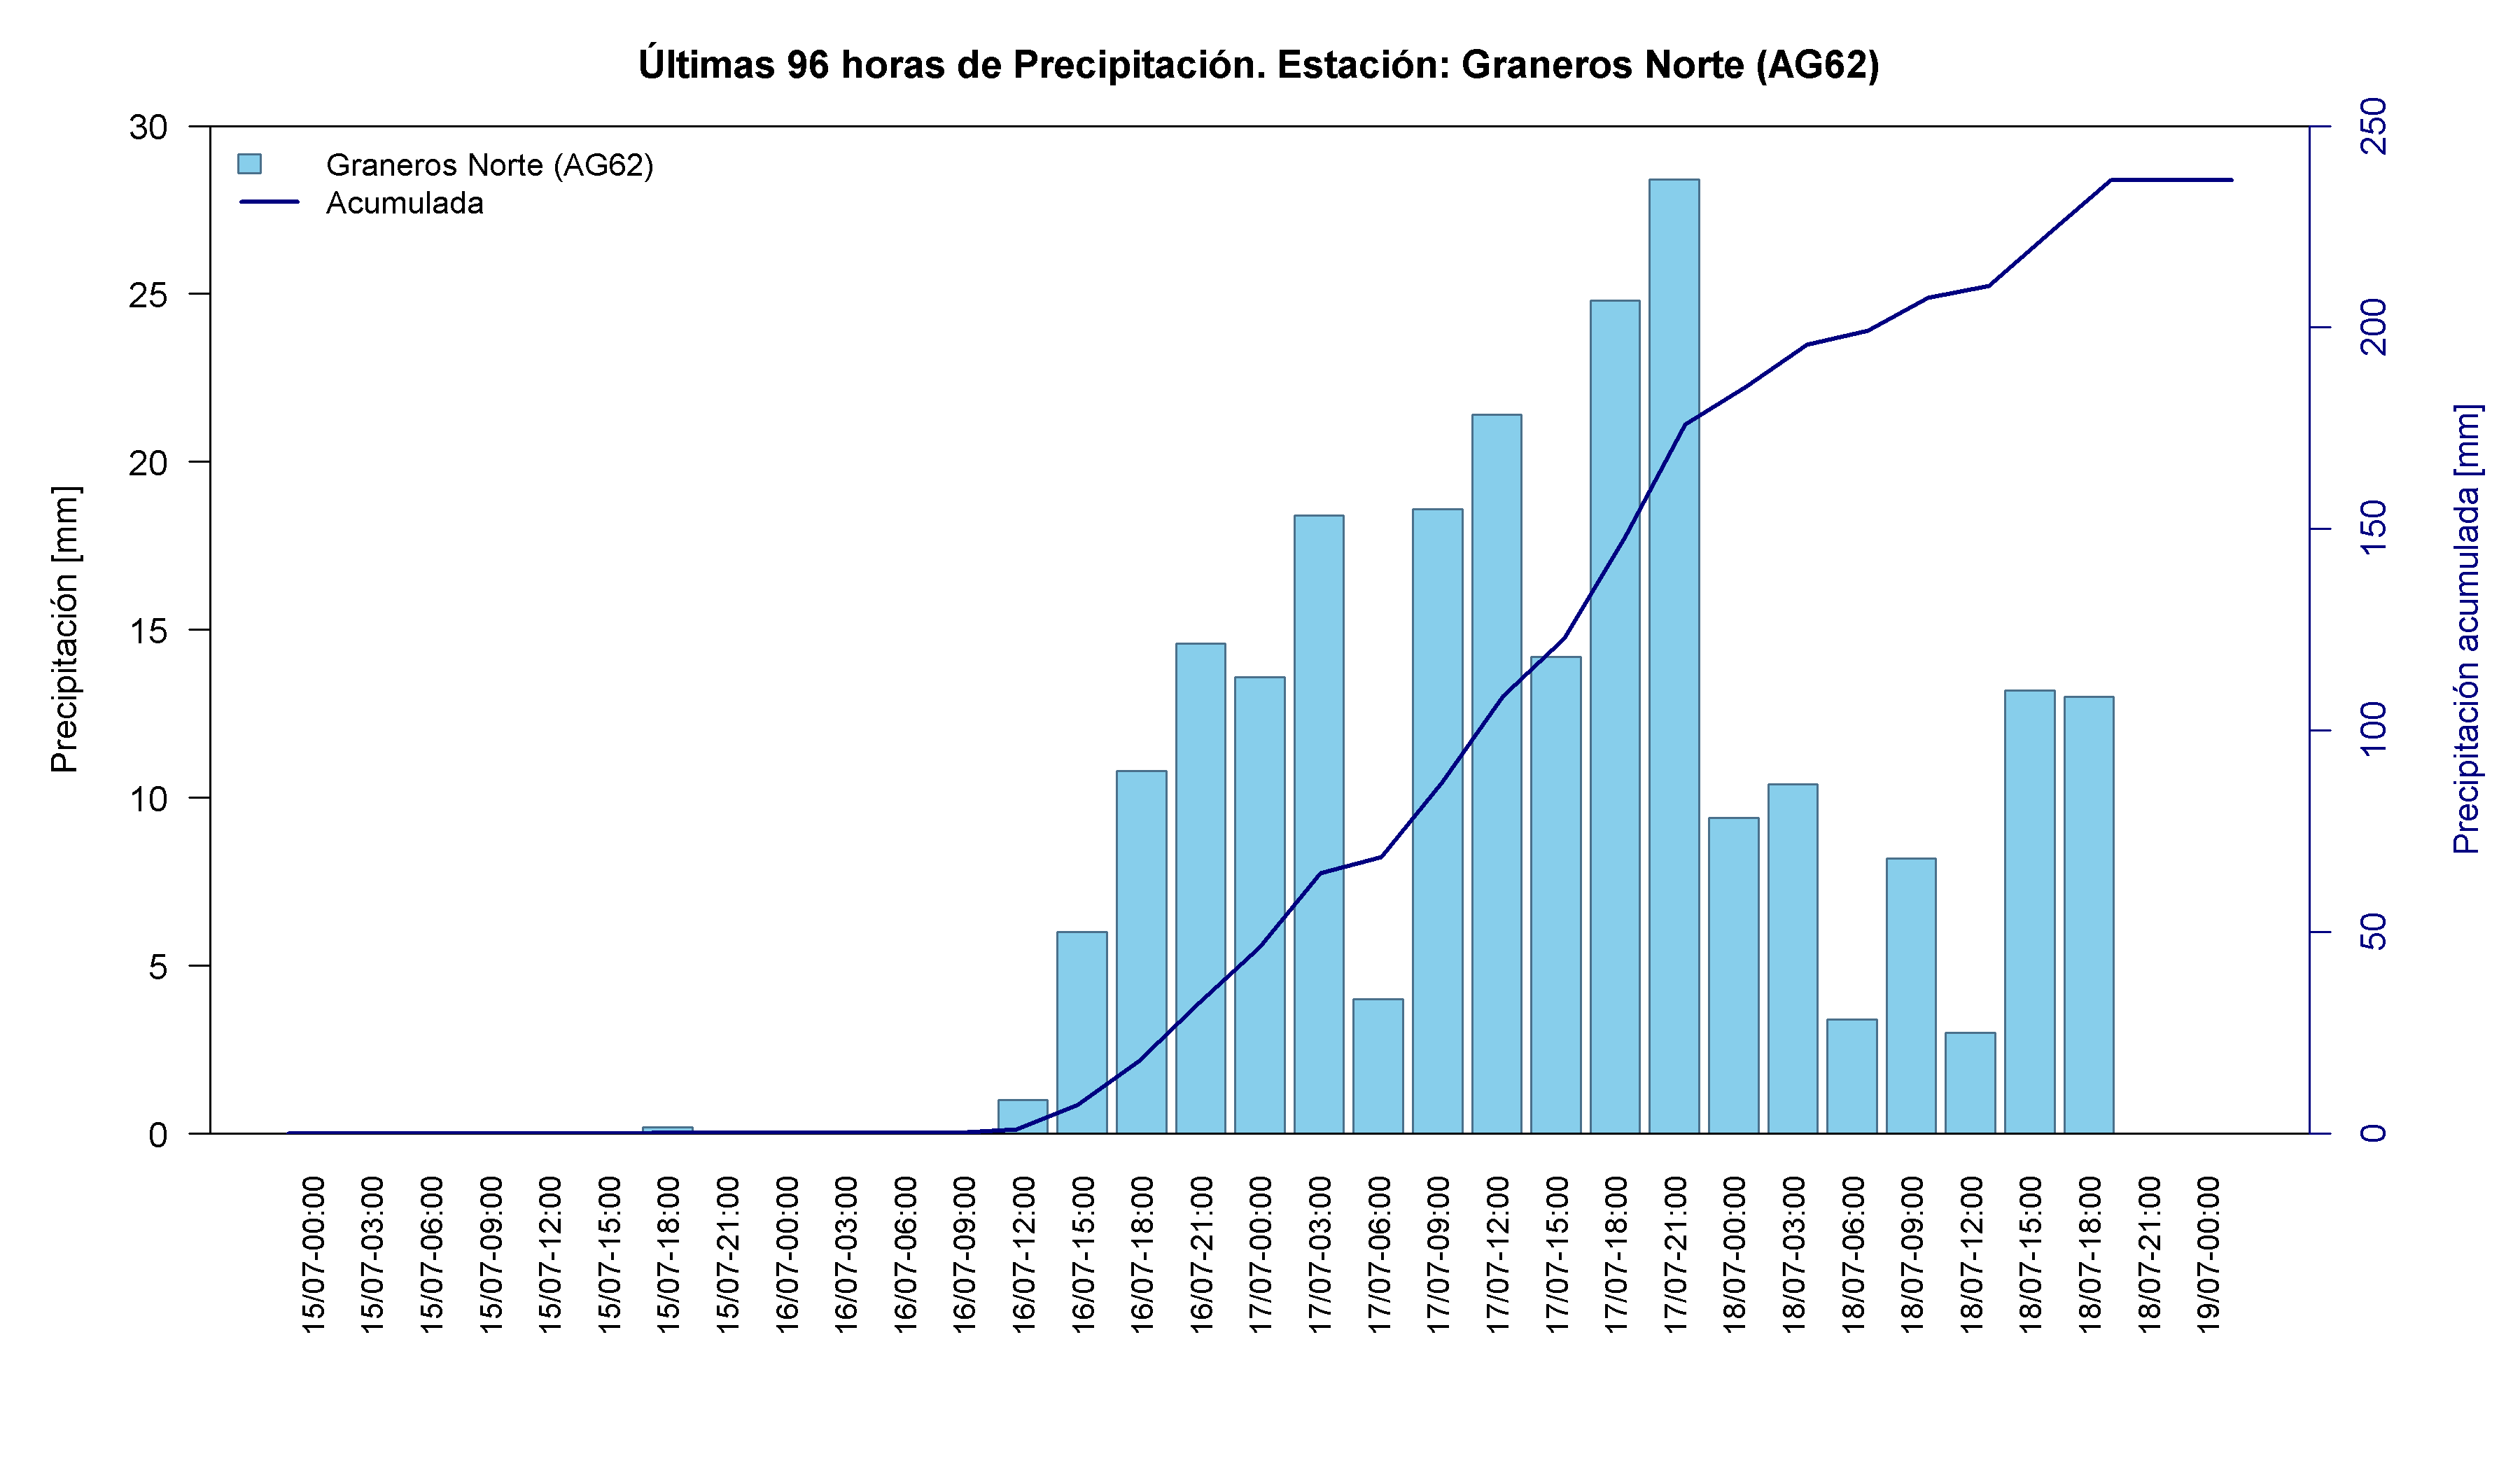
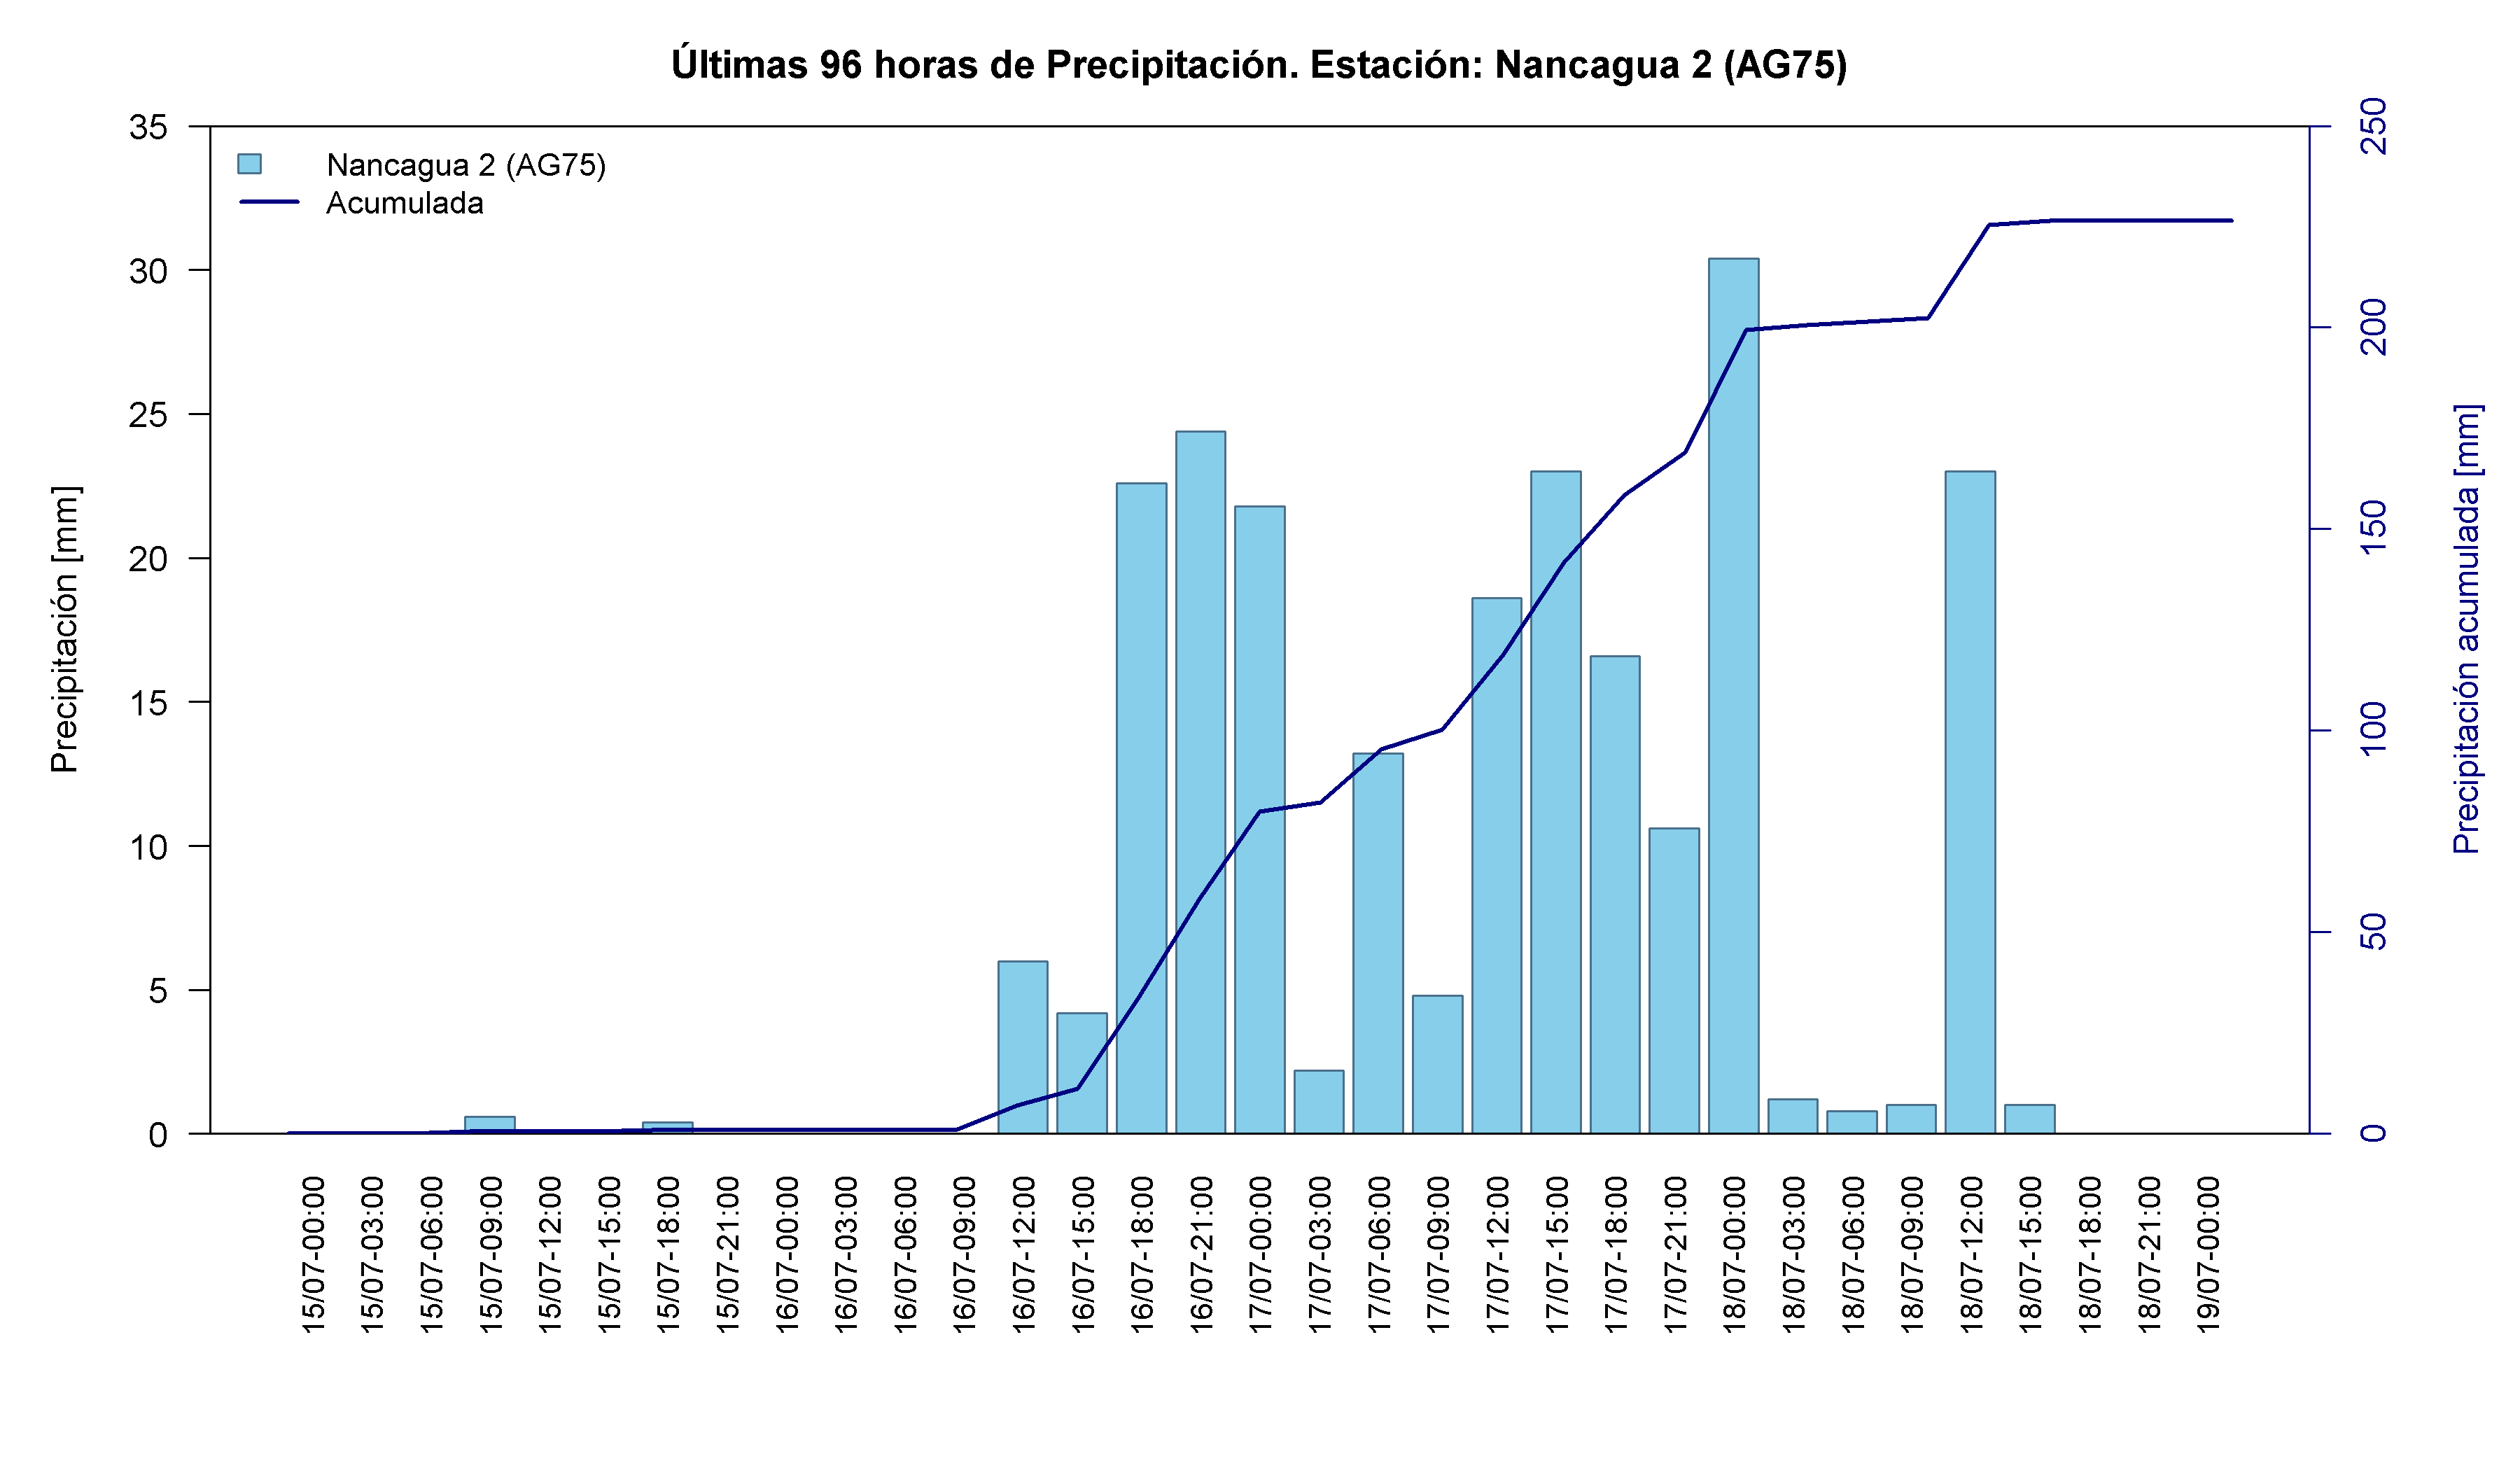
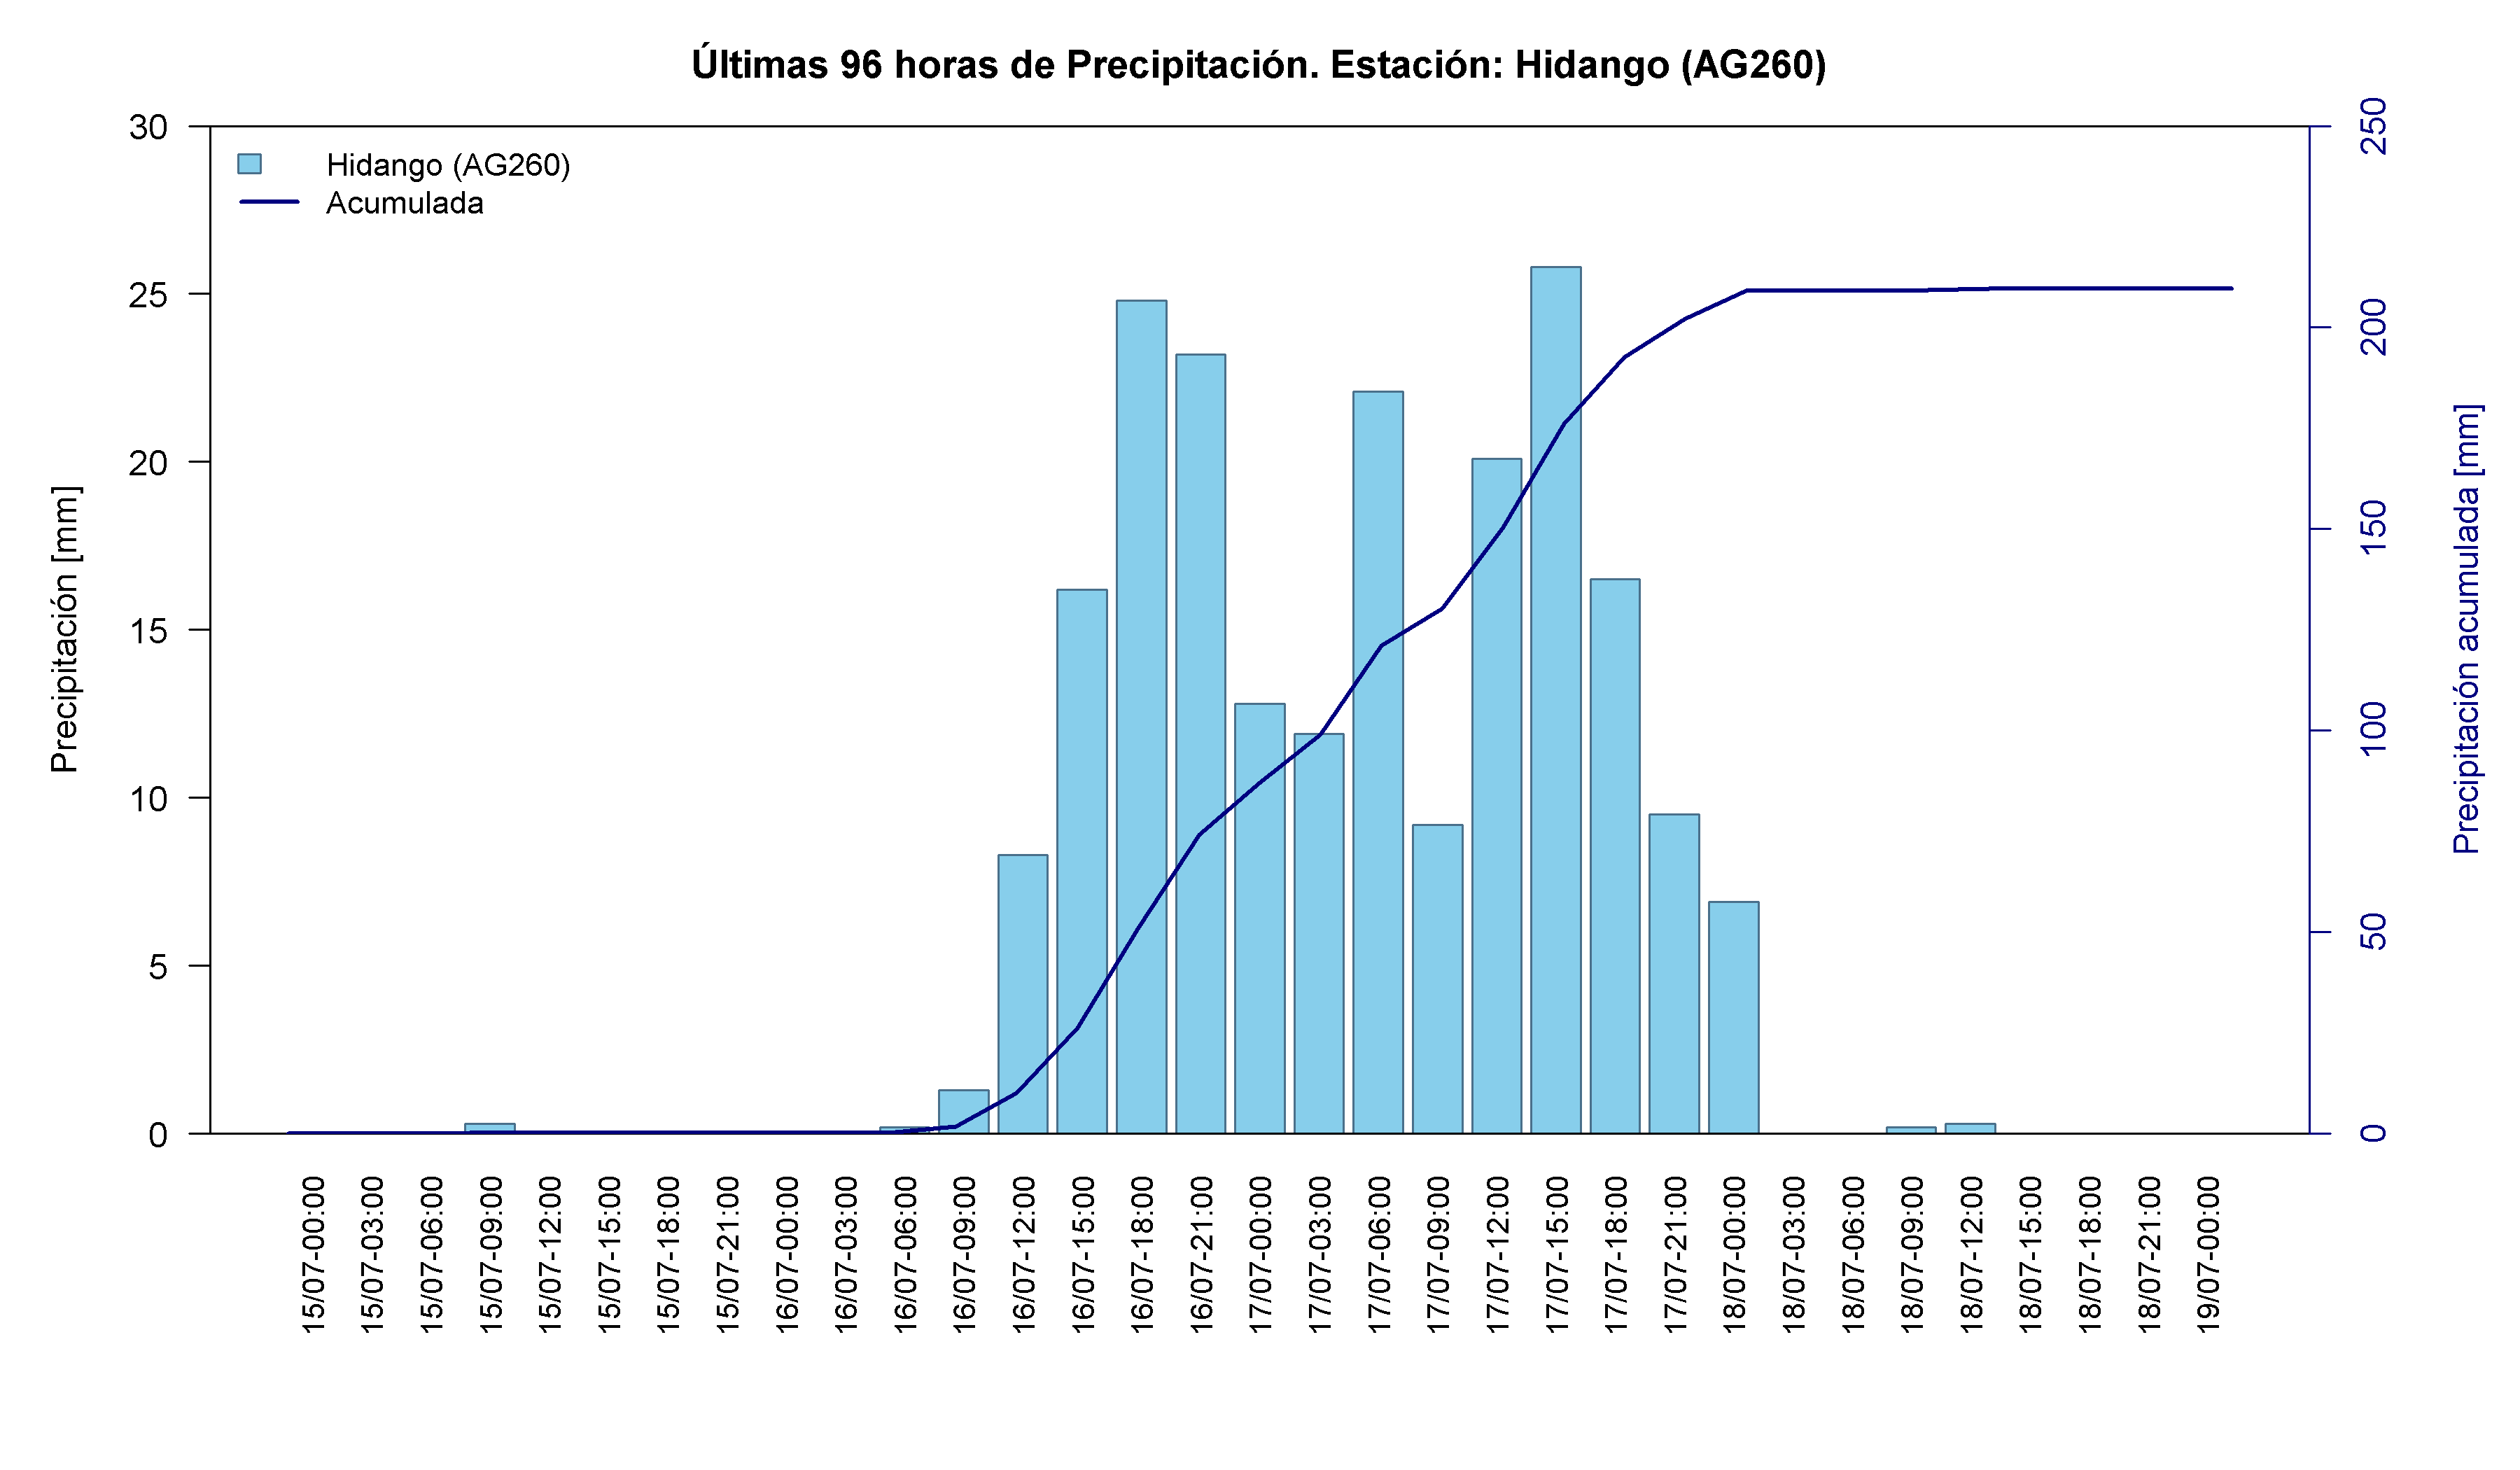
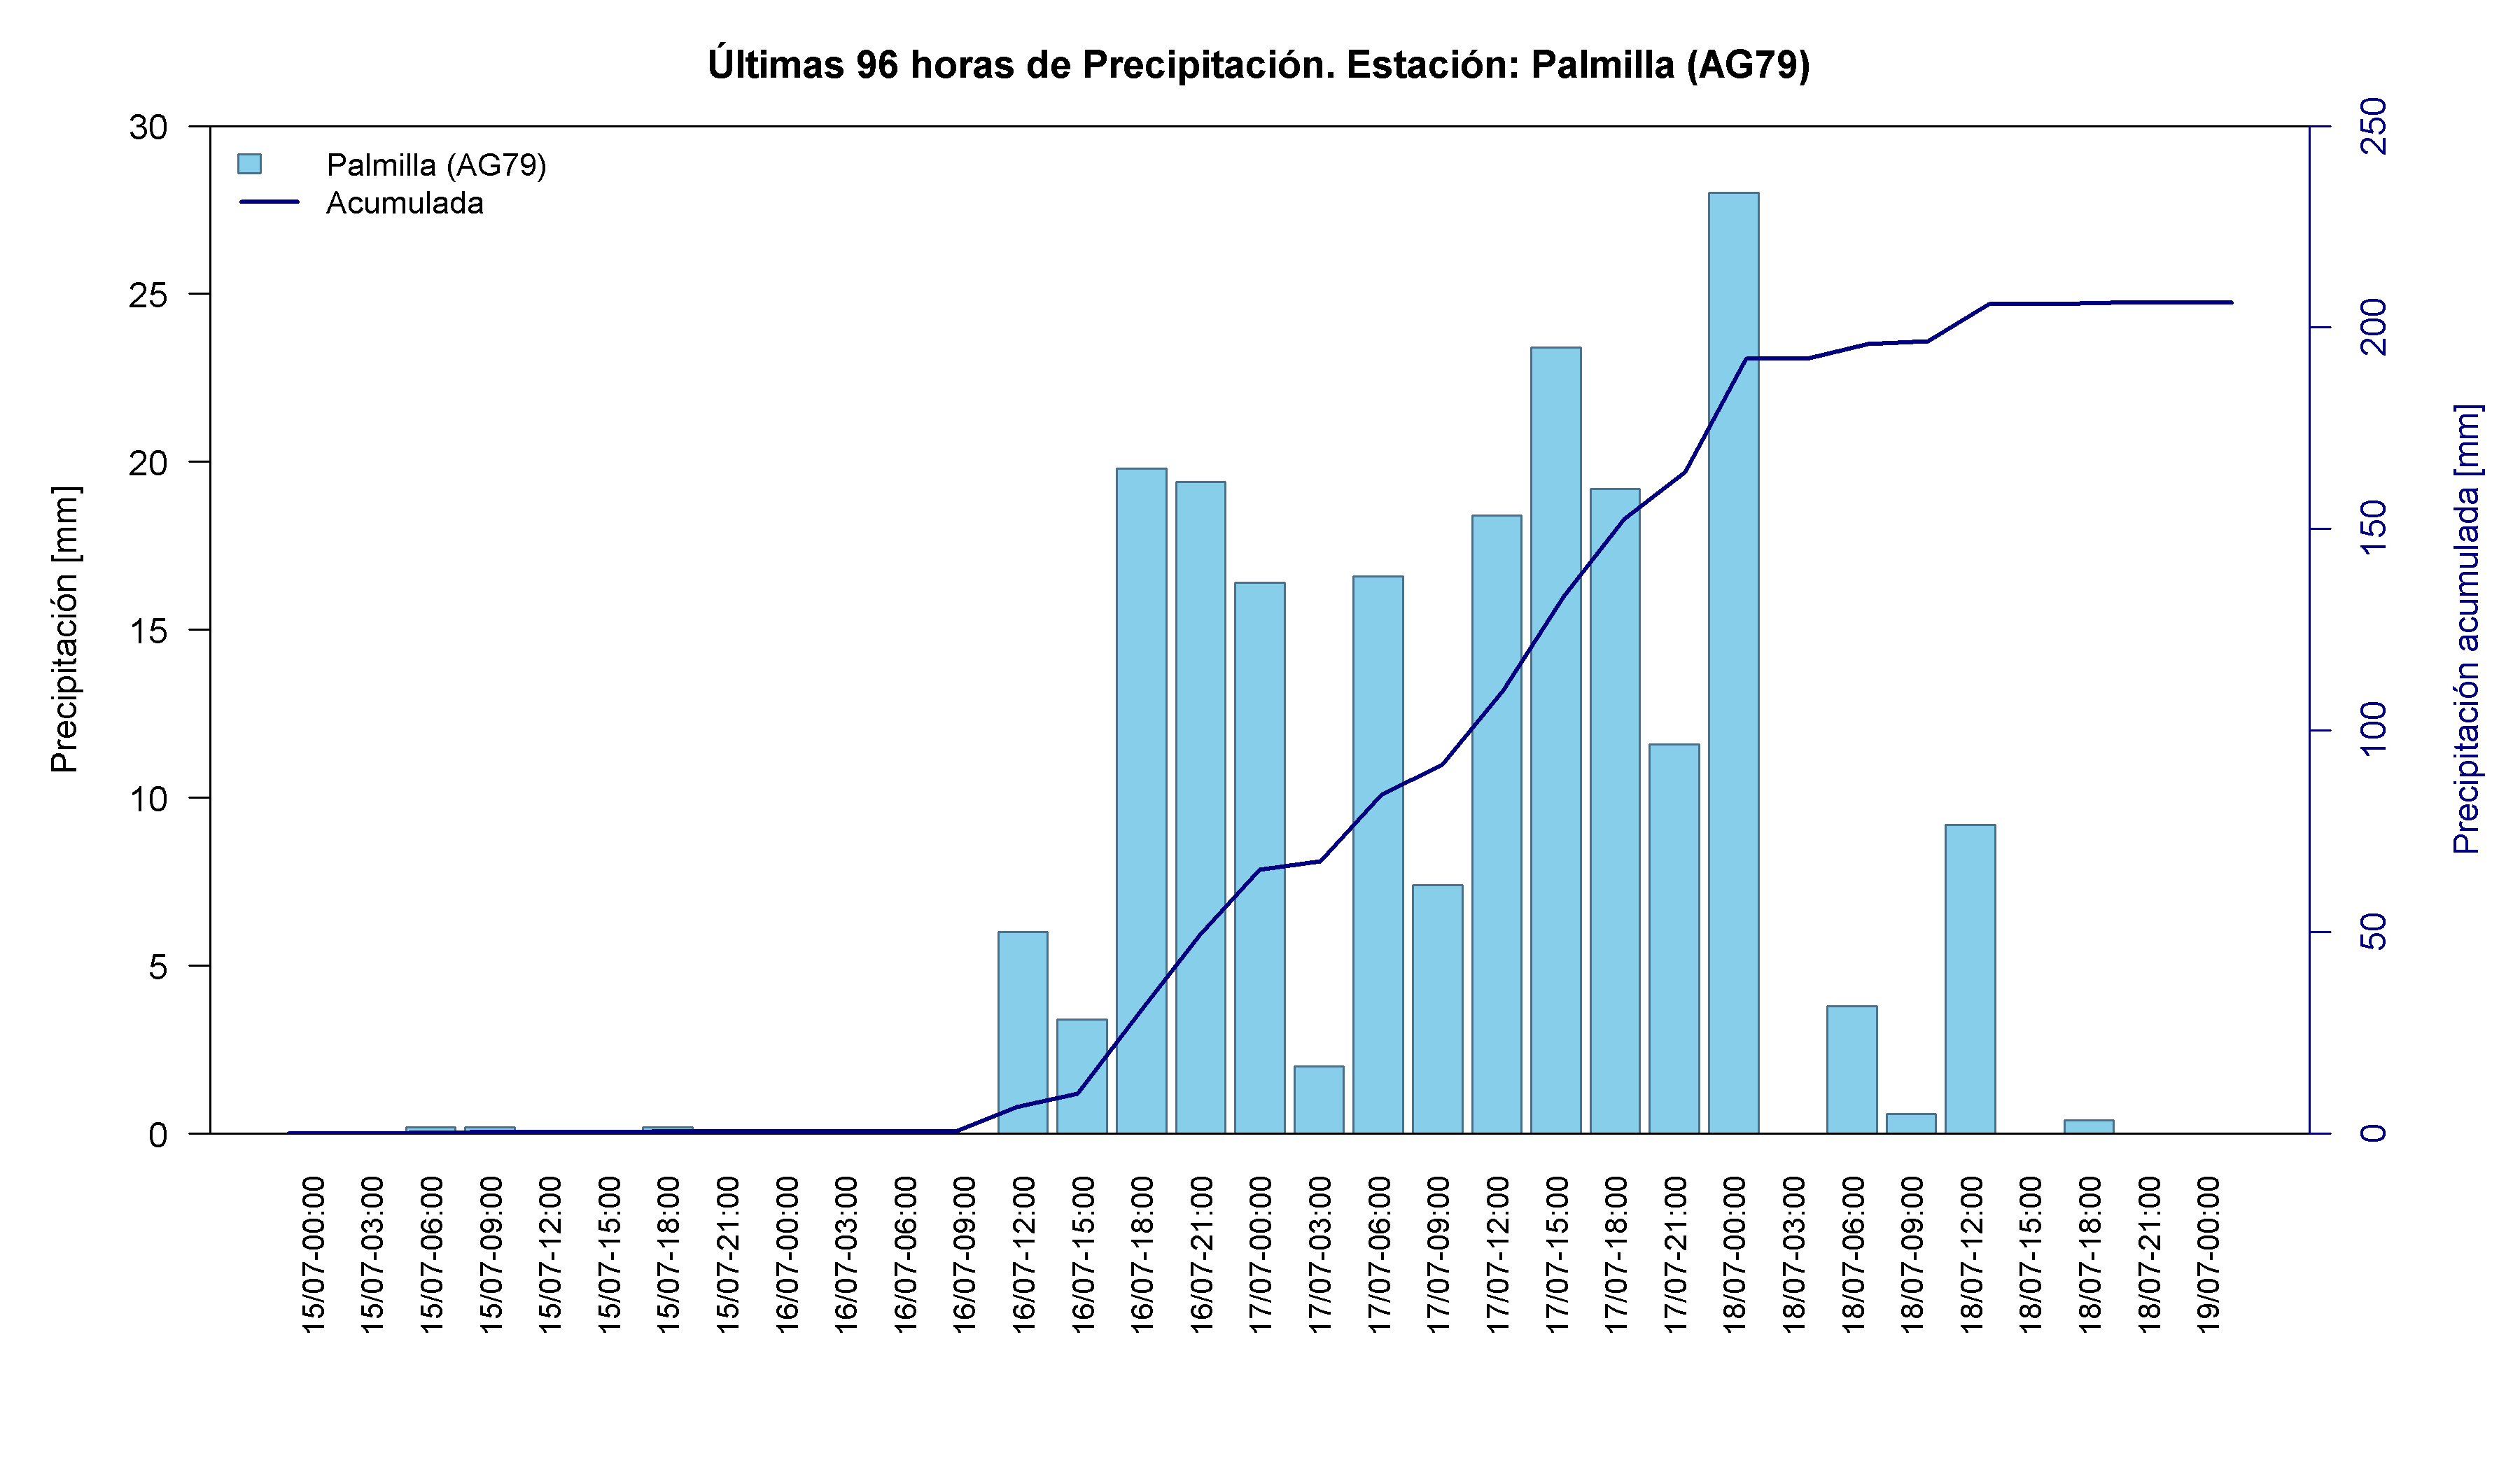
O’Higgins was dominated by a single, highly concentrated pulse between the night of 16 July and 17 July. Graneros Norte recorded 236.8 mm, while Nancagua 2, Hidango and Palmilla exceeded 200 mm. Their accumulation curves rise almost vertically over only a few hours, indicating the potential for rapid responses in channels, drainage systems and hillslopes.
Time series and interactive elements
Map 5. Location of the rain gauges analysed in the O’Higgins Region during the frontal-system event of 15-19 July 2026. Source: Authors’ analysis based on data from the VisMet meteorological viewer .
Table 5. Accumulated precipitation recorded at rain gauges in the O’Higgins Region between 15 and 19 July 2026. Source: Authors’ analysis based on data from the VisMet meteorological viewer .
Maule Region
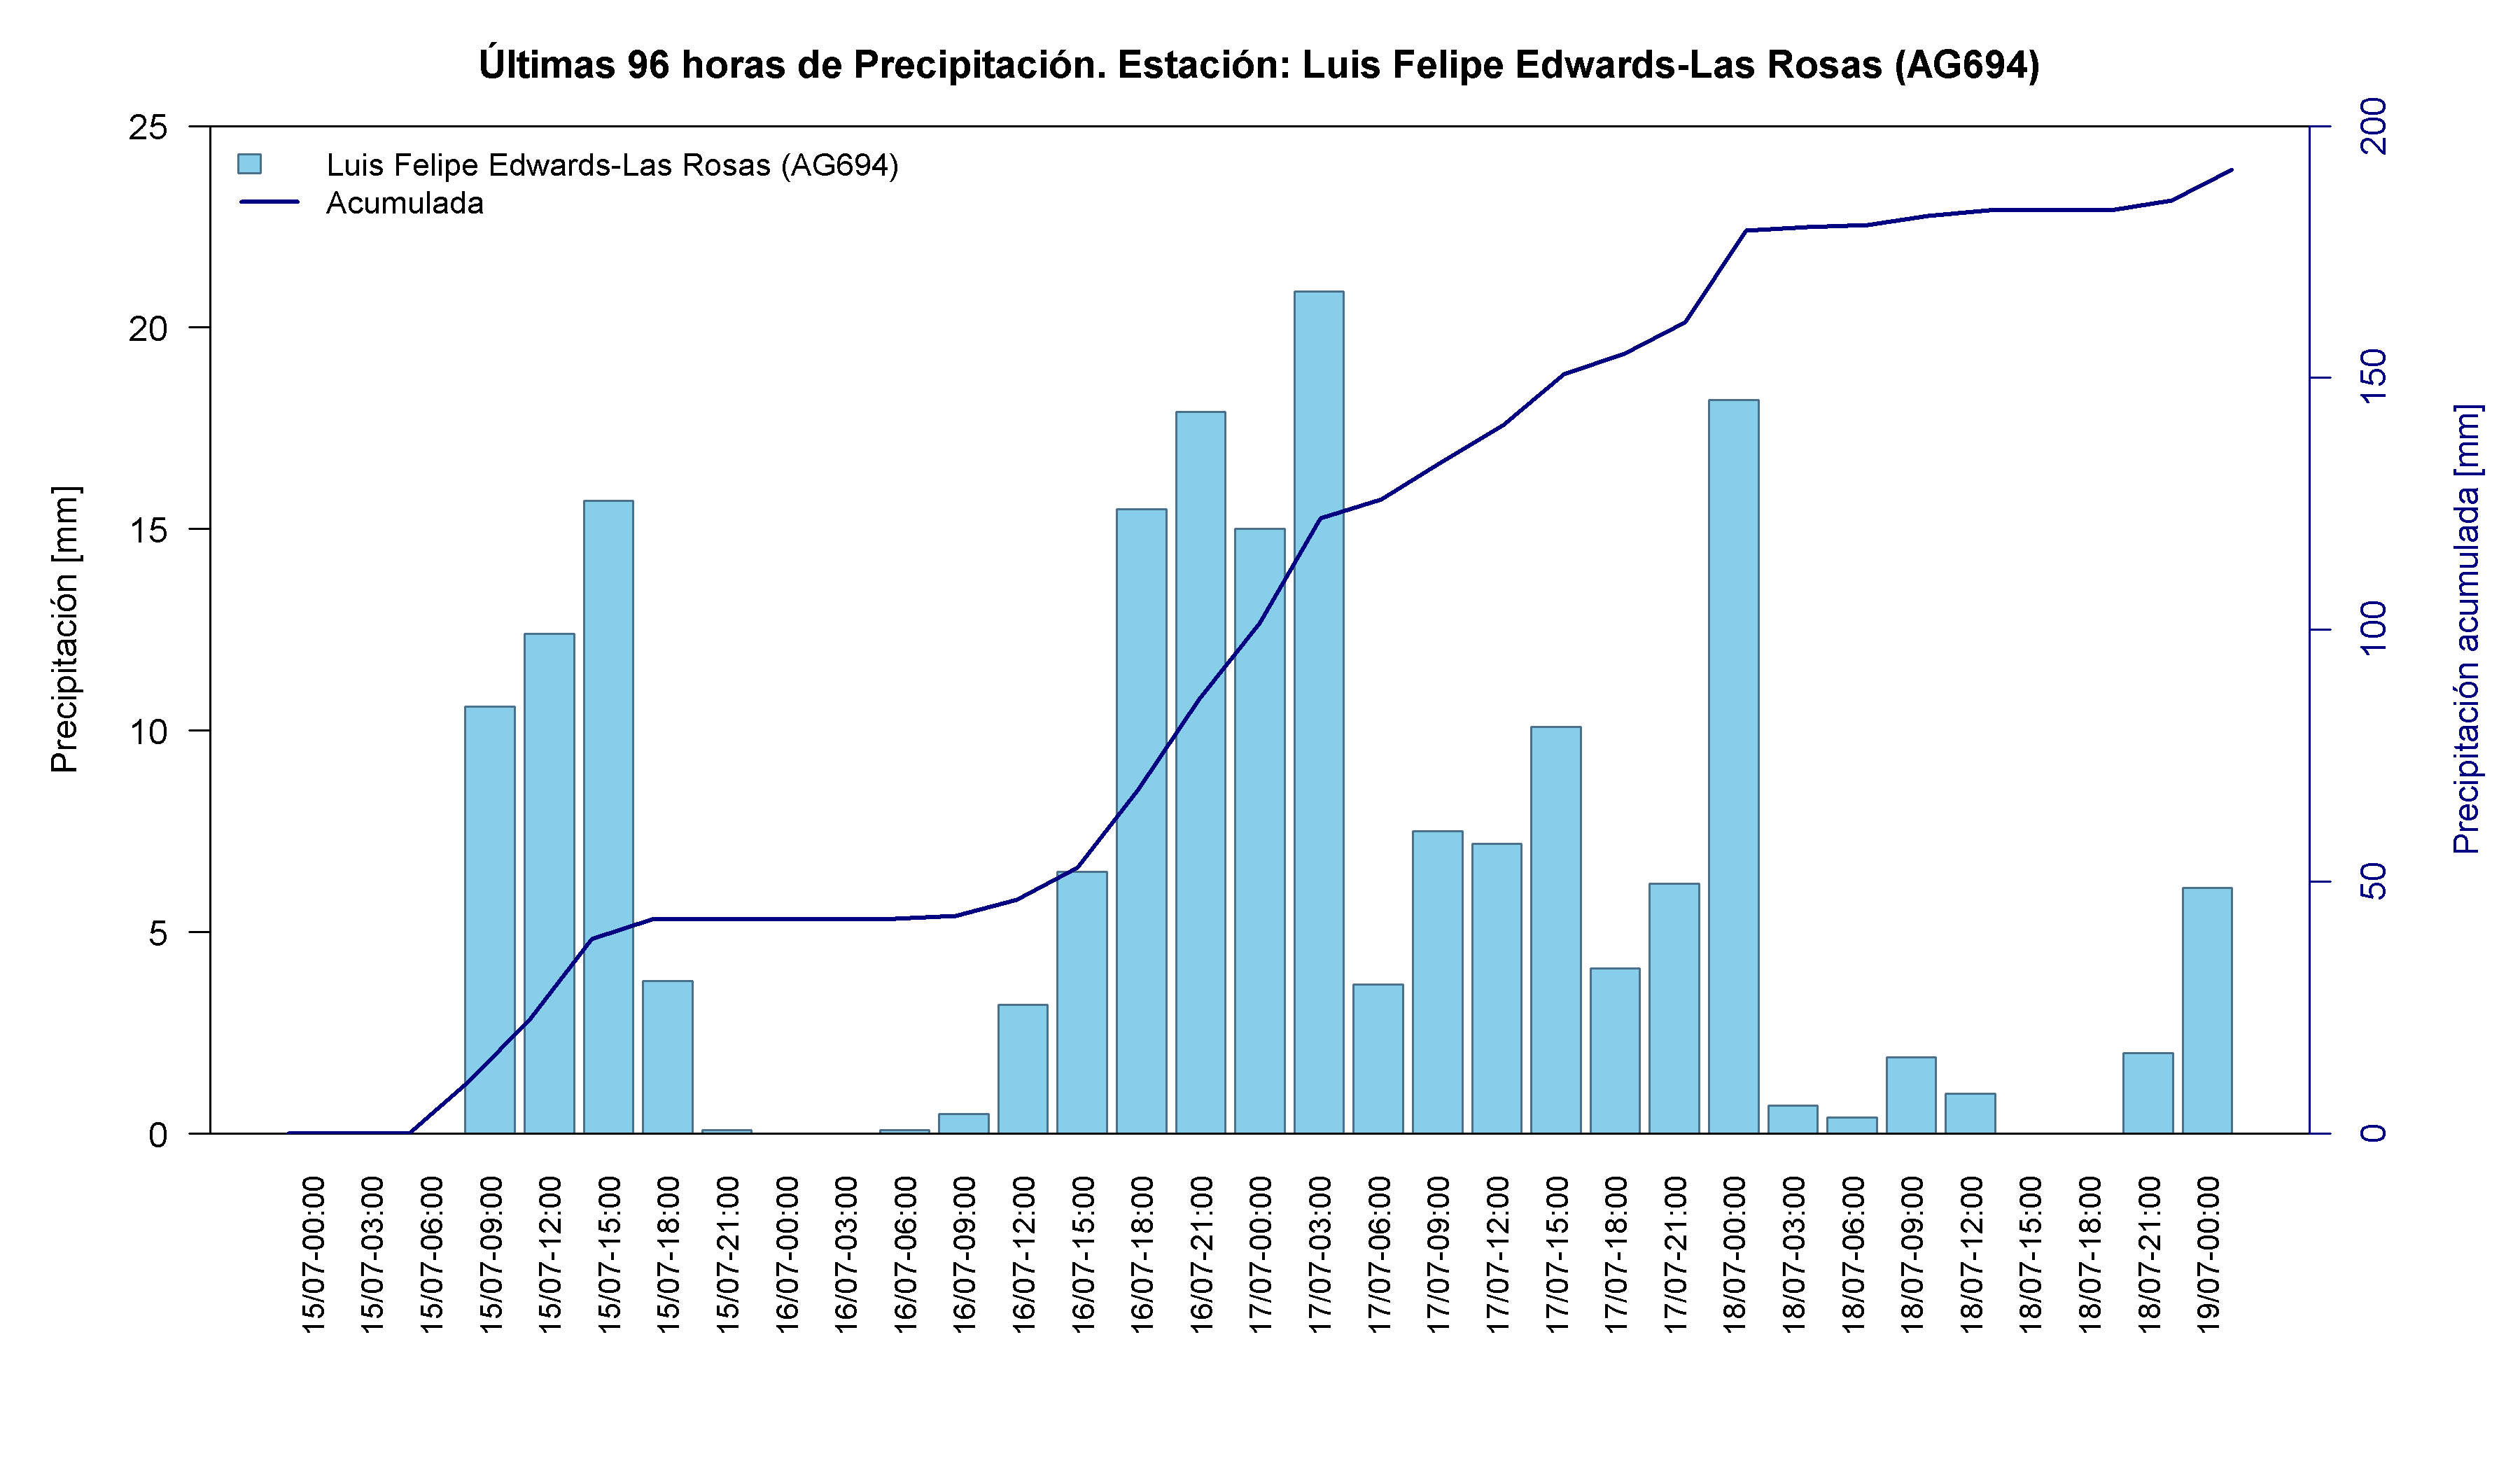
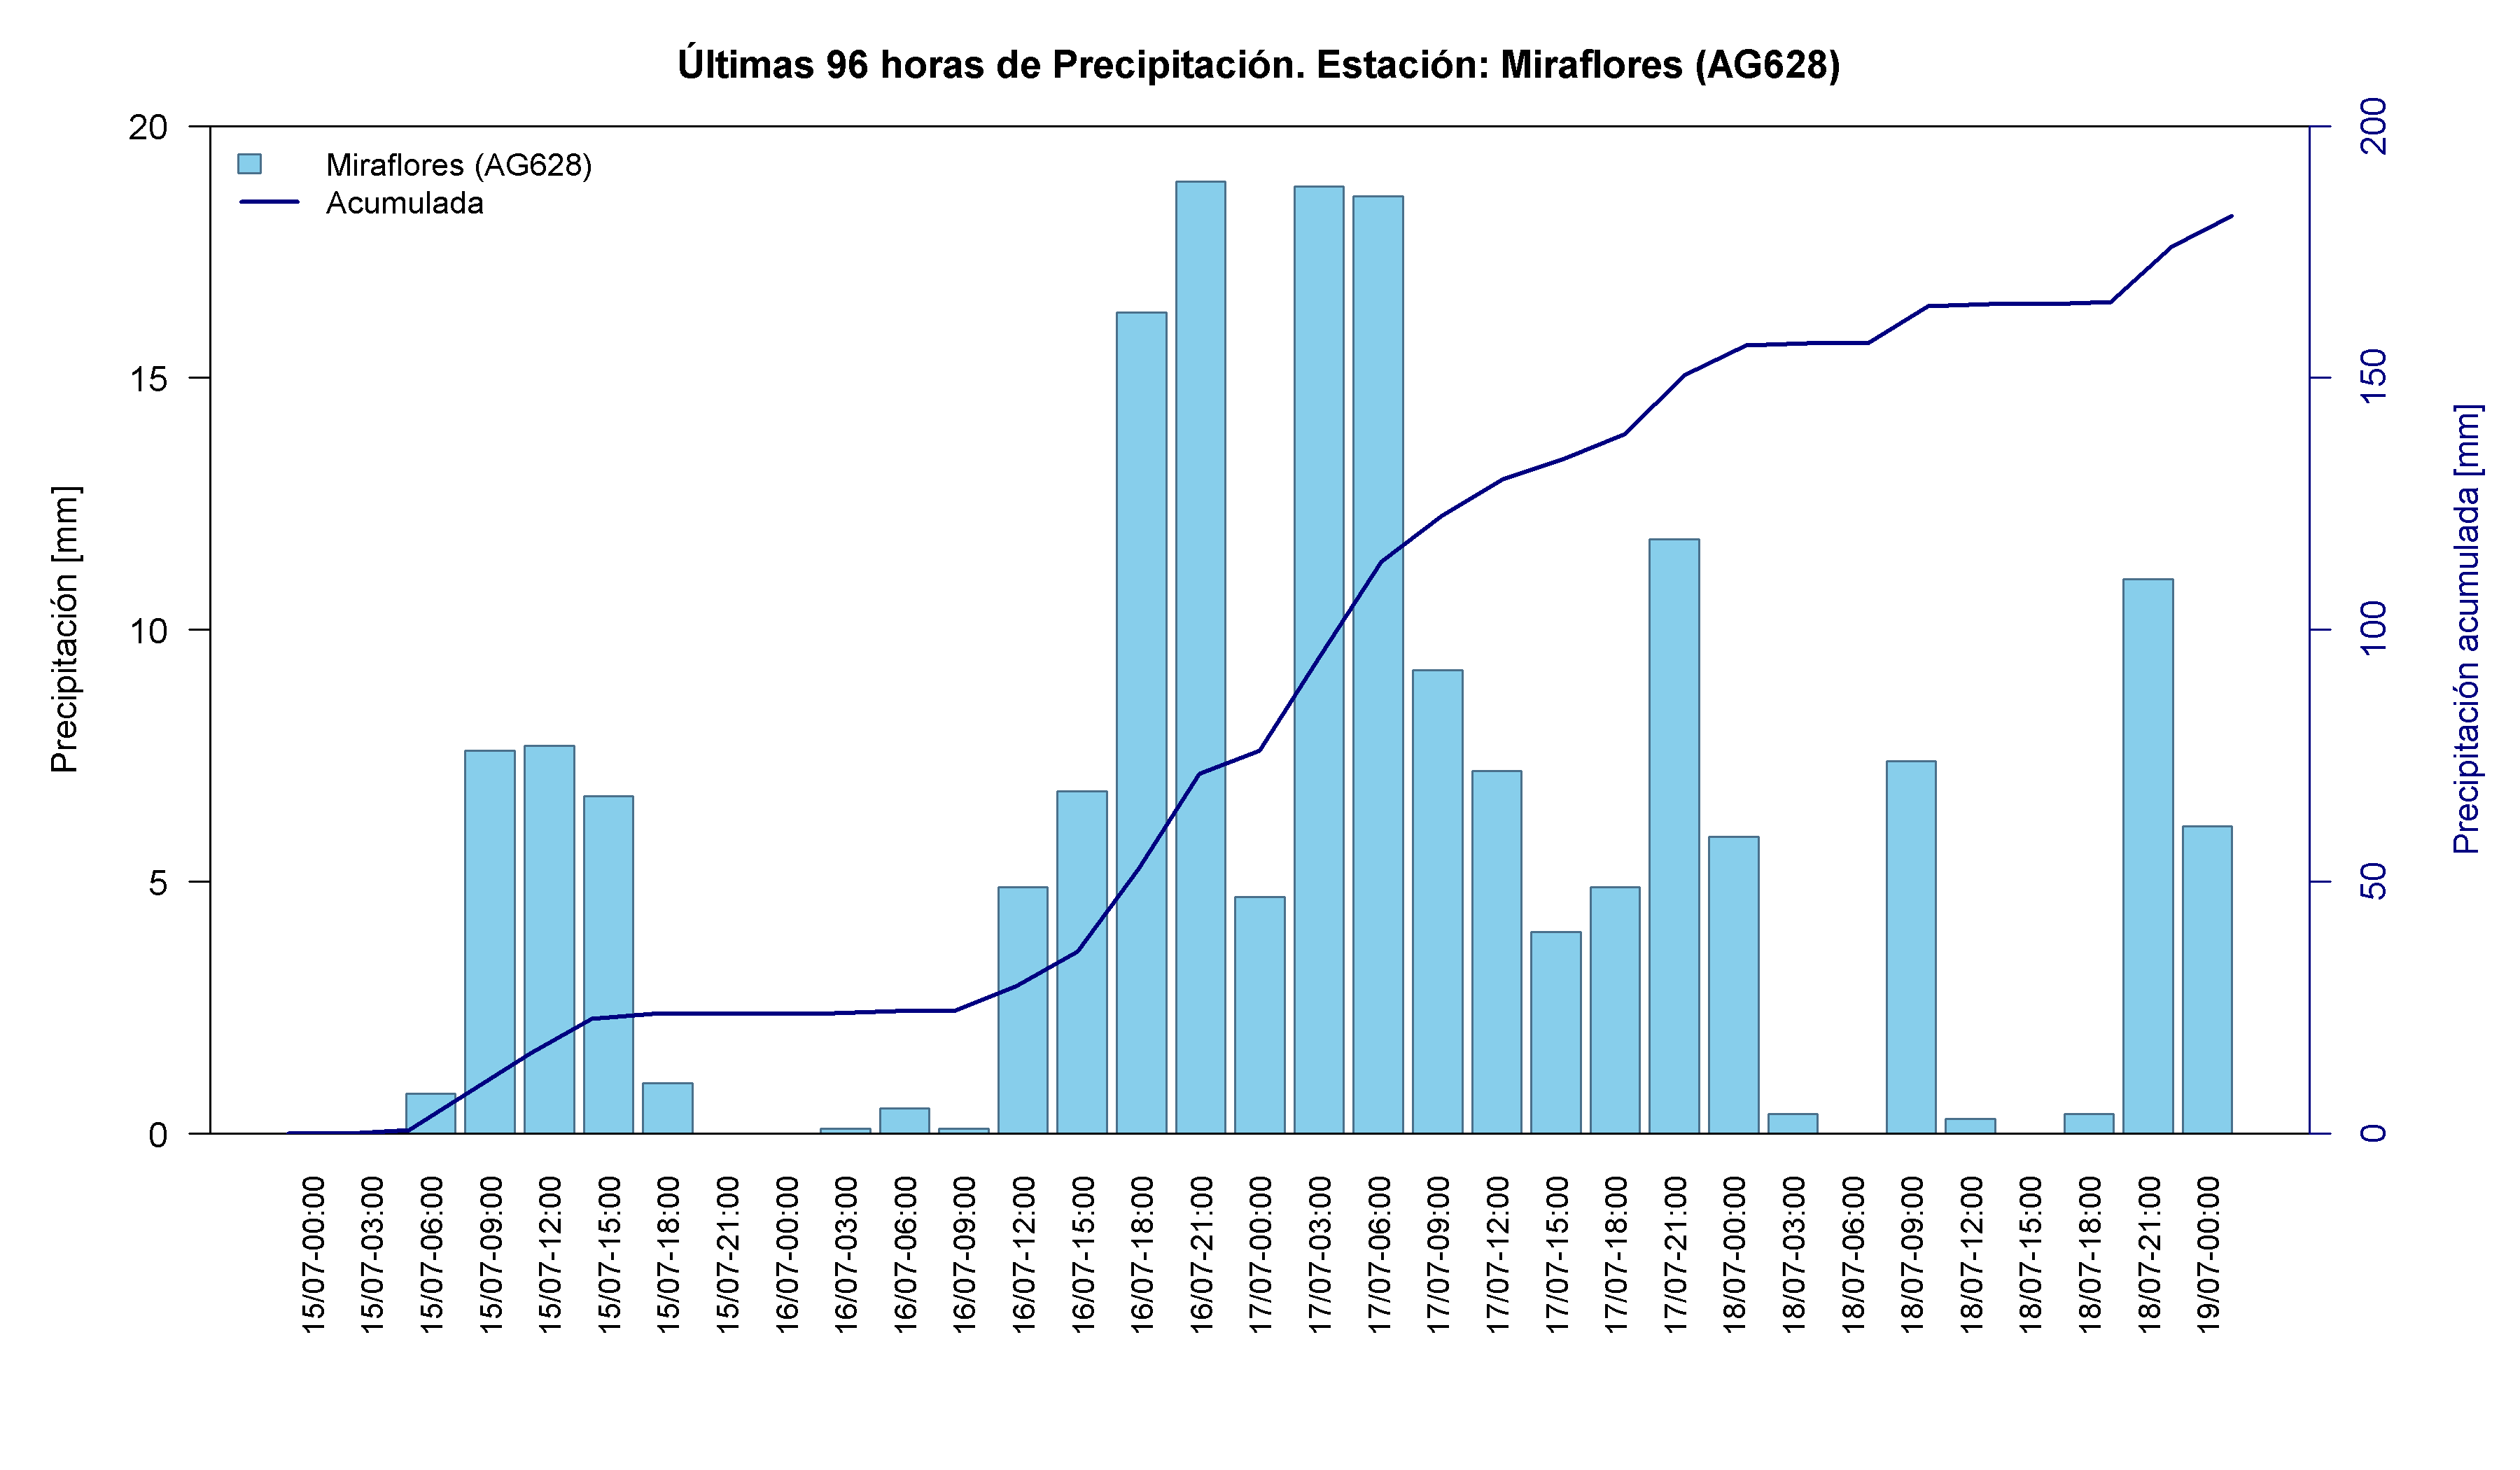
Maule marked the transition between the earlier south-central pulses and the central-Chile maximum. Some gauges peaked on 15 July and others on 17 July, showing the passage of successive frontal rainbands. Totals at the four highlighted stations ranged from 177.7 to 195.9 mm.
Time series and interactive elements
Map 6. Location of the rain gauges analysed in the Maule Region during the frontal-system event of 15-19 July 2026. Source: Authors’ analysis based on data from the VisMet meteorological viewer .
Table 6. Accumulated precipitation recorded at rain gauges in the Maule Region between 15 and 19 July 2026. Source: Authors’ analysis based on data from the VisMet meteorological viewer .
Ñuble Region
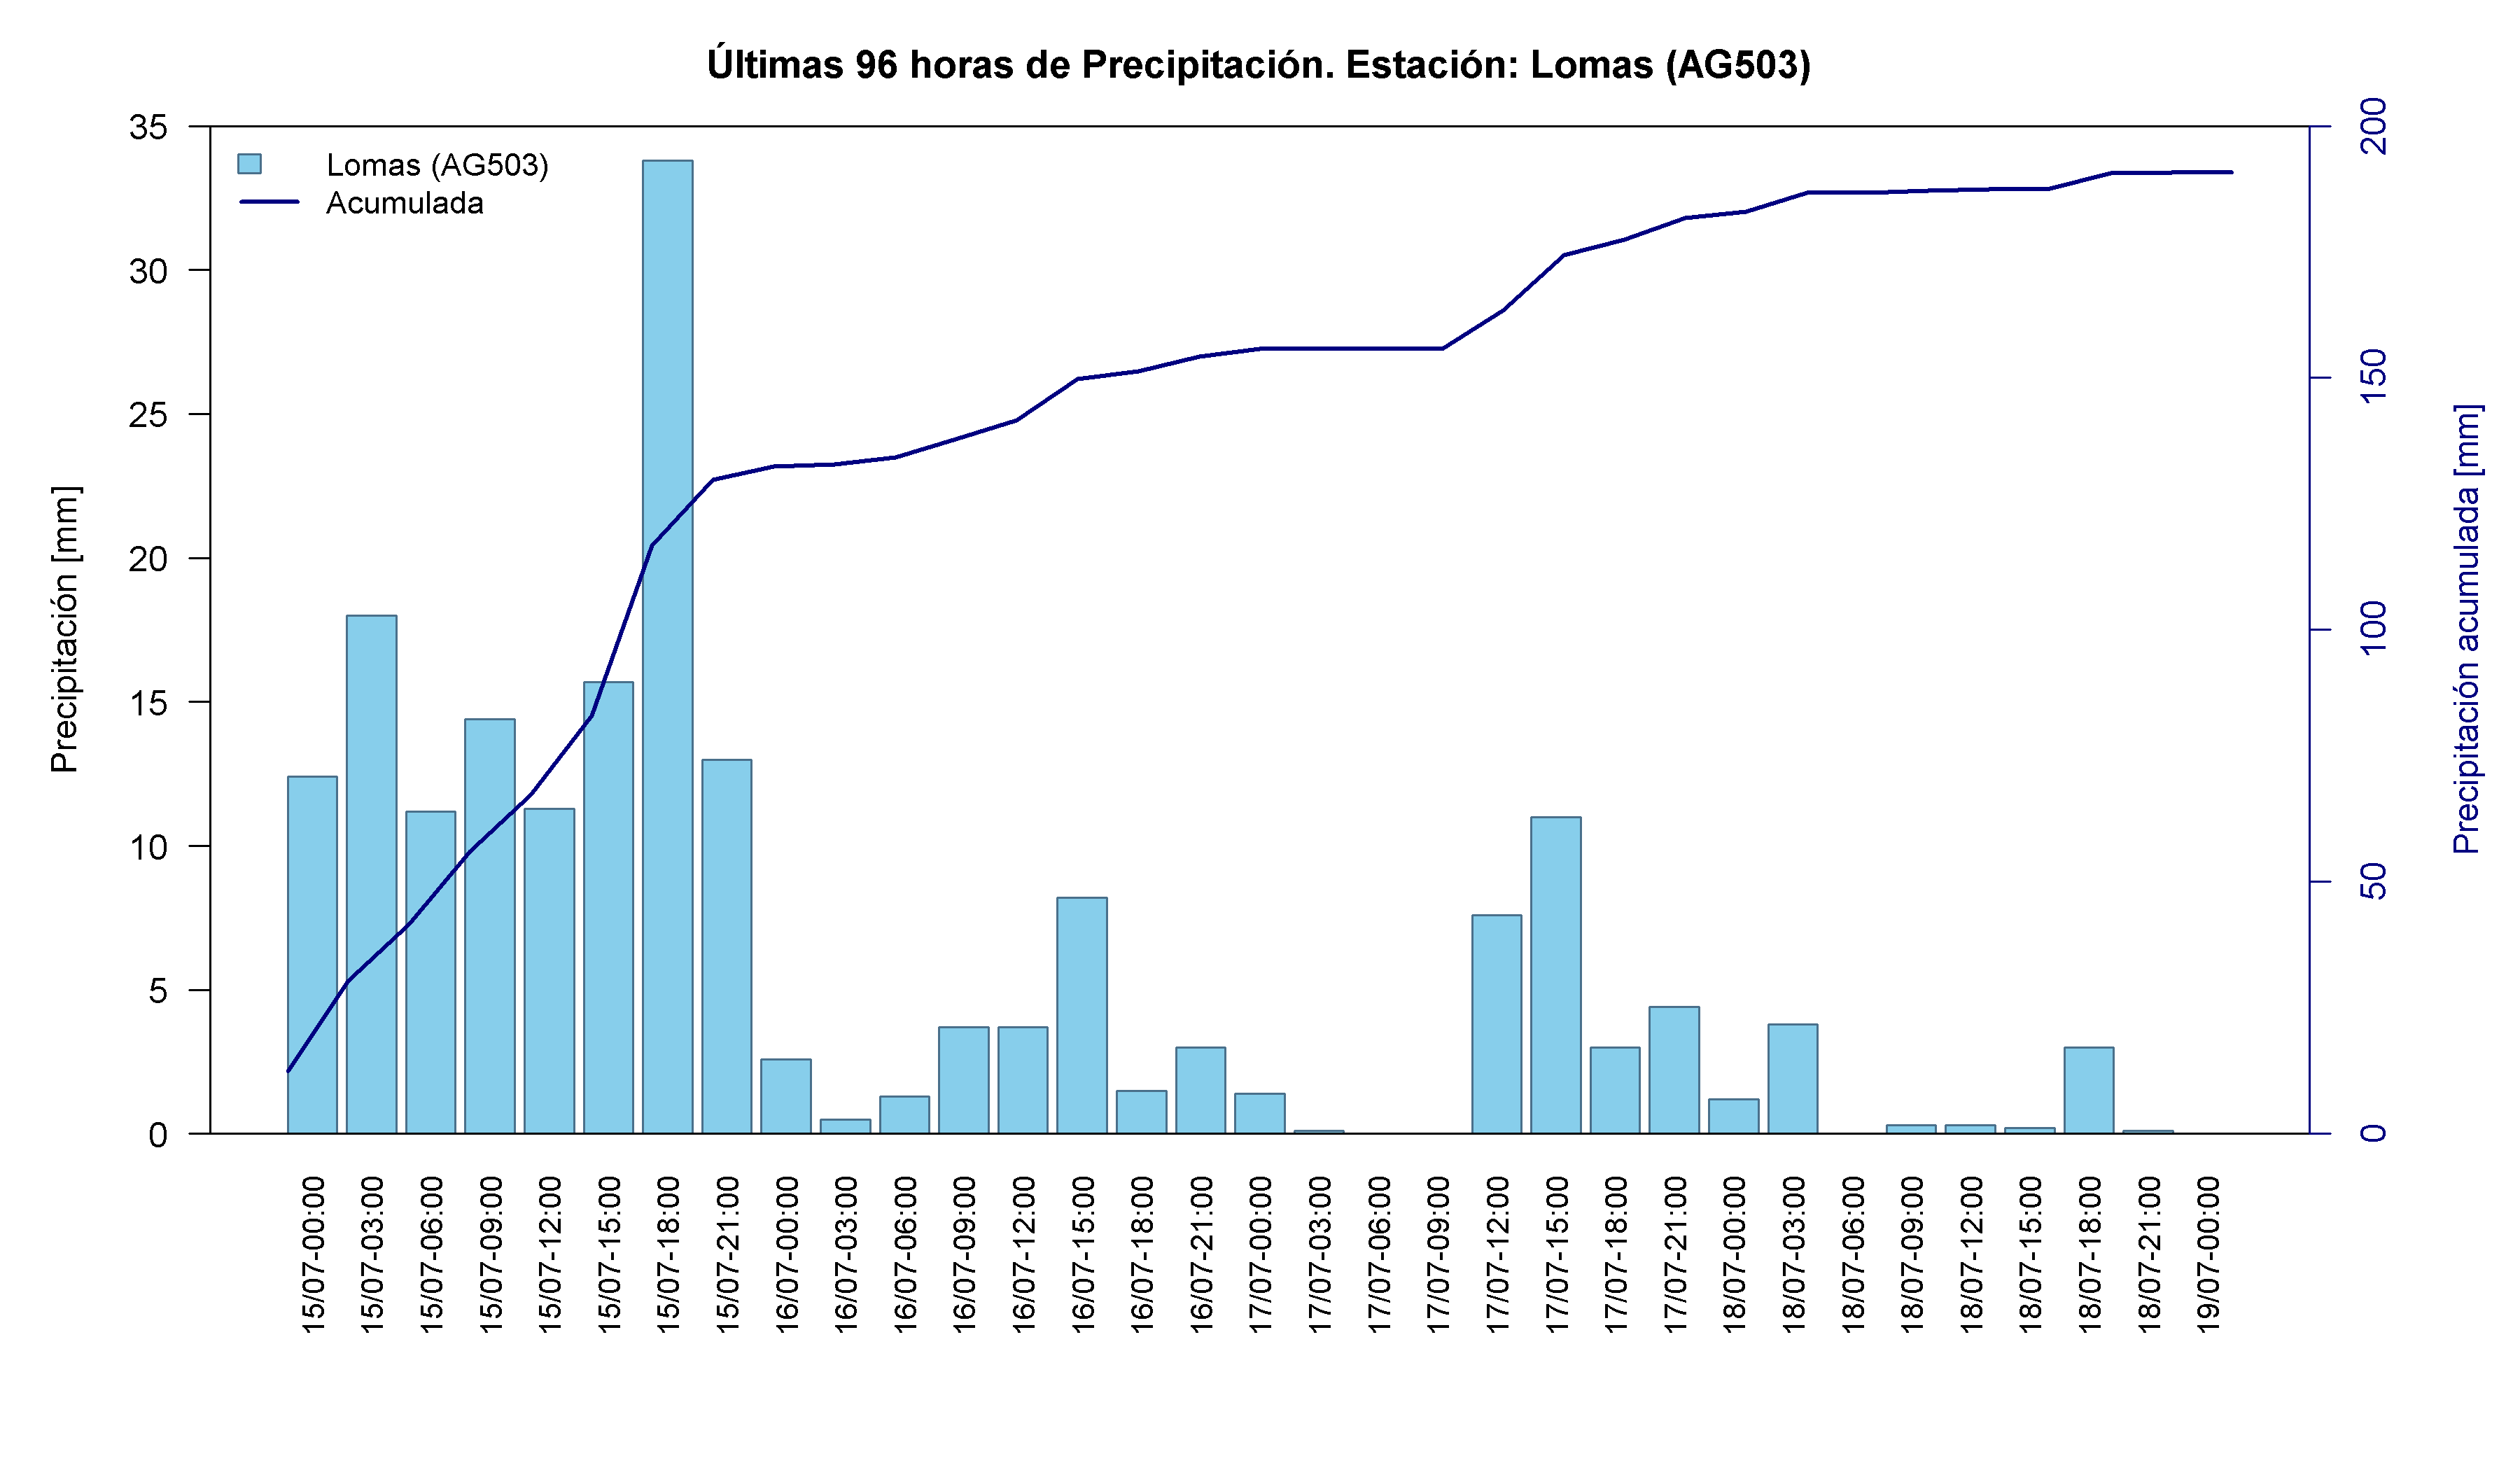
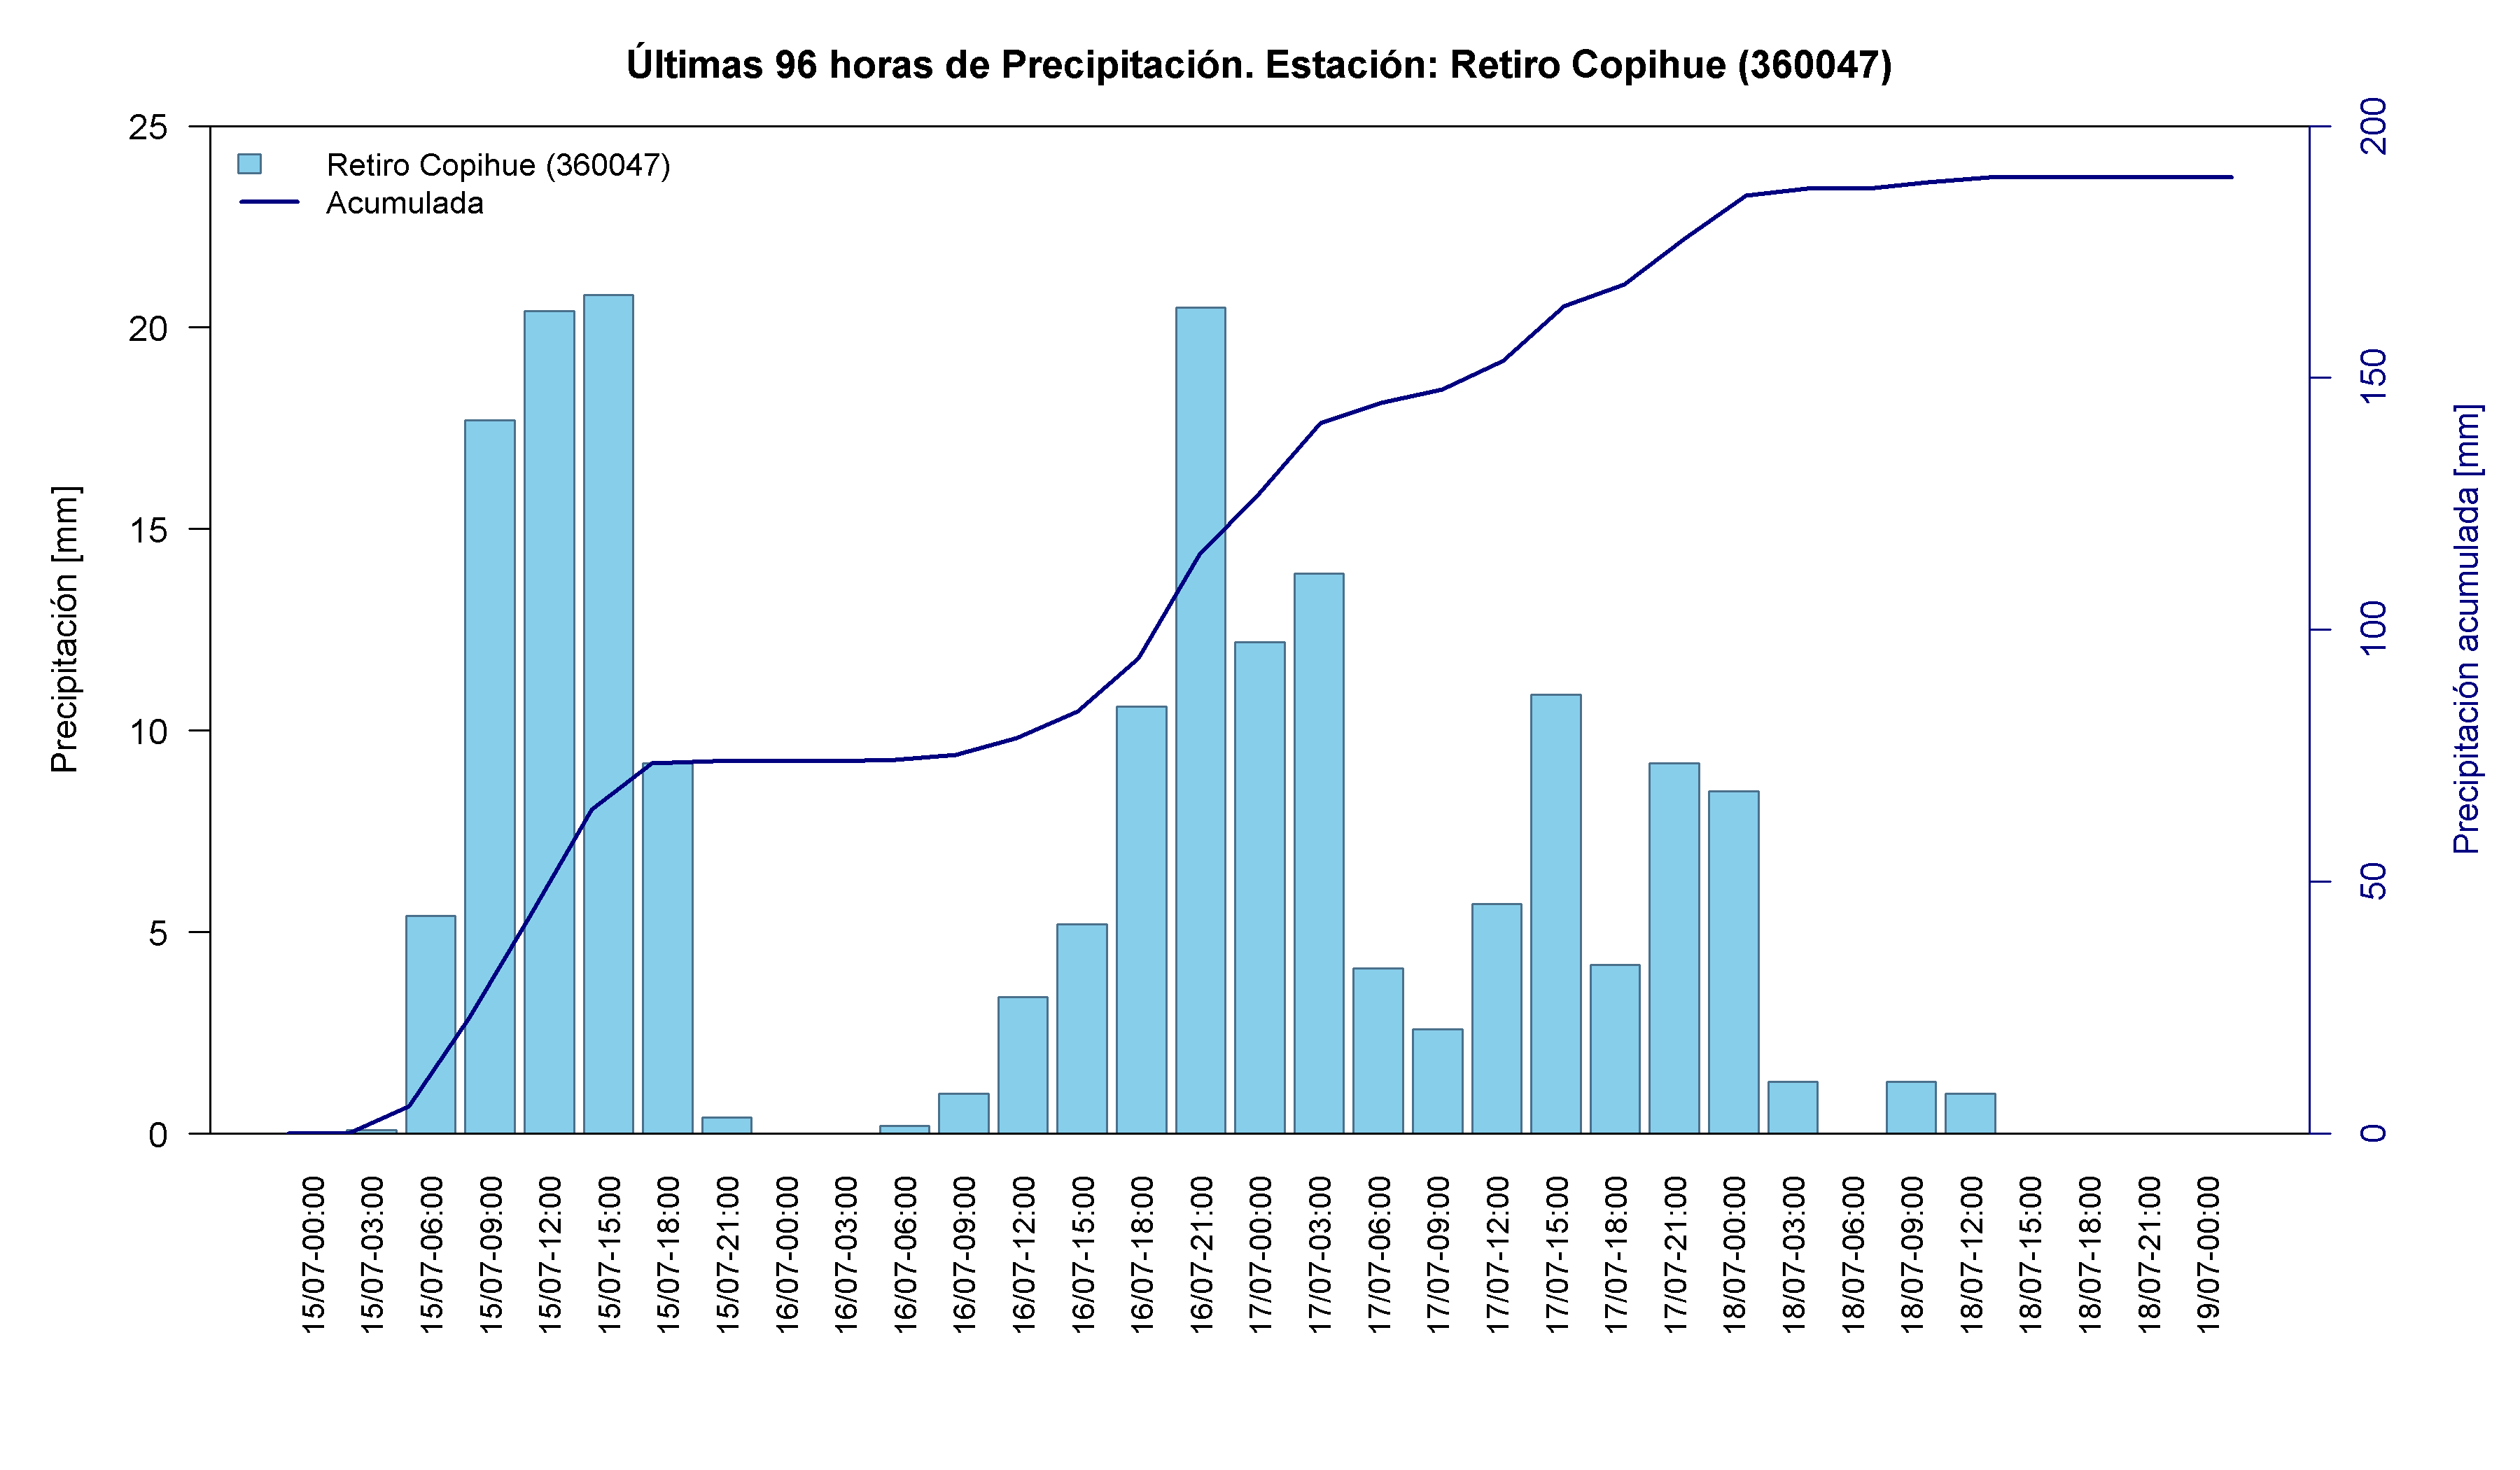
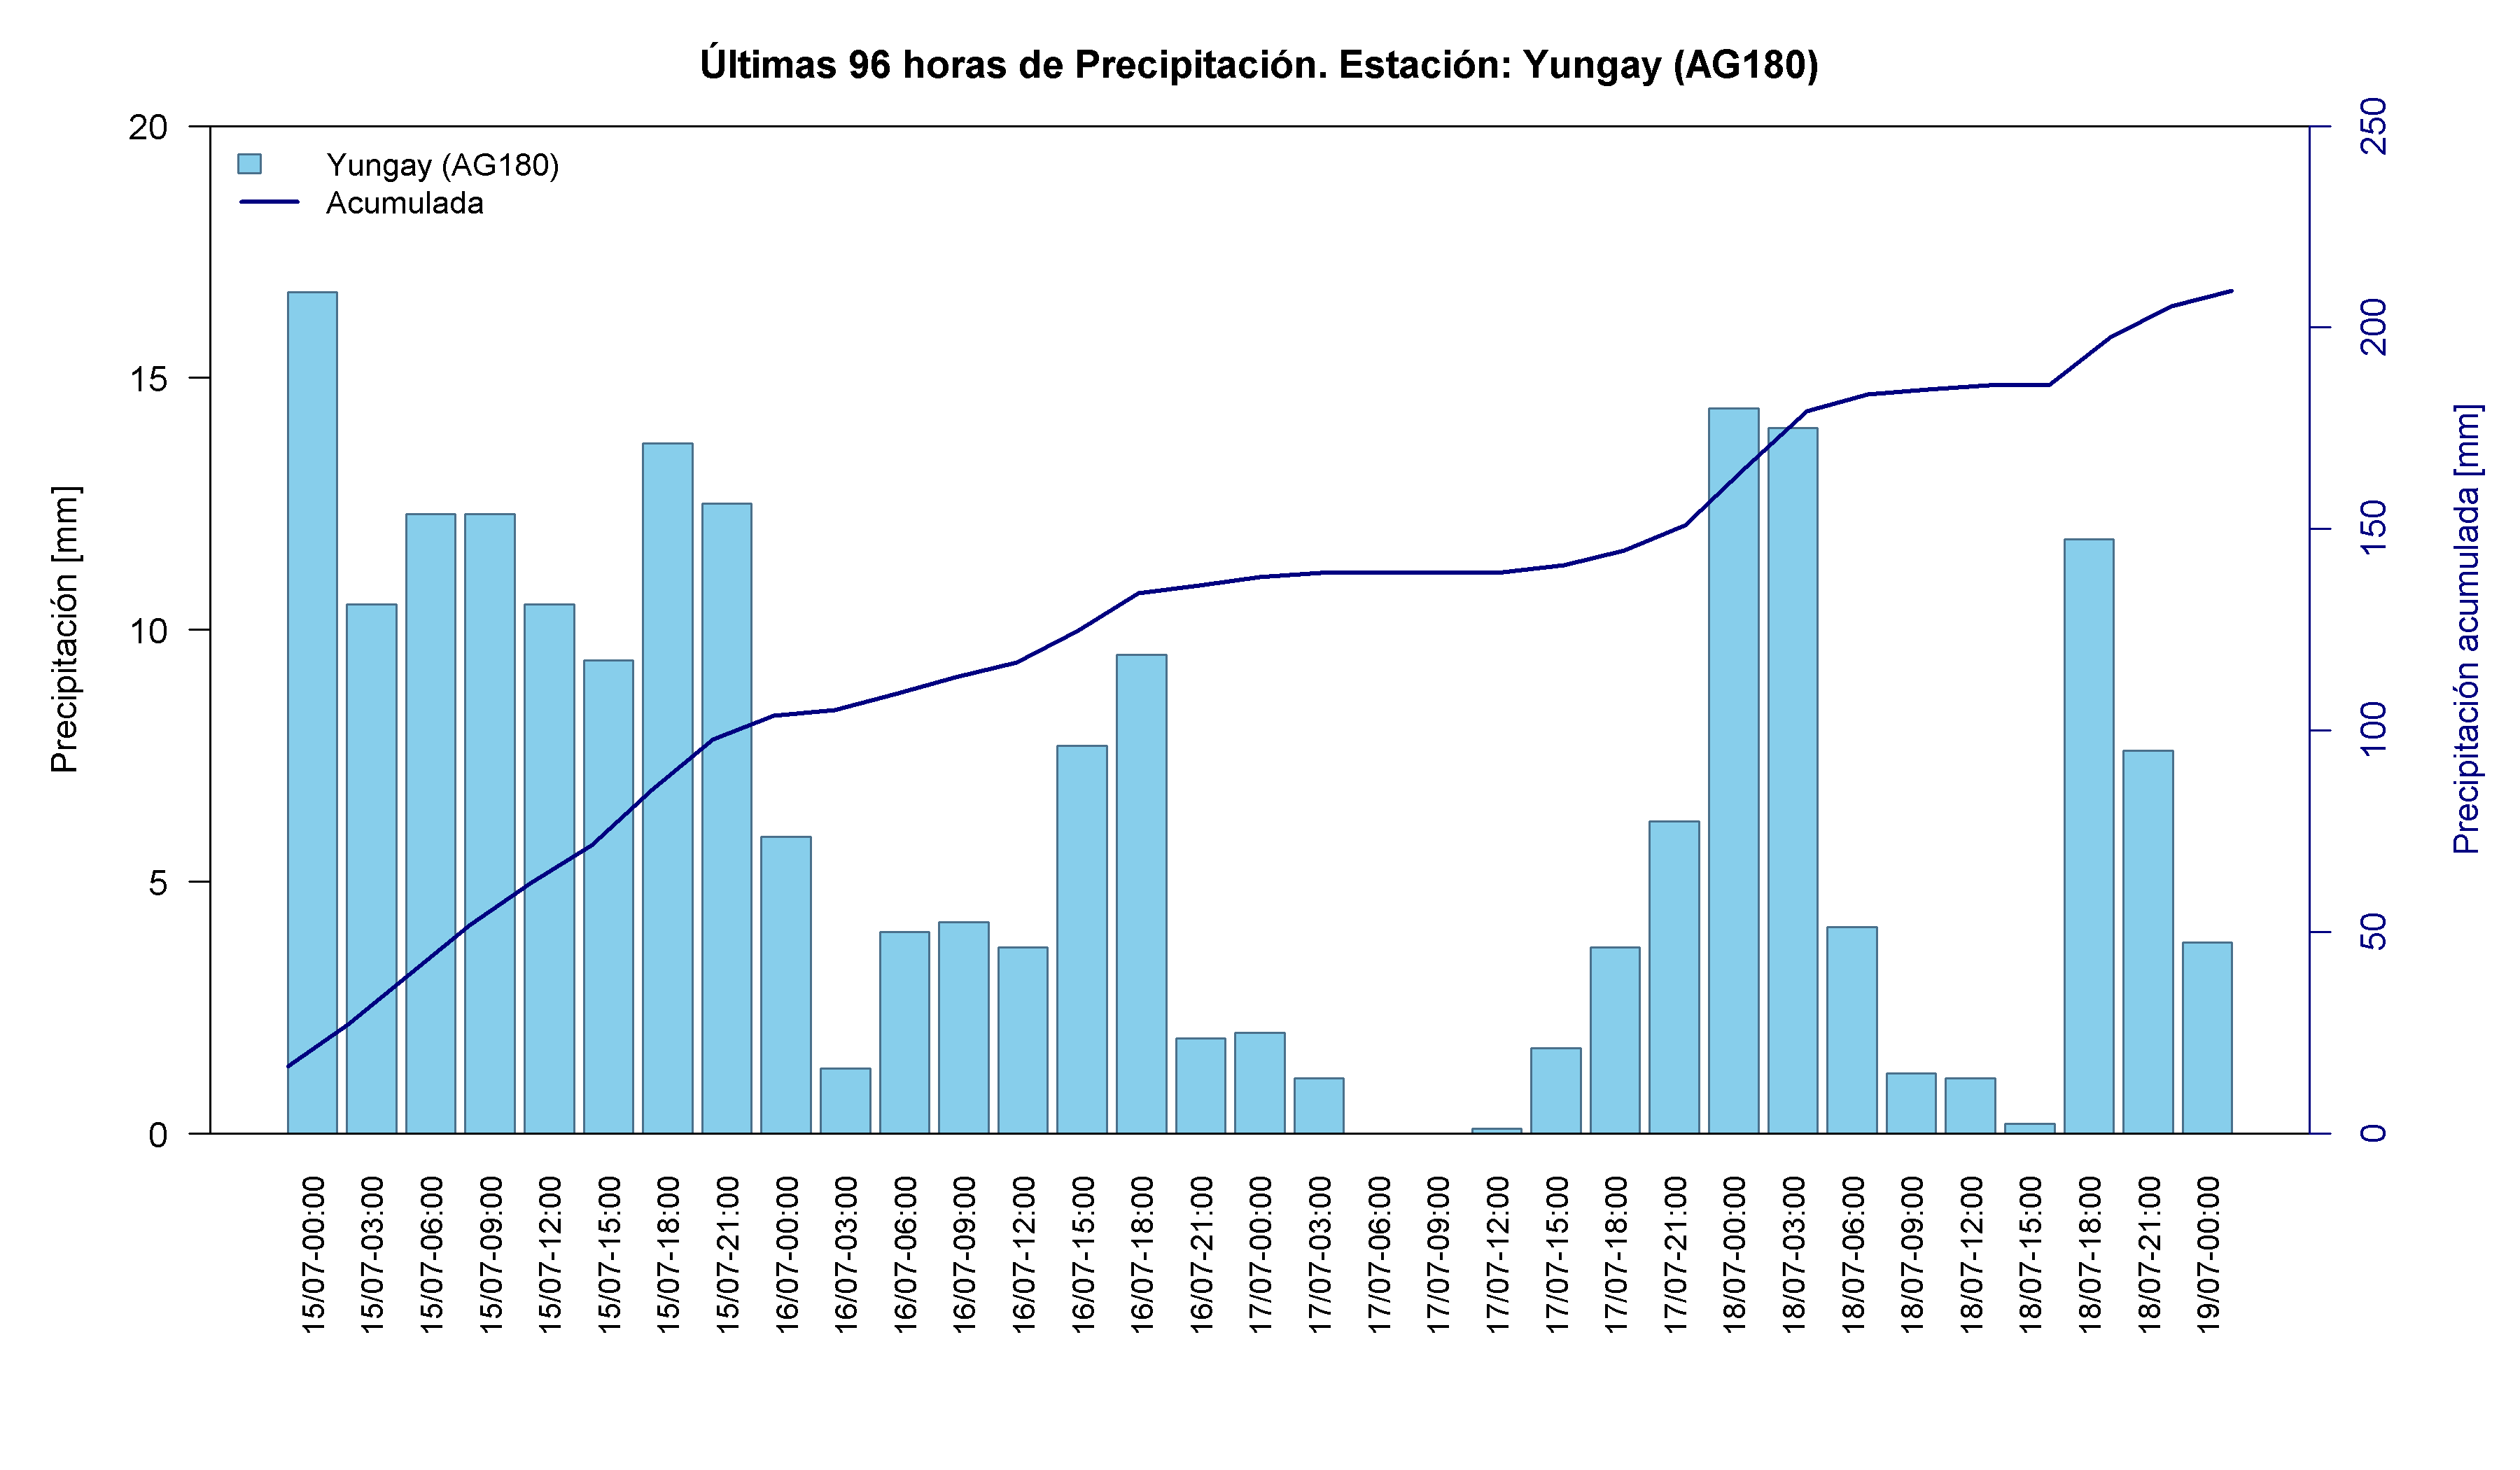
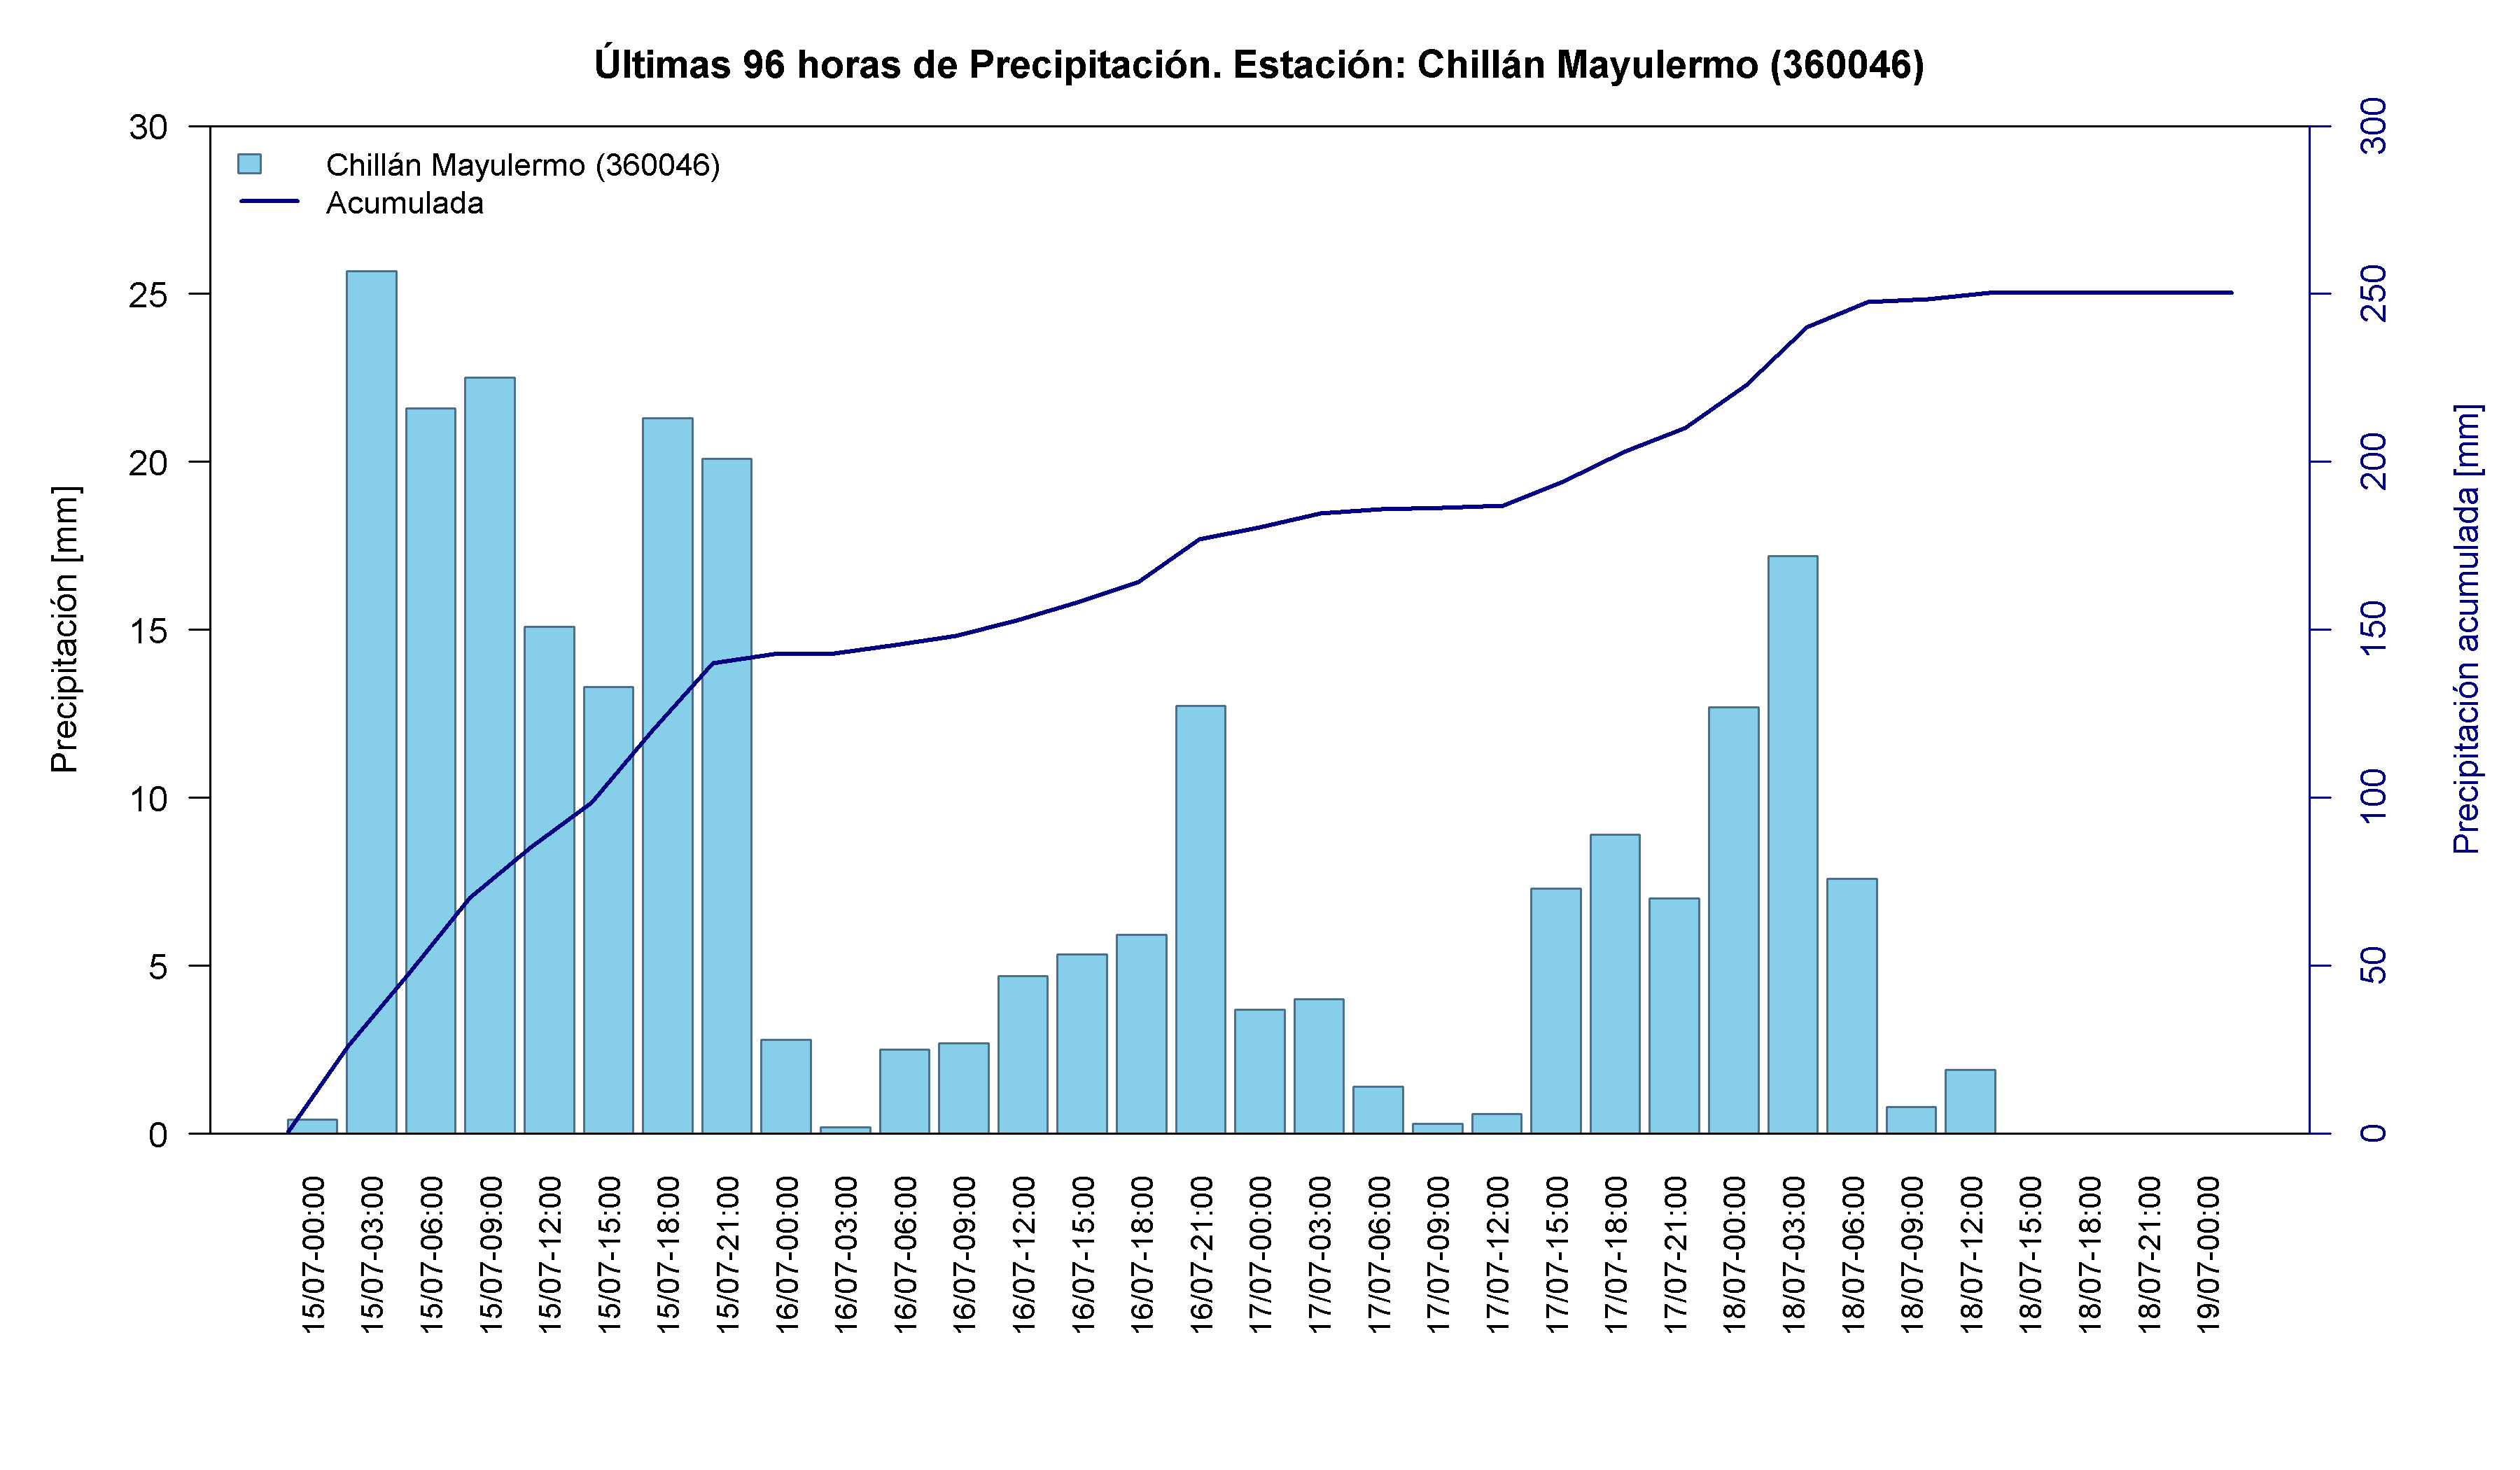
Ñuble received two distinct rainfall pulses over already wet ground. Yungay accumulated 217.5 mm, and Chillán Mayulermo recorded 140.0 mm on 15 July. Repeated heavy rainfall, rather than one isolated peak, increased soil saturation and reduced catchment storage capacity.
Time series and interactive elements
Map 7. Location of the rain gauges analysed in the Ñuble Region during the frontal-system event of 15-19 July 2026. Source: Authors’ analysis based on data from the VisMet meteorological viewer .
Table 7. Accumulated precipitation recorded at rain gauges in the Ñuble Region between 15 and 19 July 2026. Source: Authors’ analysis based on data from the VisMet meteorological viewer .
Biobío Region
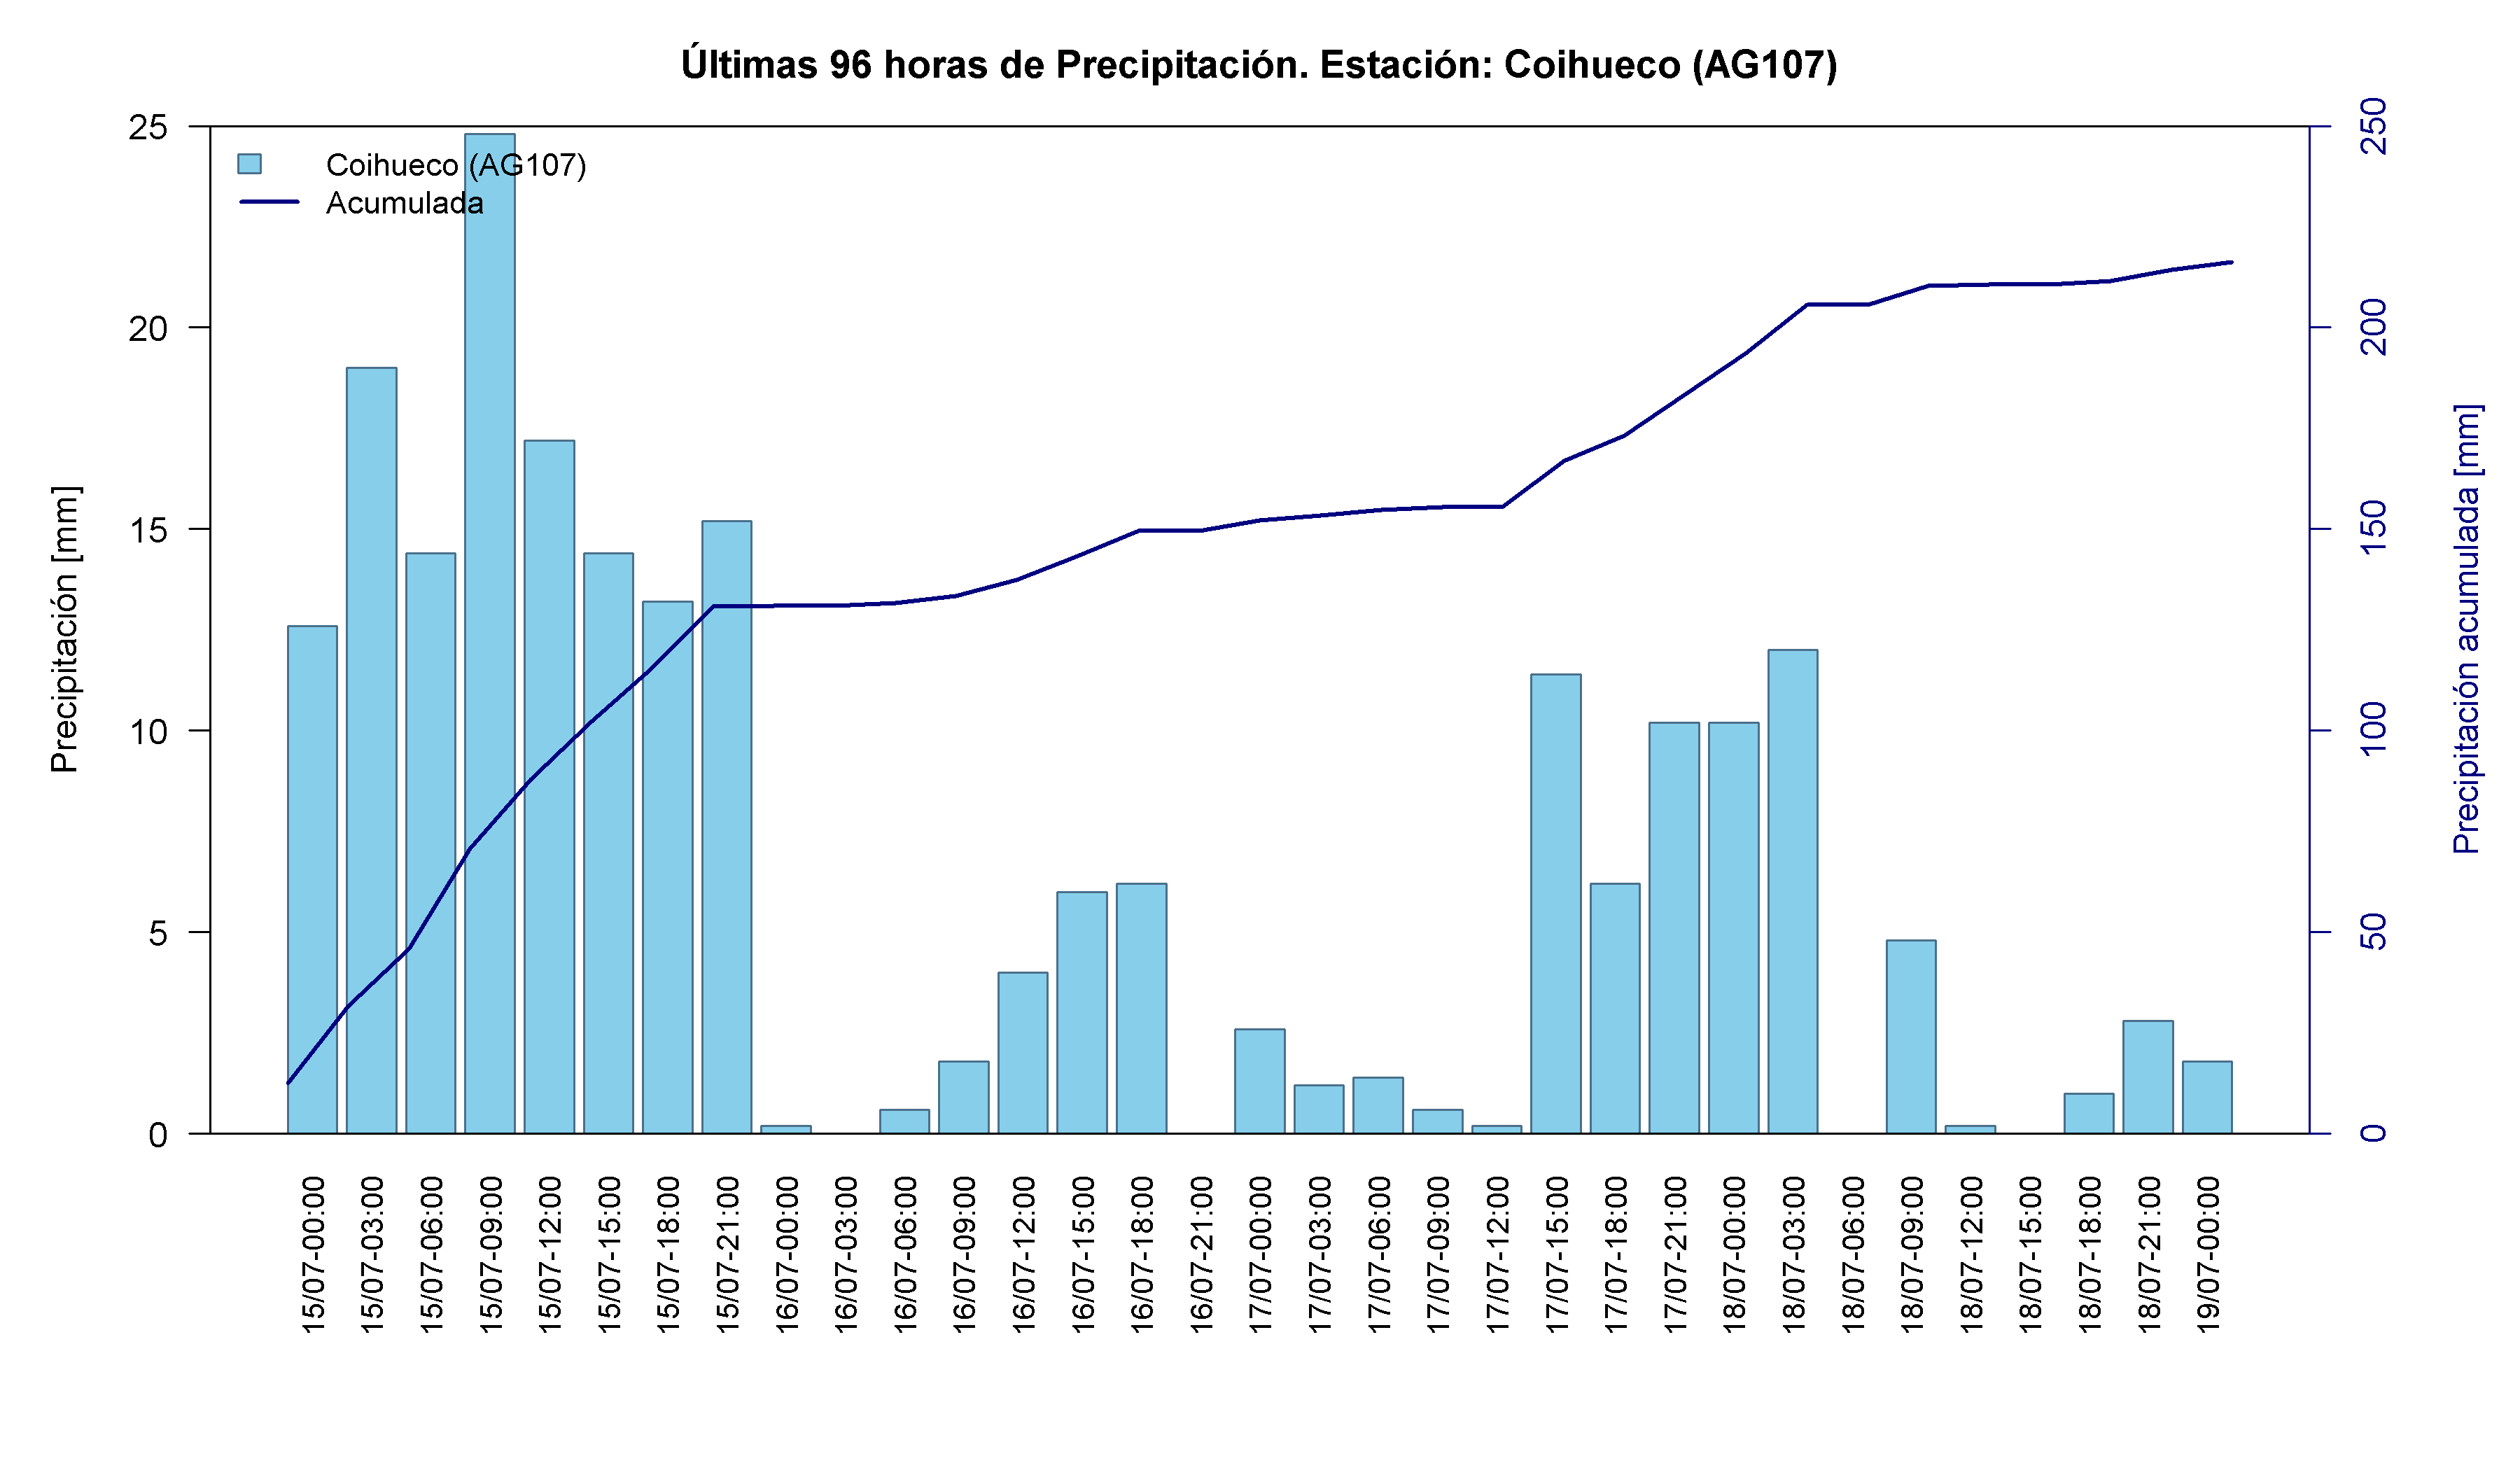
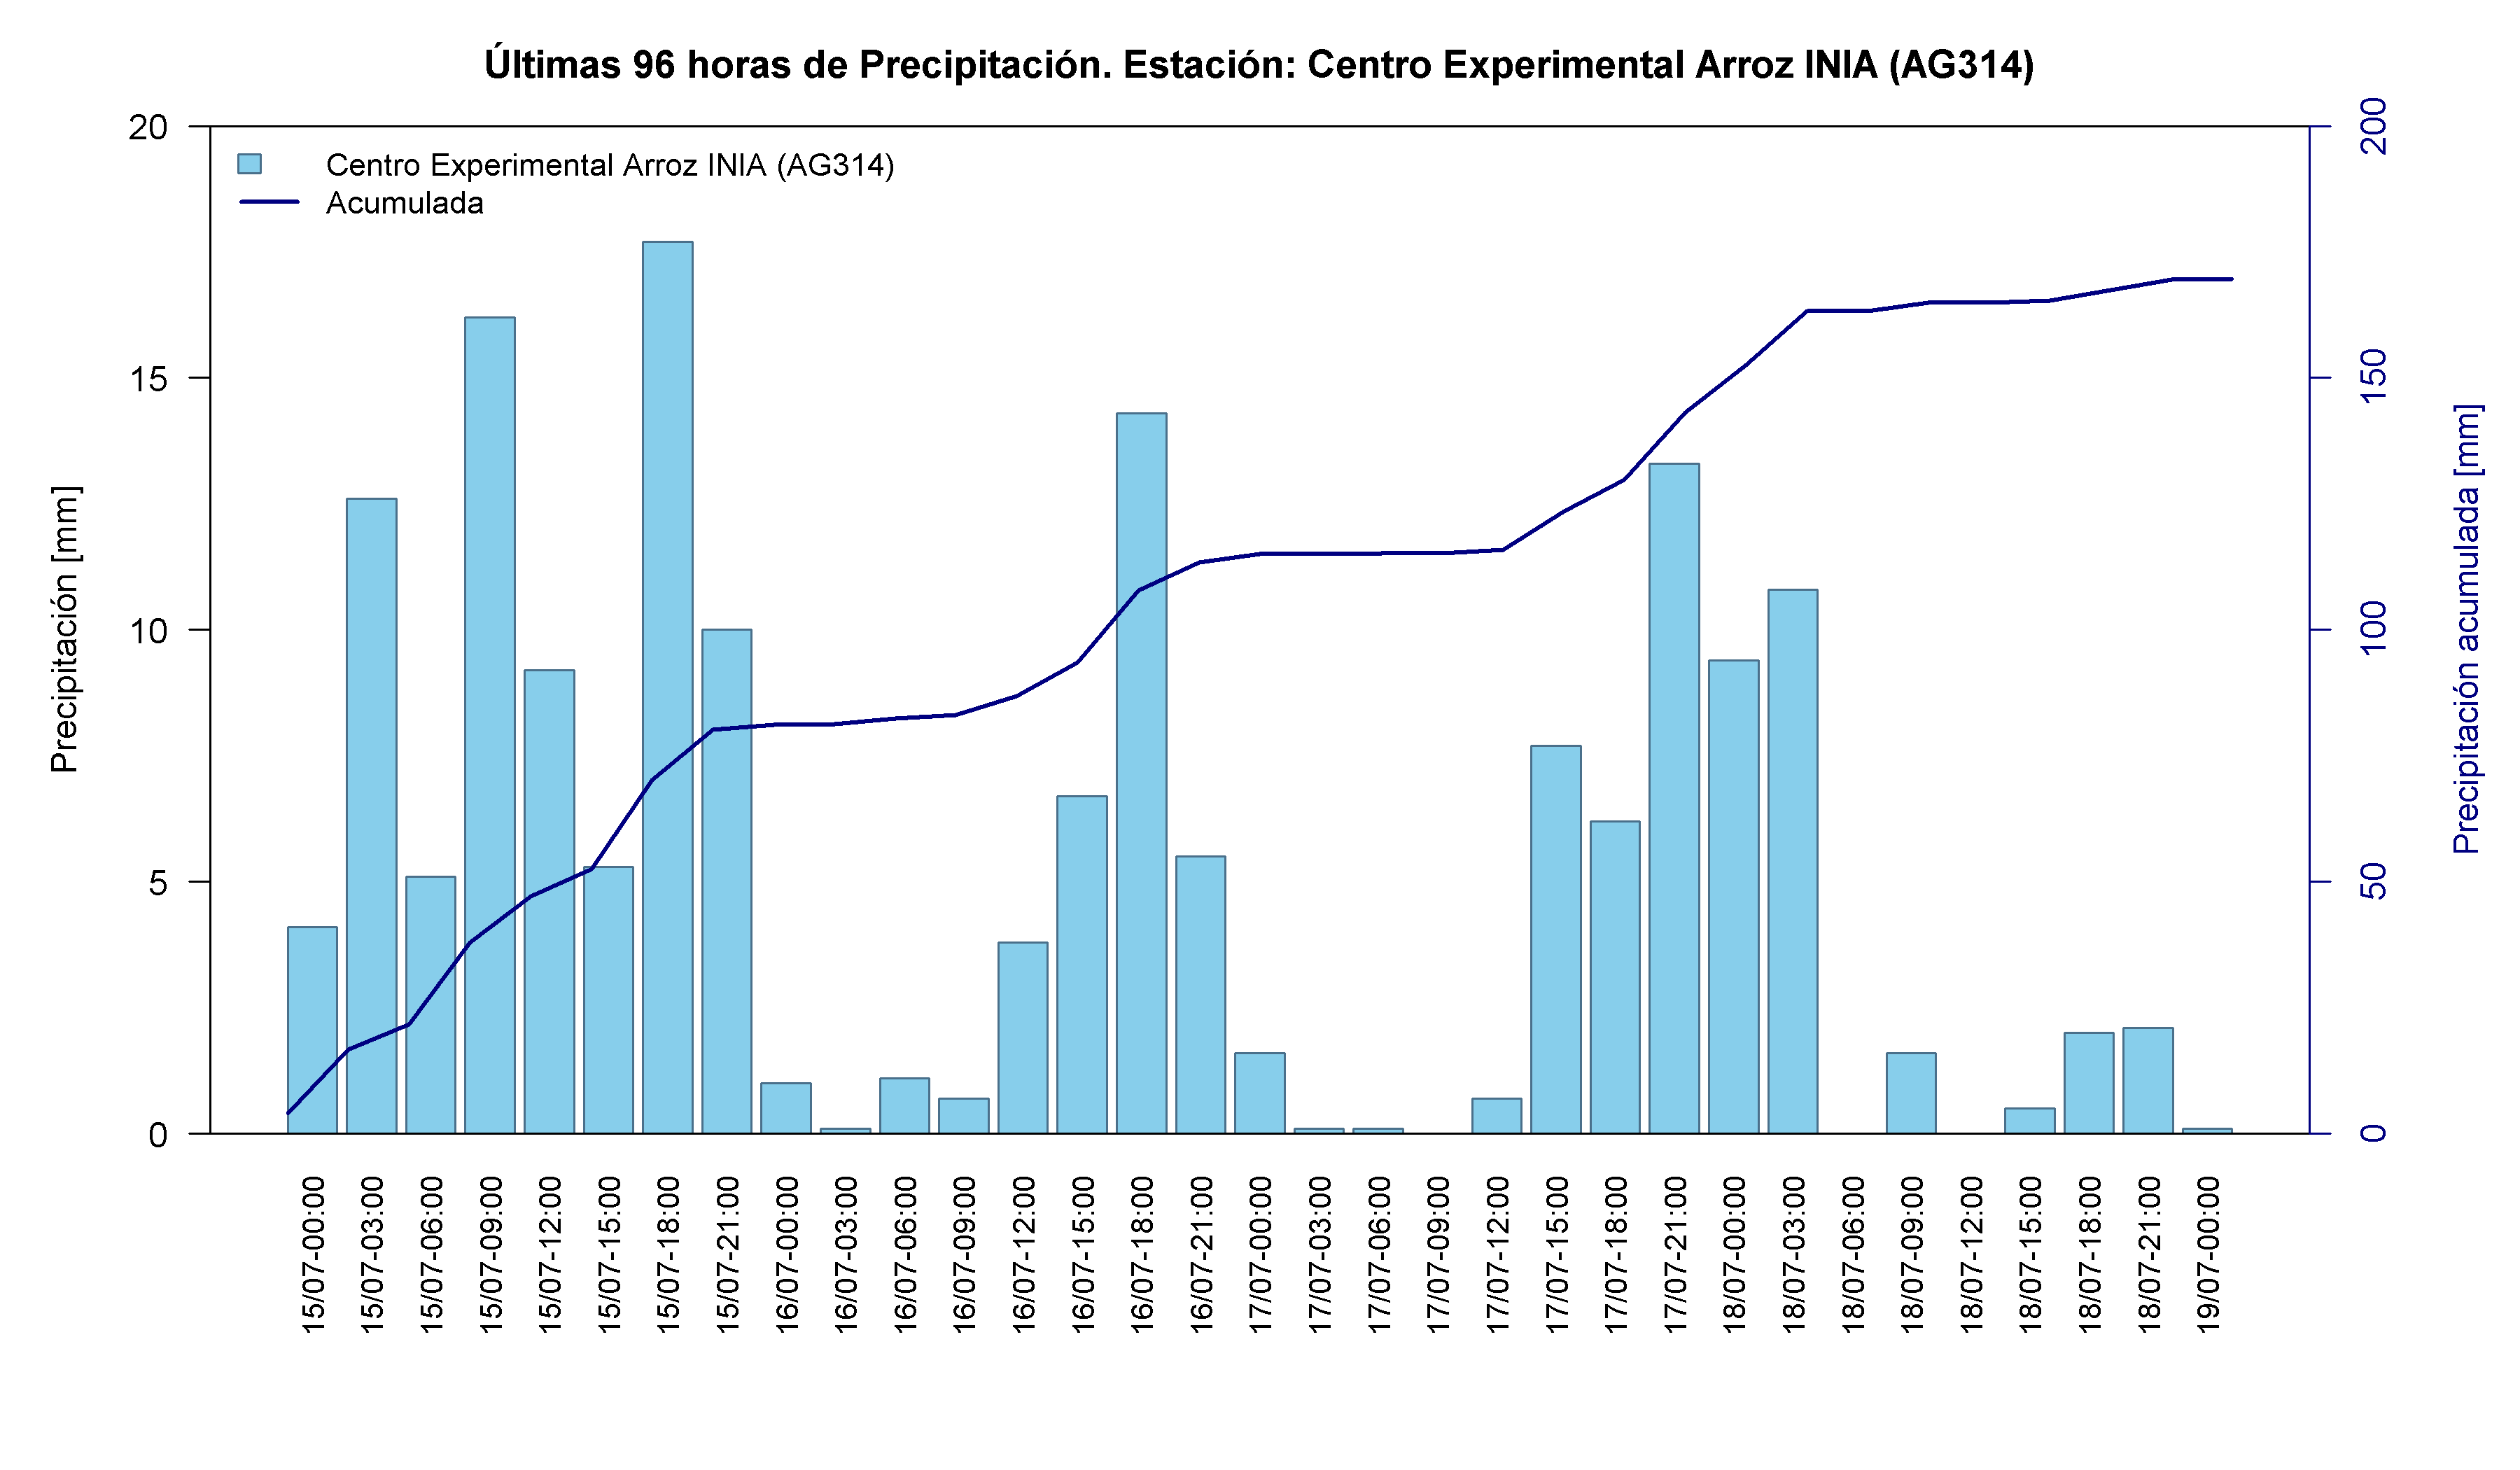
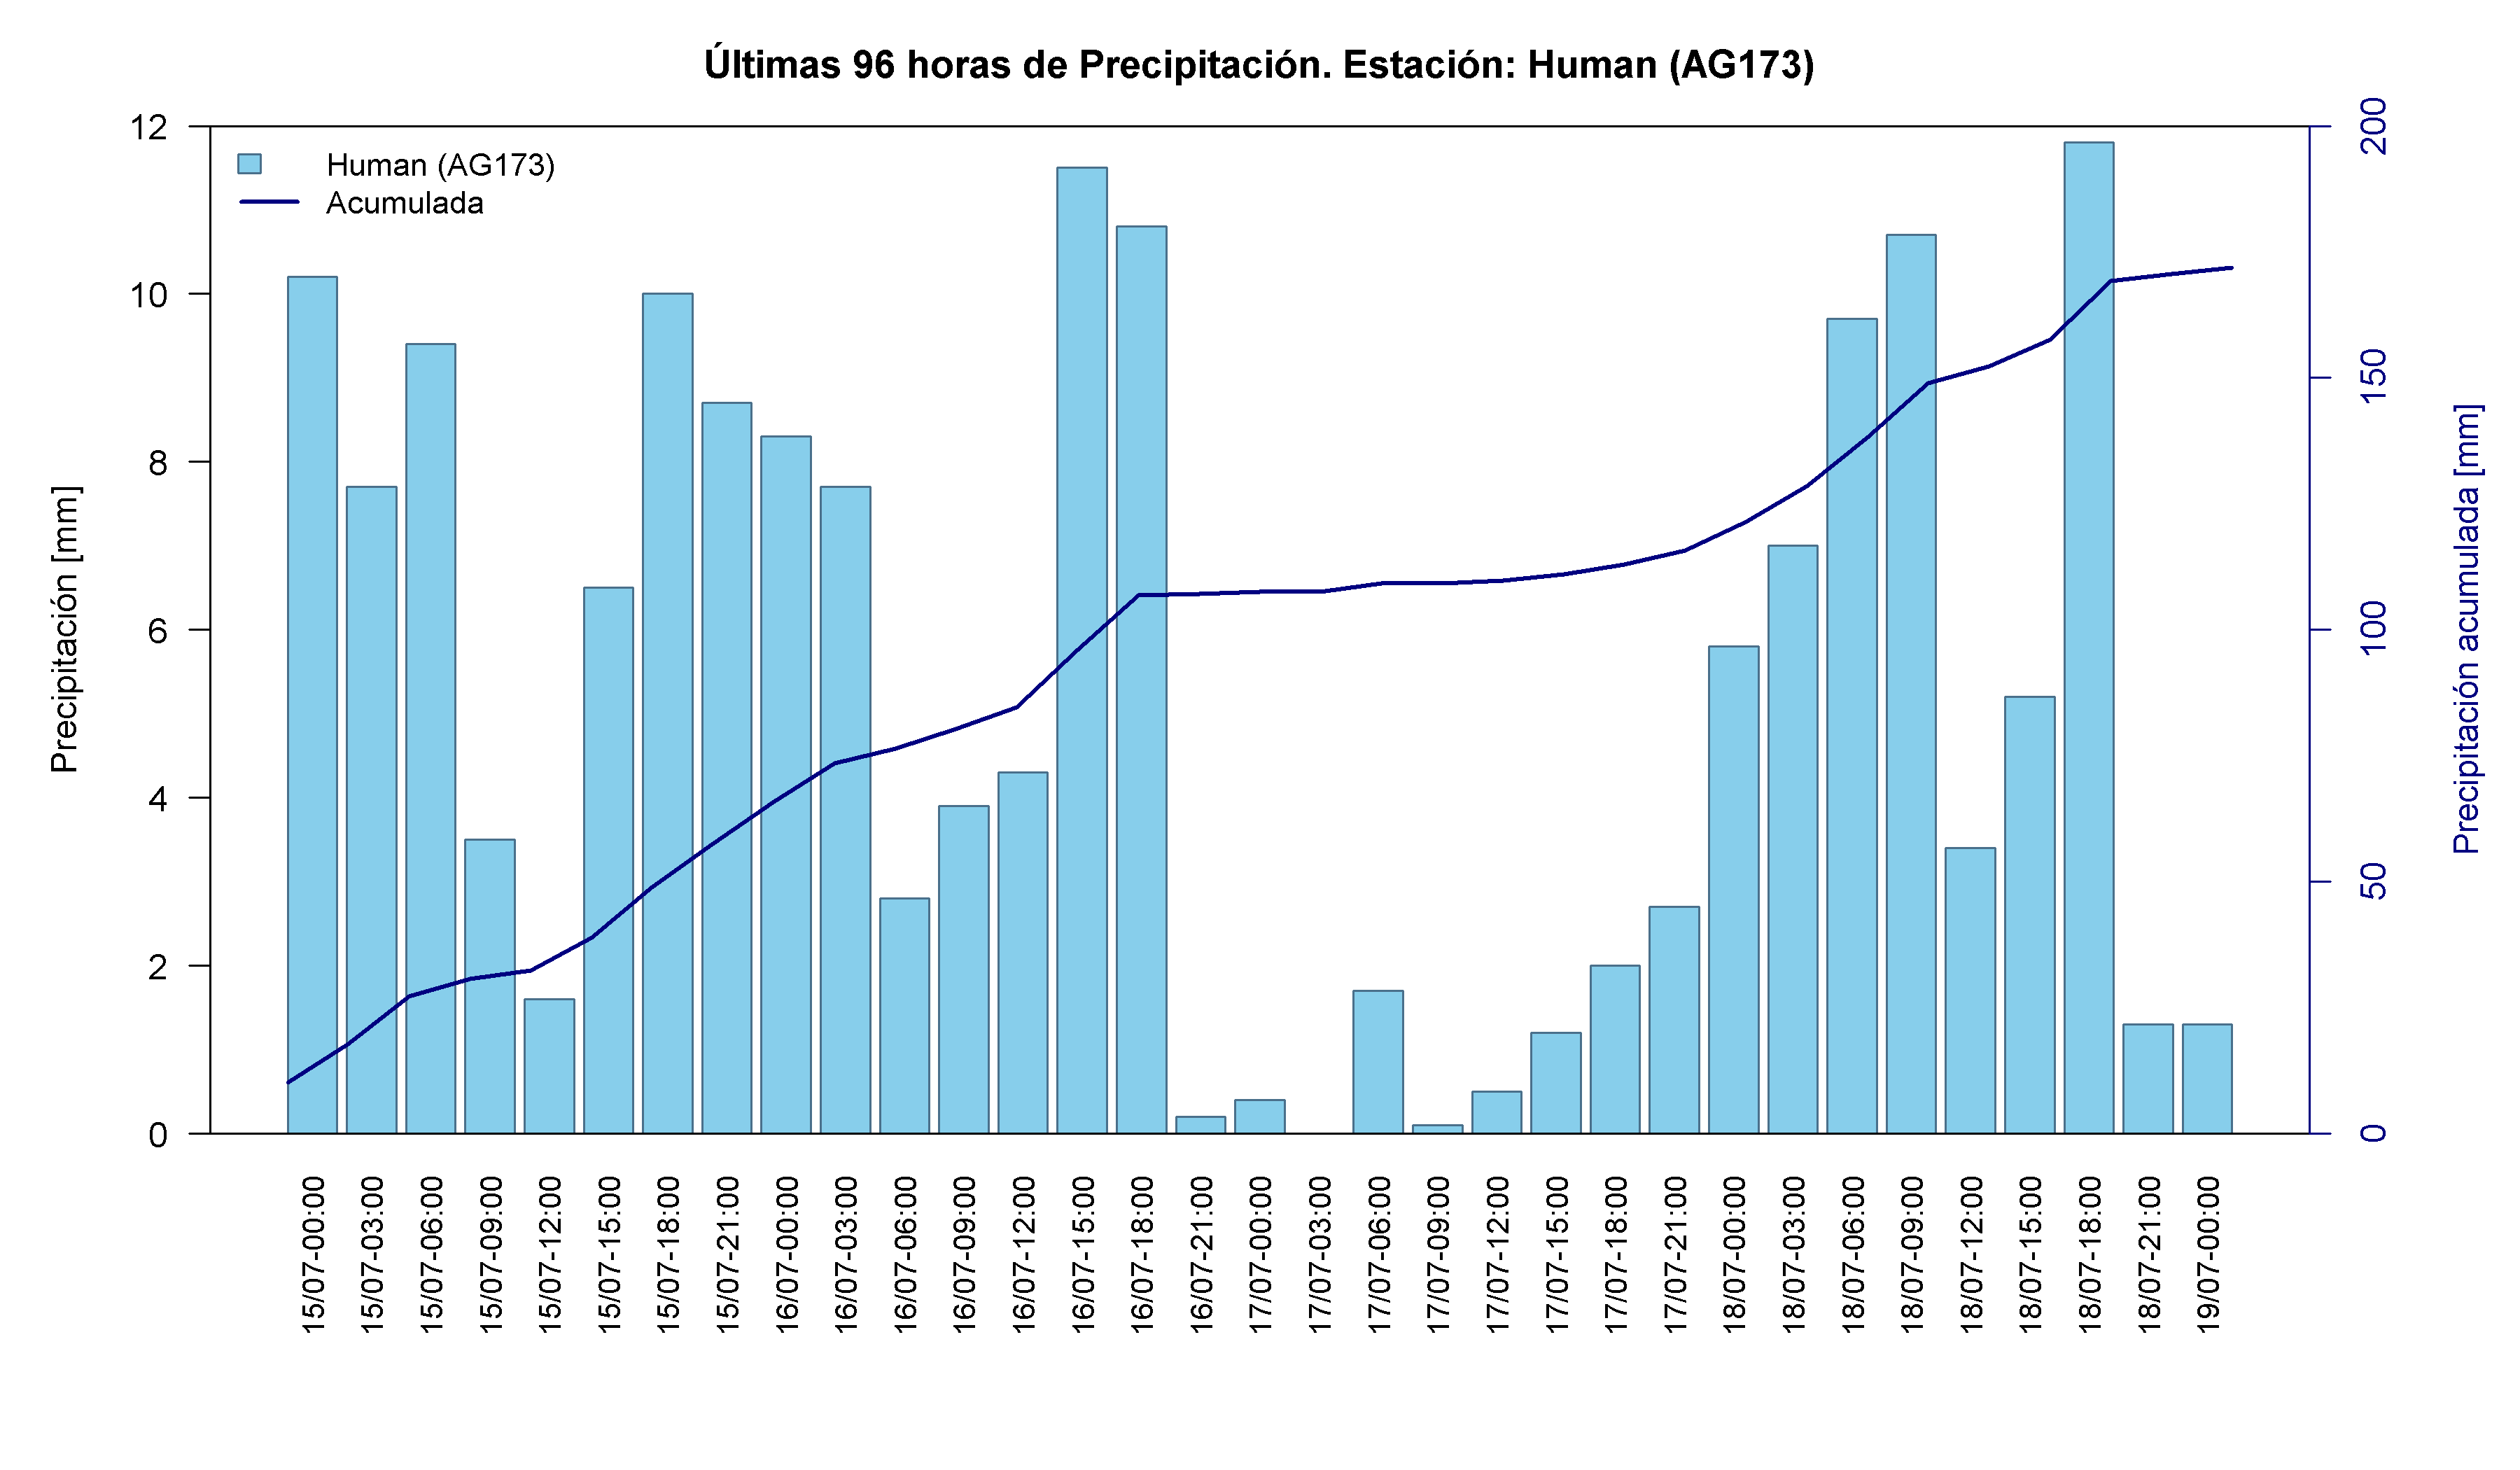
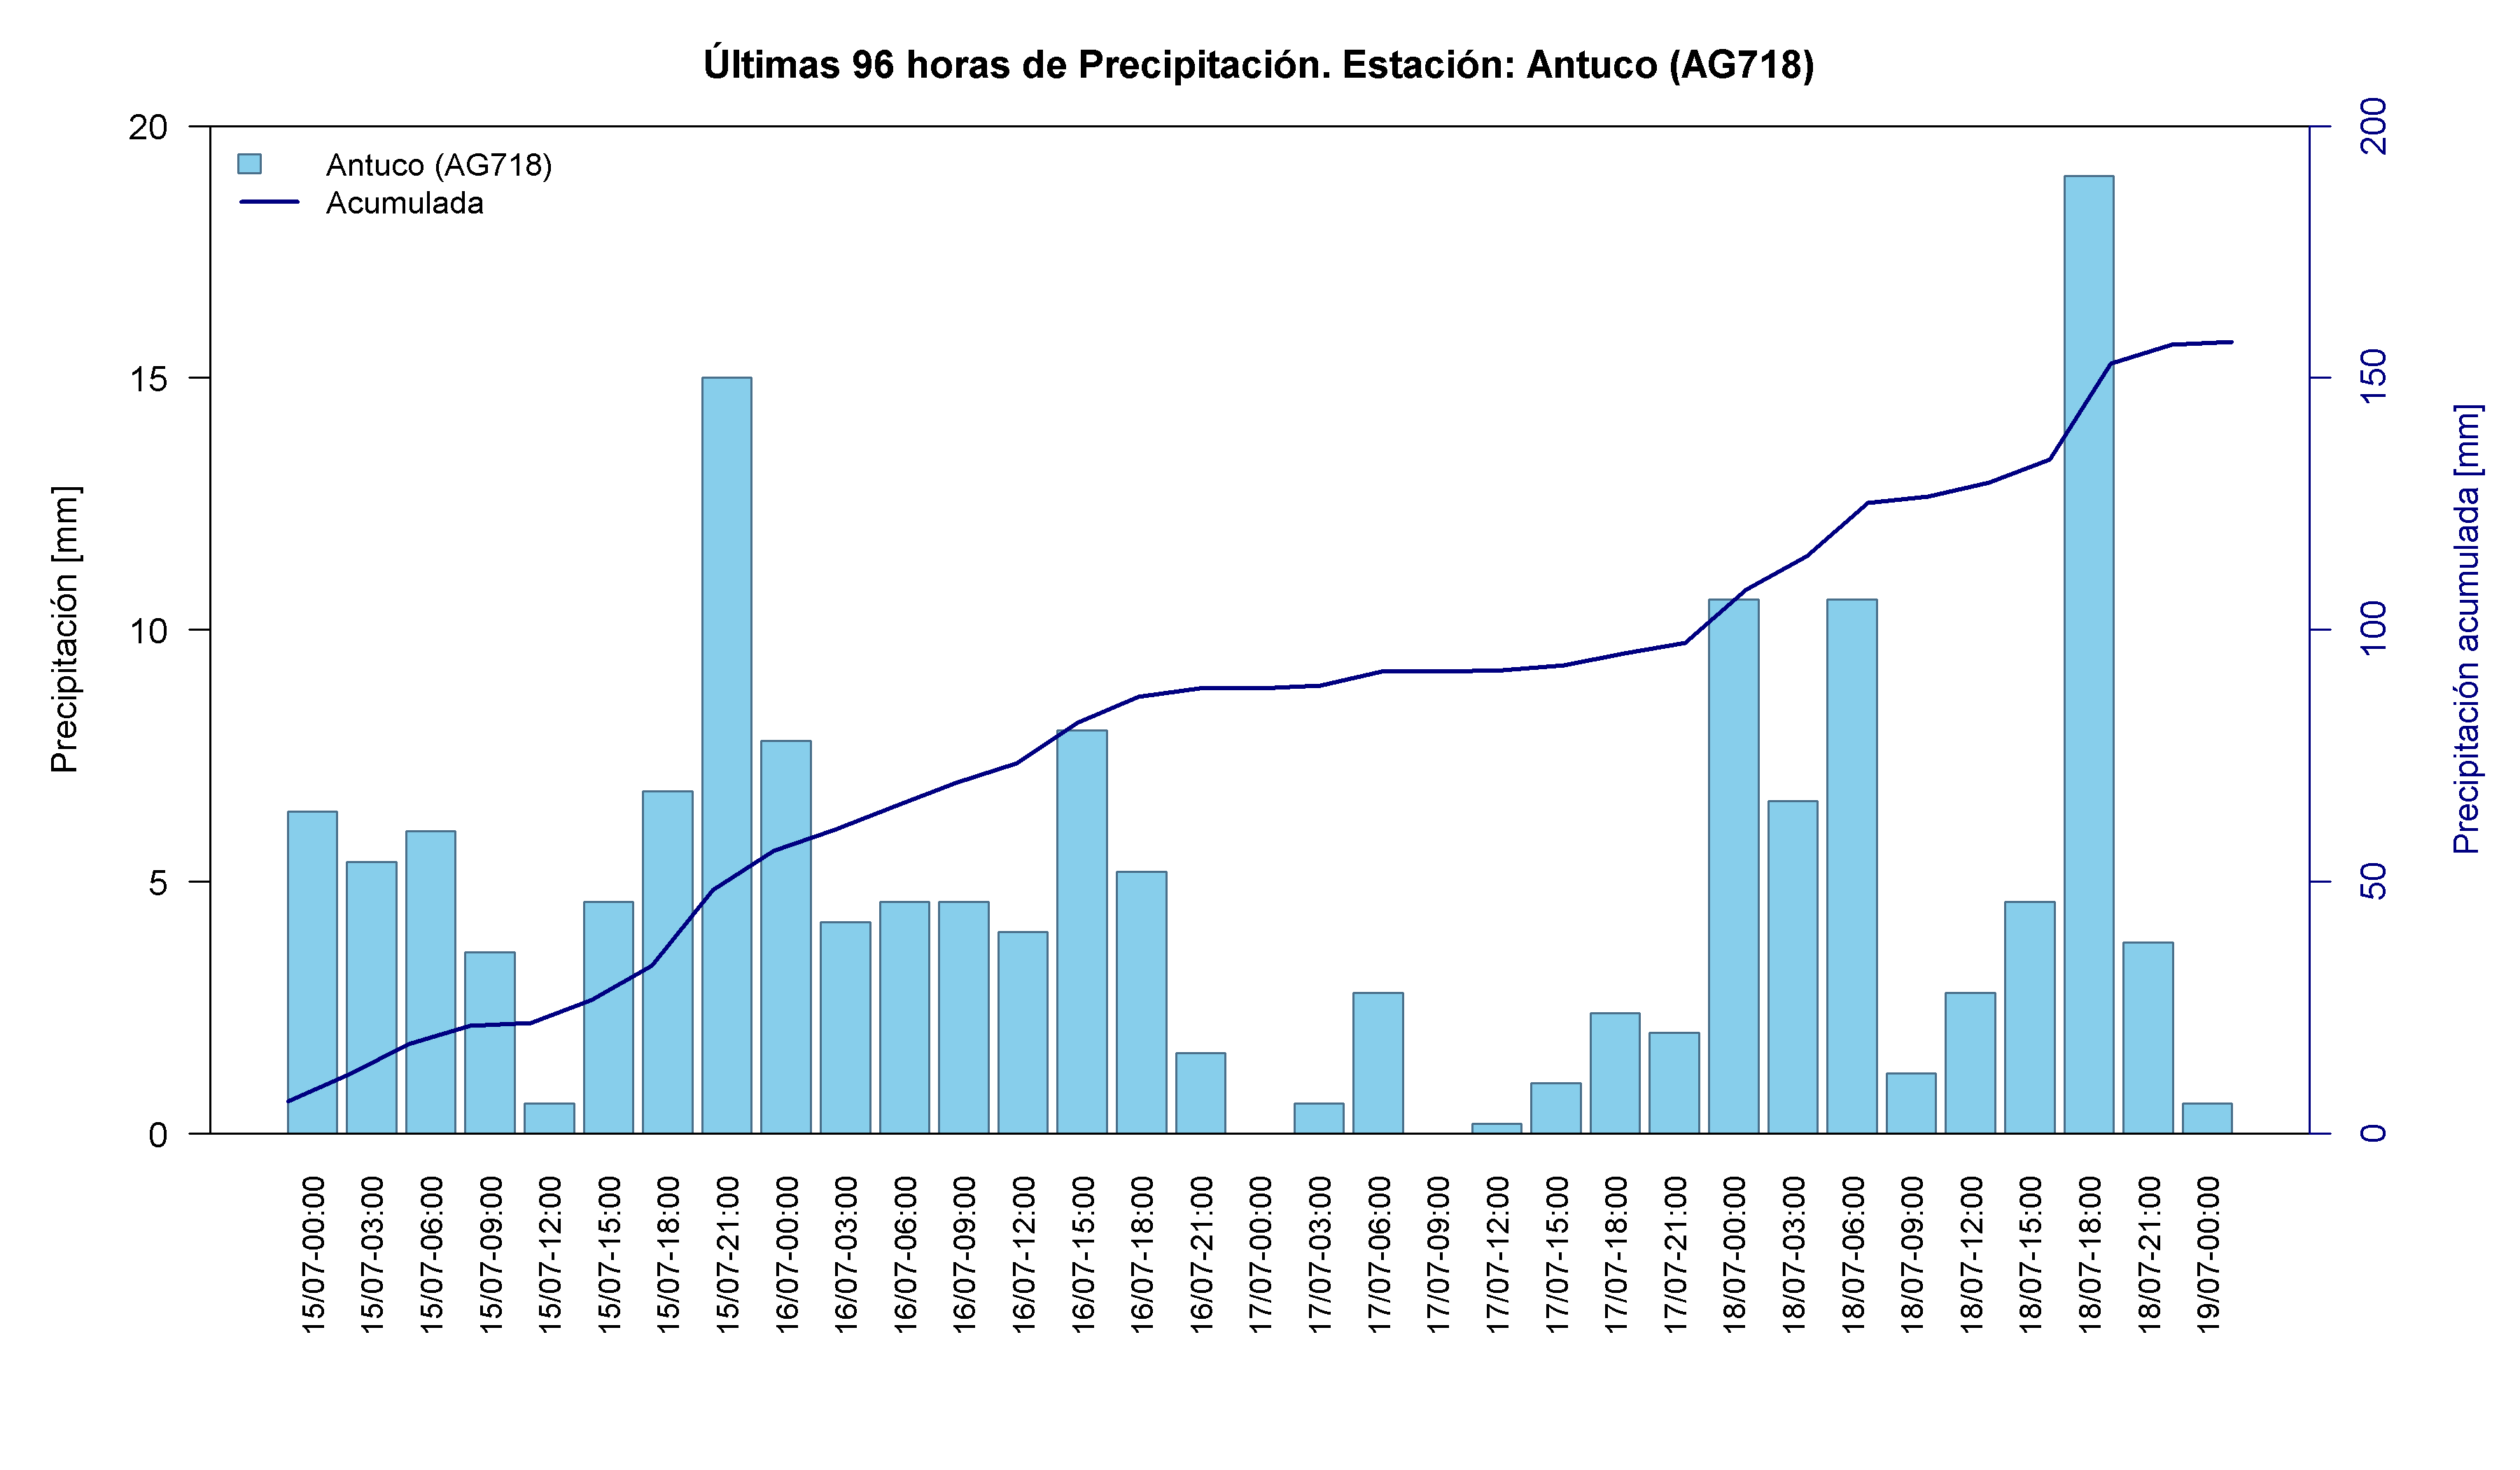
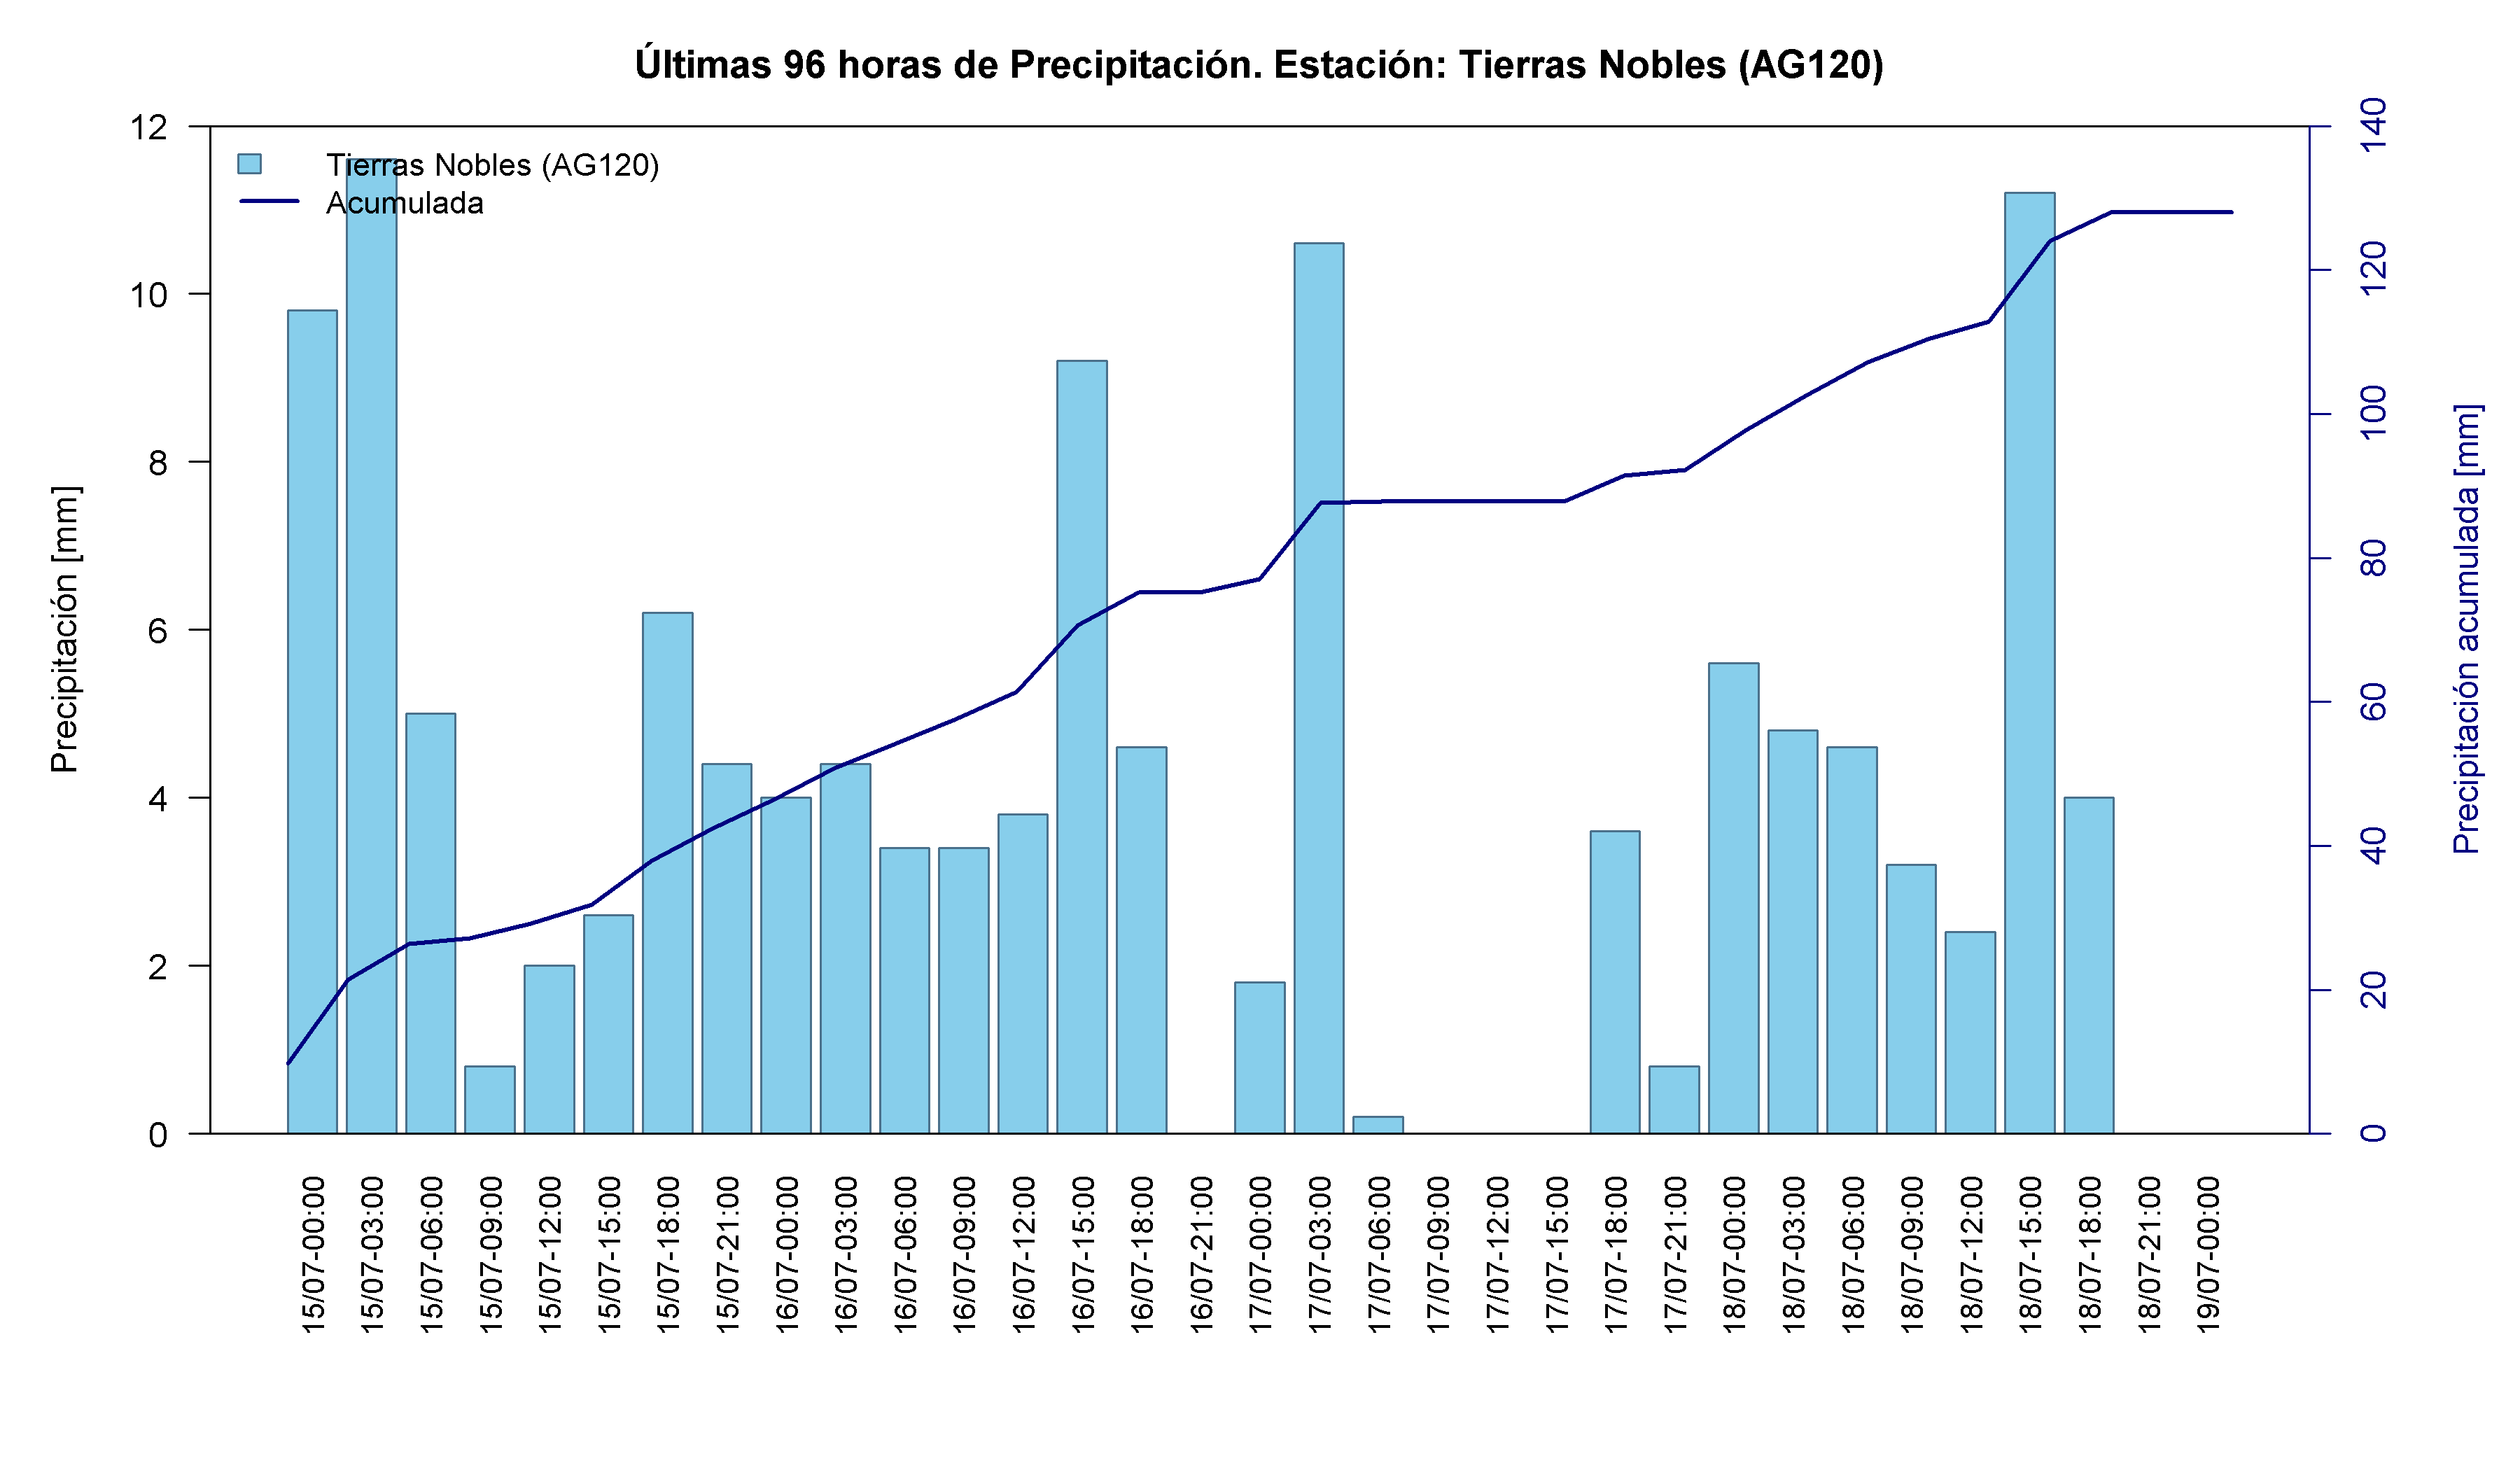
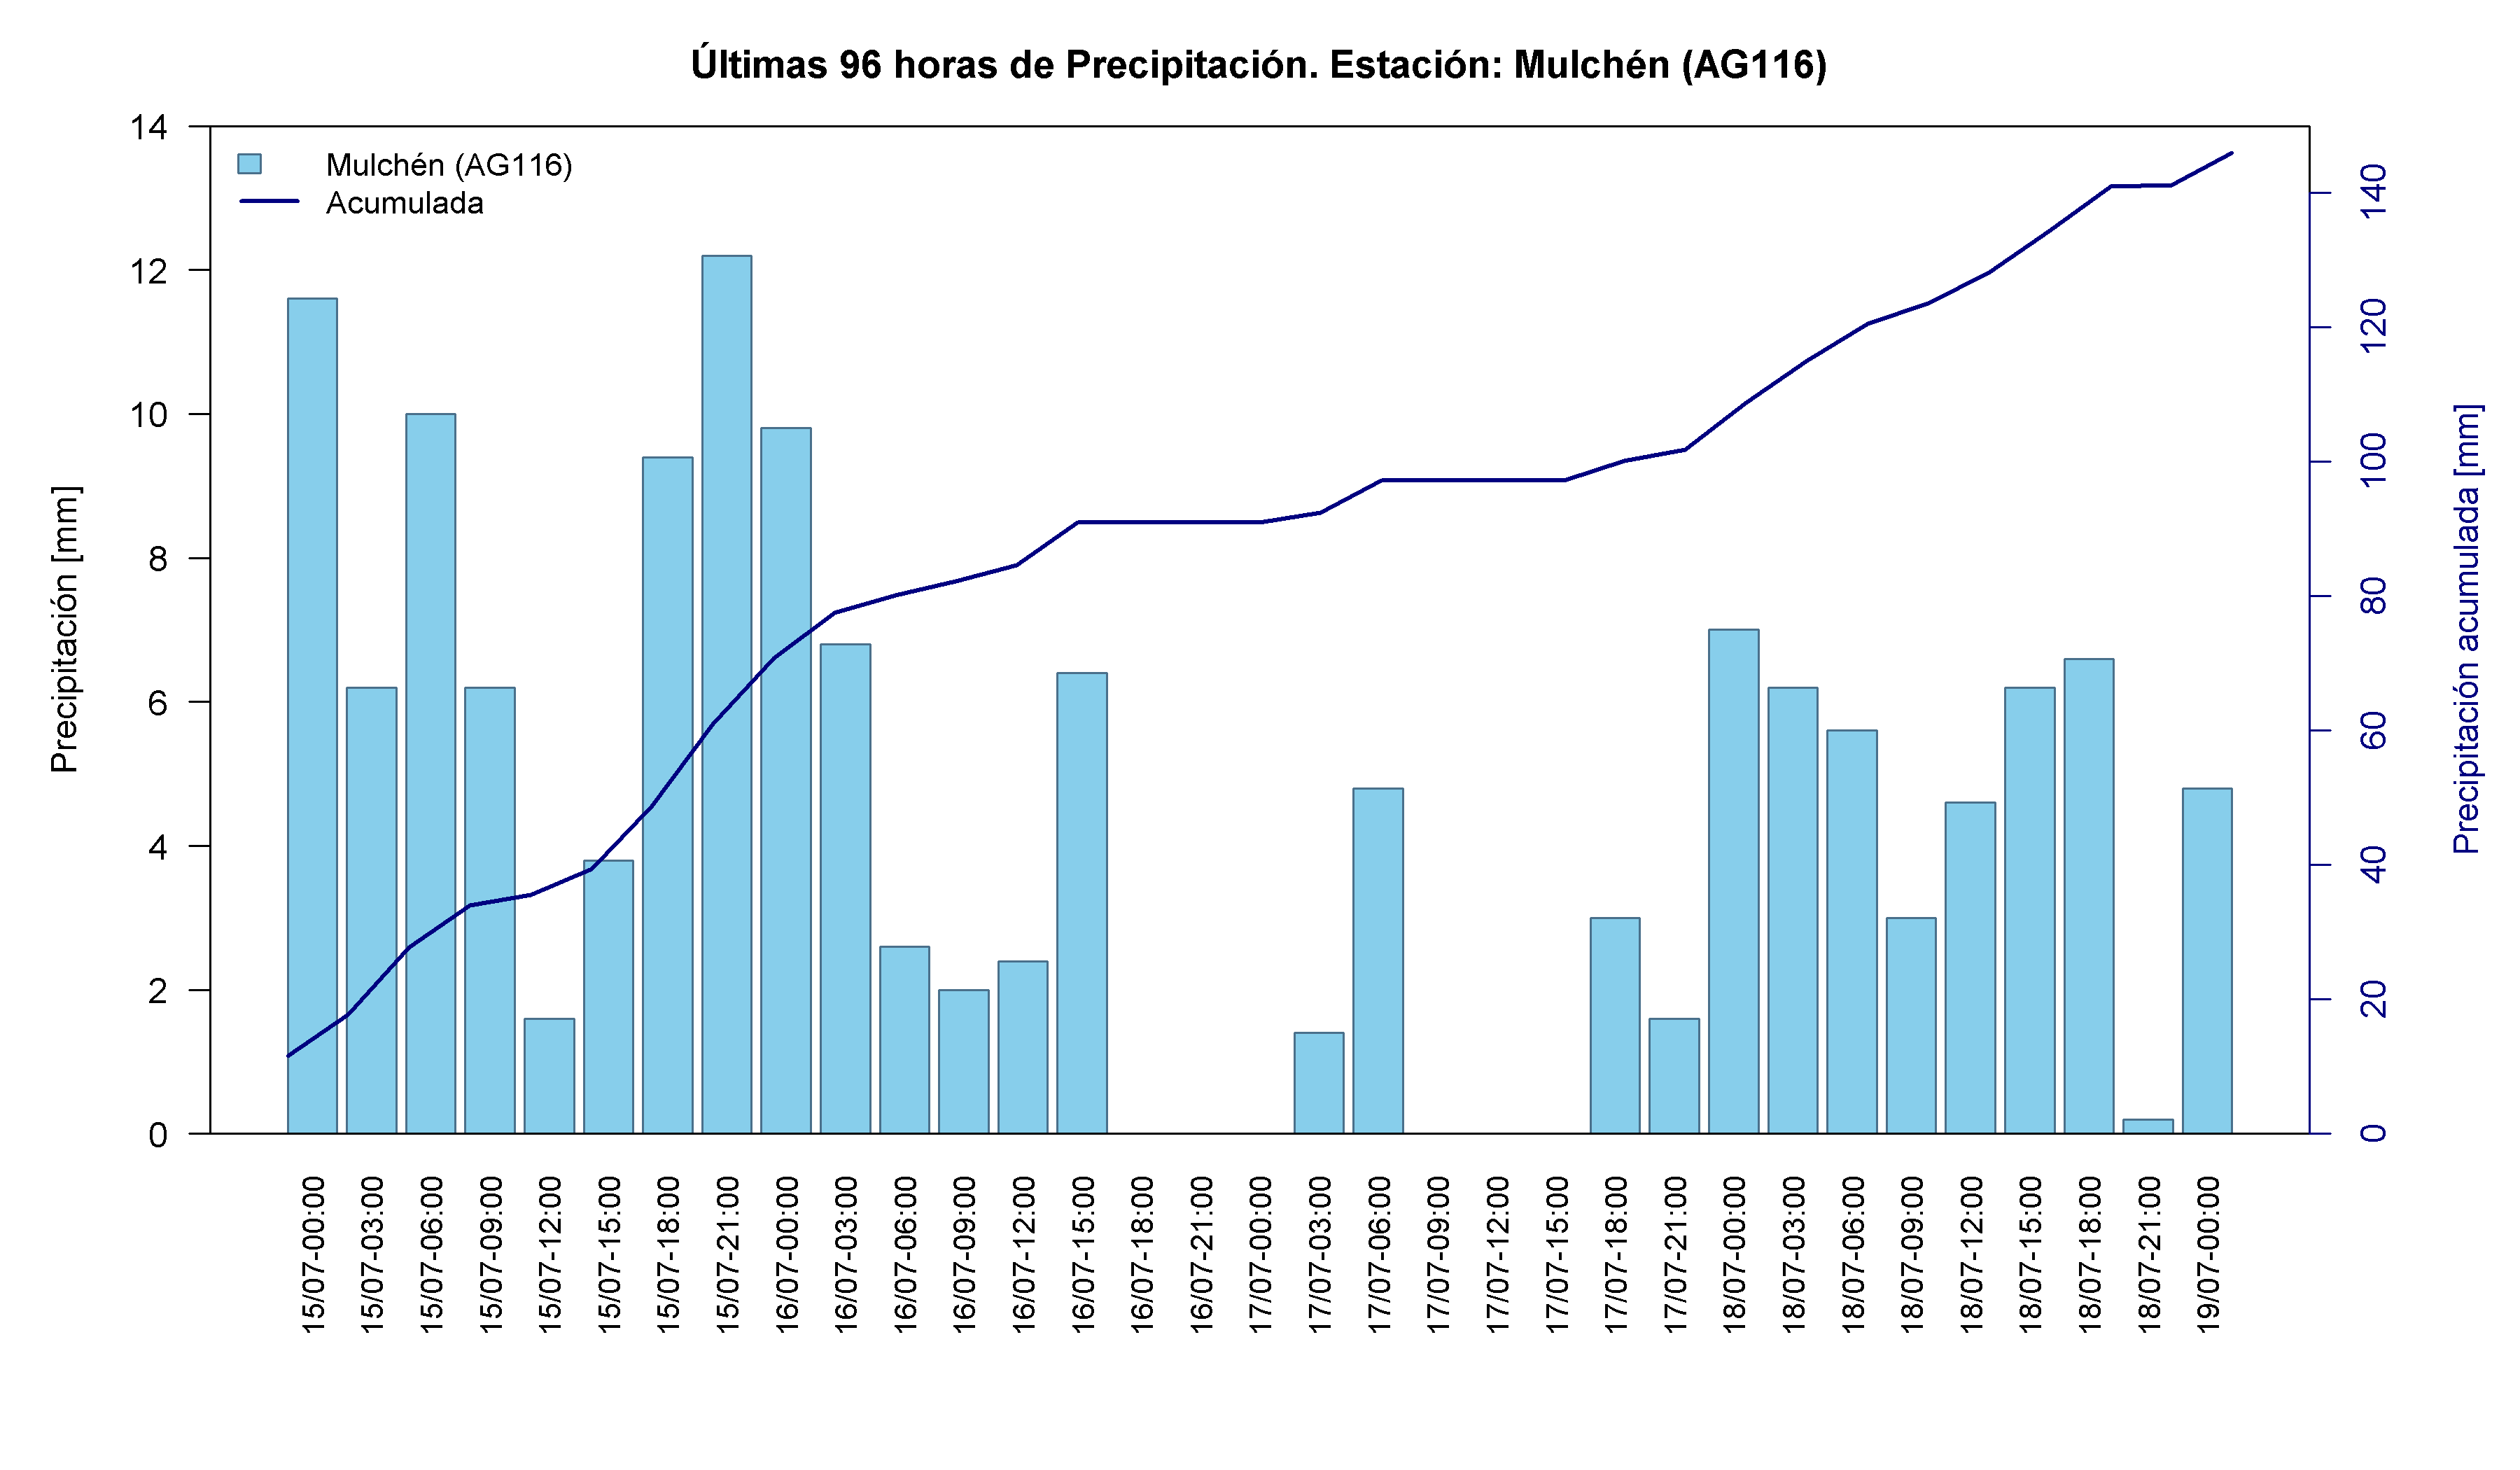
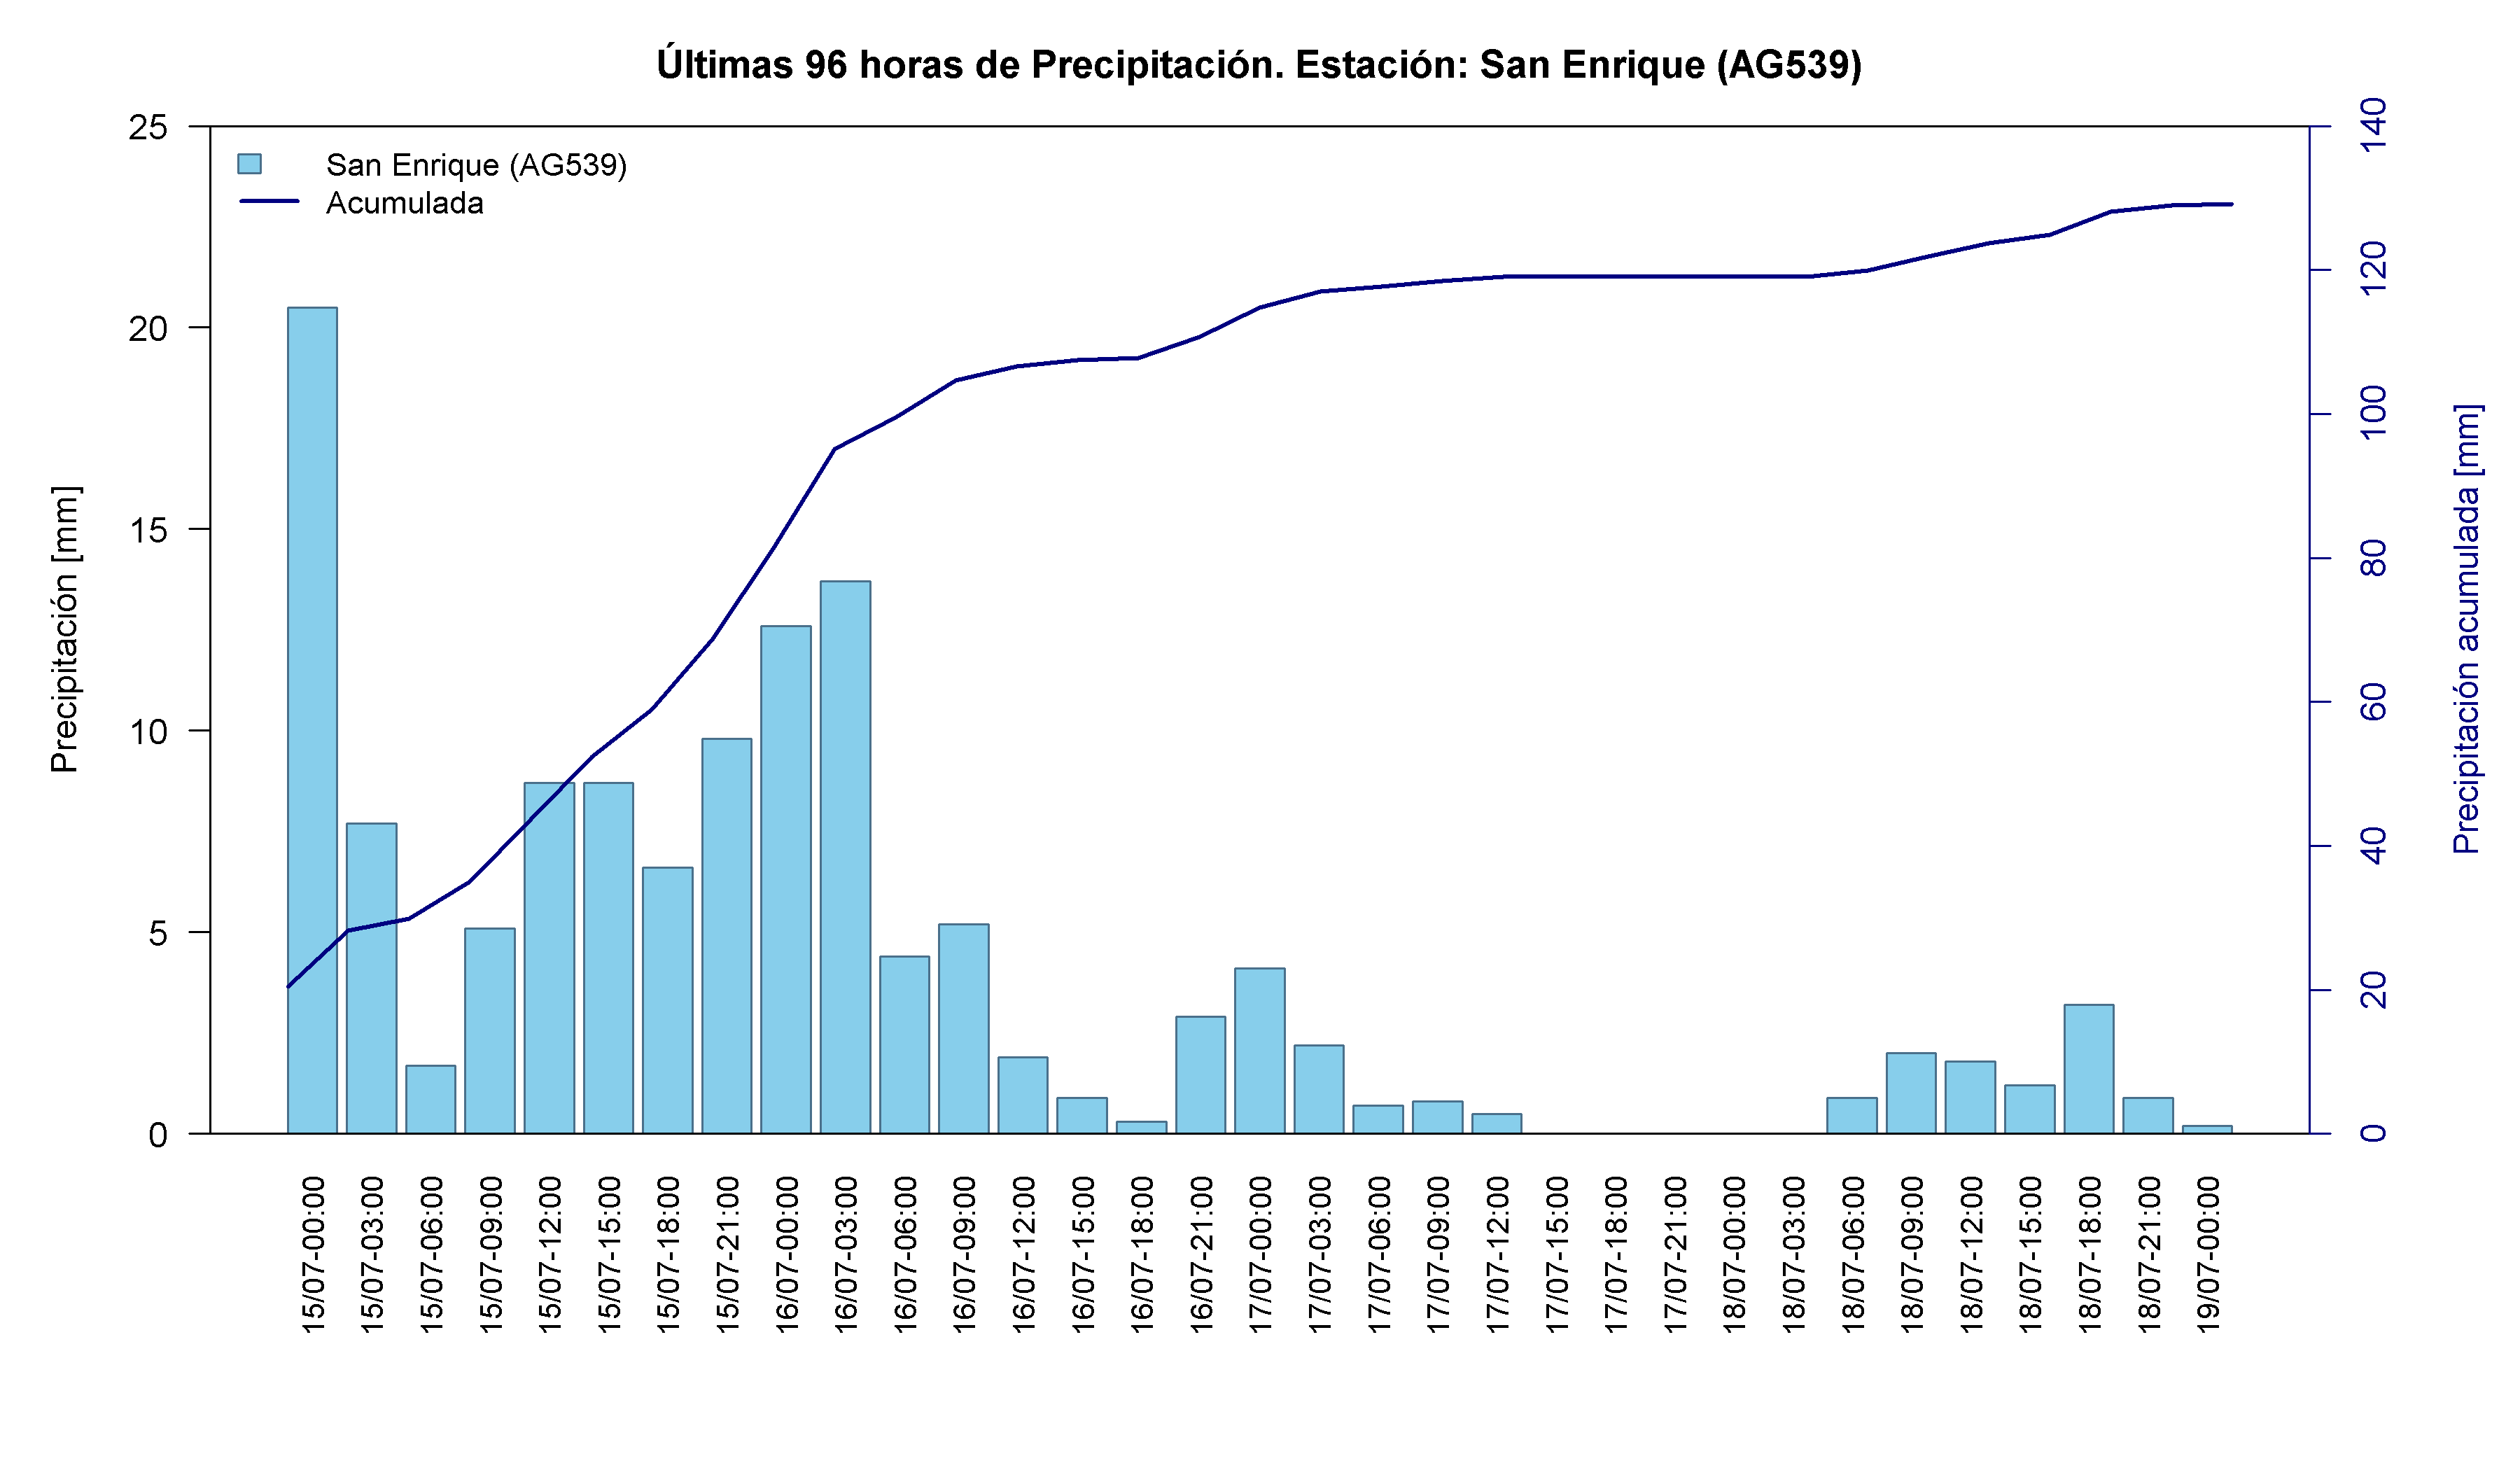
Biobío displayed the clearest sequence of multiple pulses in south-central Chile. Human accumulated 187.4 mm and Antuco 174.2 mm, while daily maxima were distributed between 15 and 18 July. This persistence produced large event totals even though daily maxima were lower than those observed farther north.
Time series and interactive elements
Map 8. Location of the rain gauges analysed in the Biobío Region during the frontal-system event of 15-19 July 2026. Source: Authors’ analysis based on data from the VisMet meteorological viewer .
Table 8. Accumulated precipitation recorded at rain gauges in the Biobío Region between 15 and 19 July 2026. Source: Authors’ analysis based on data from the VisMet meteorological viewer .
La Araucanía Region
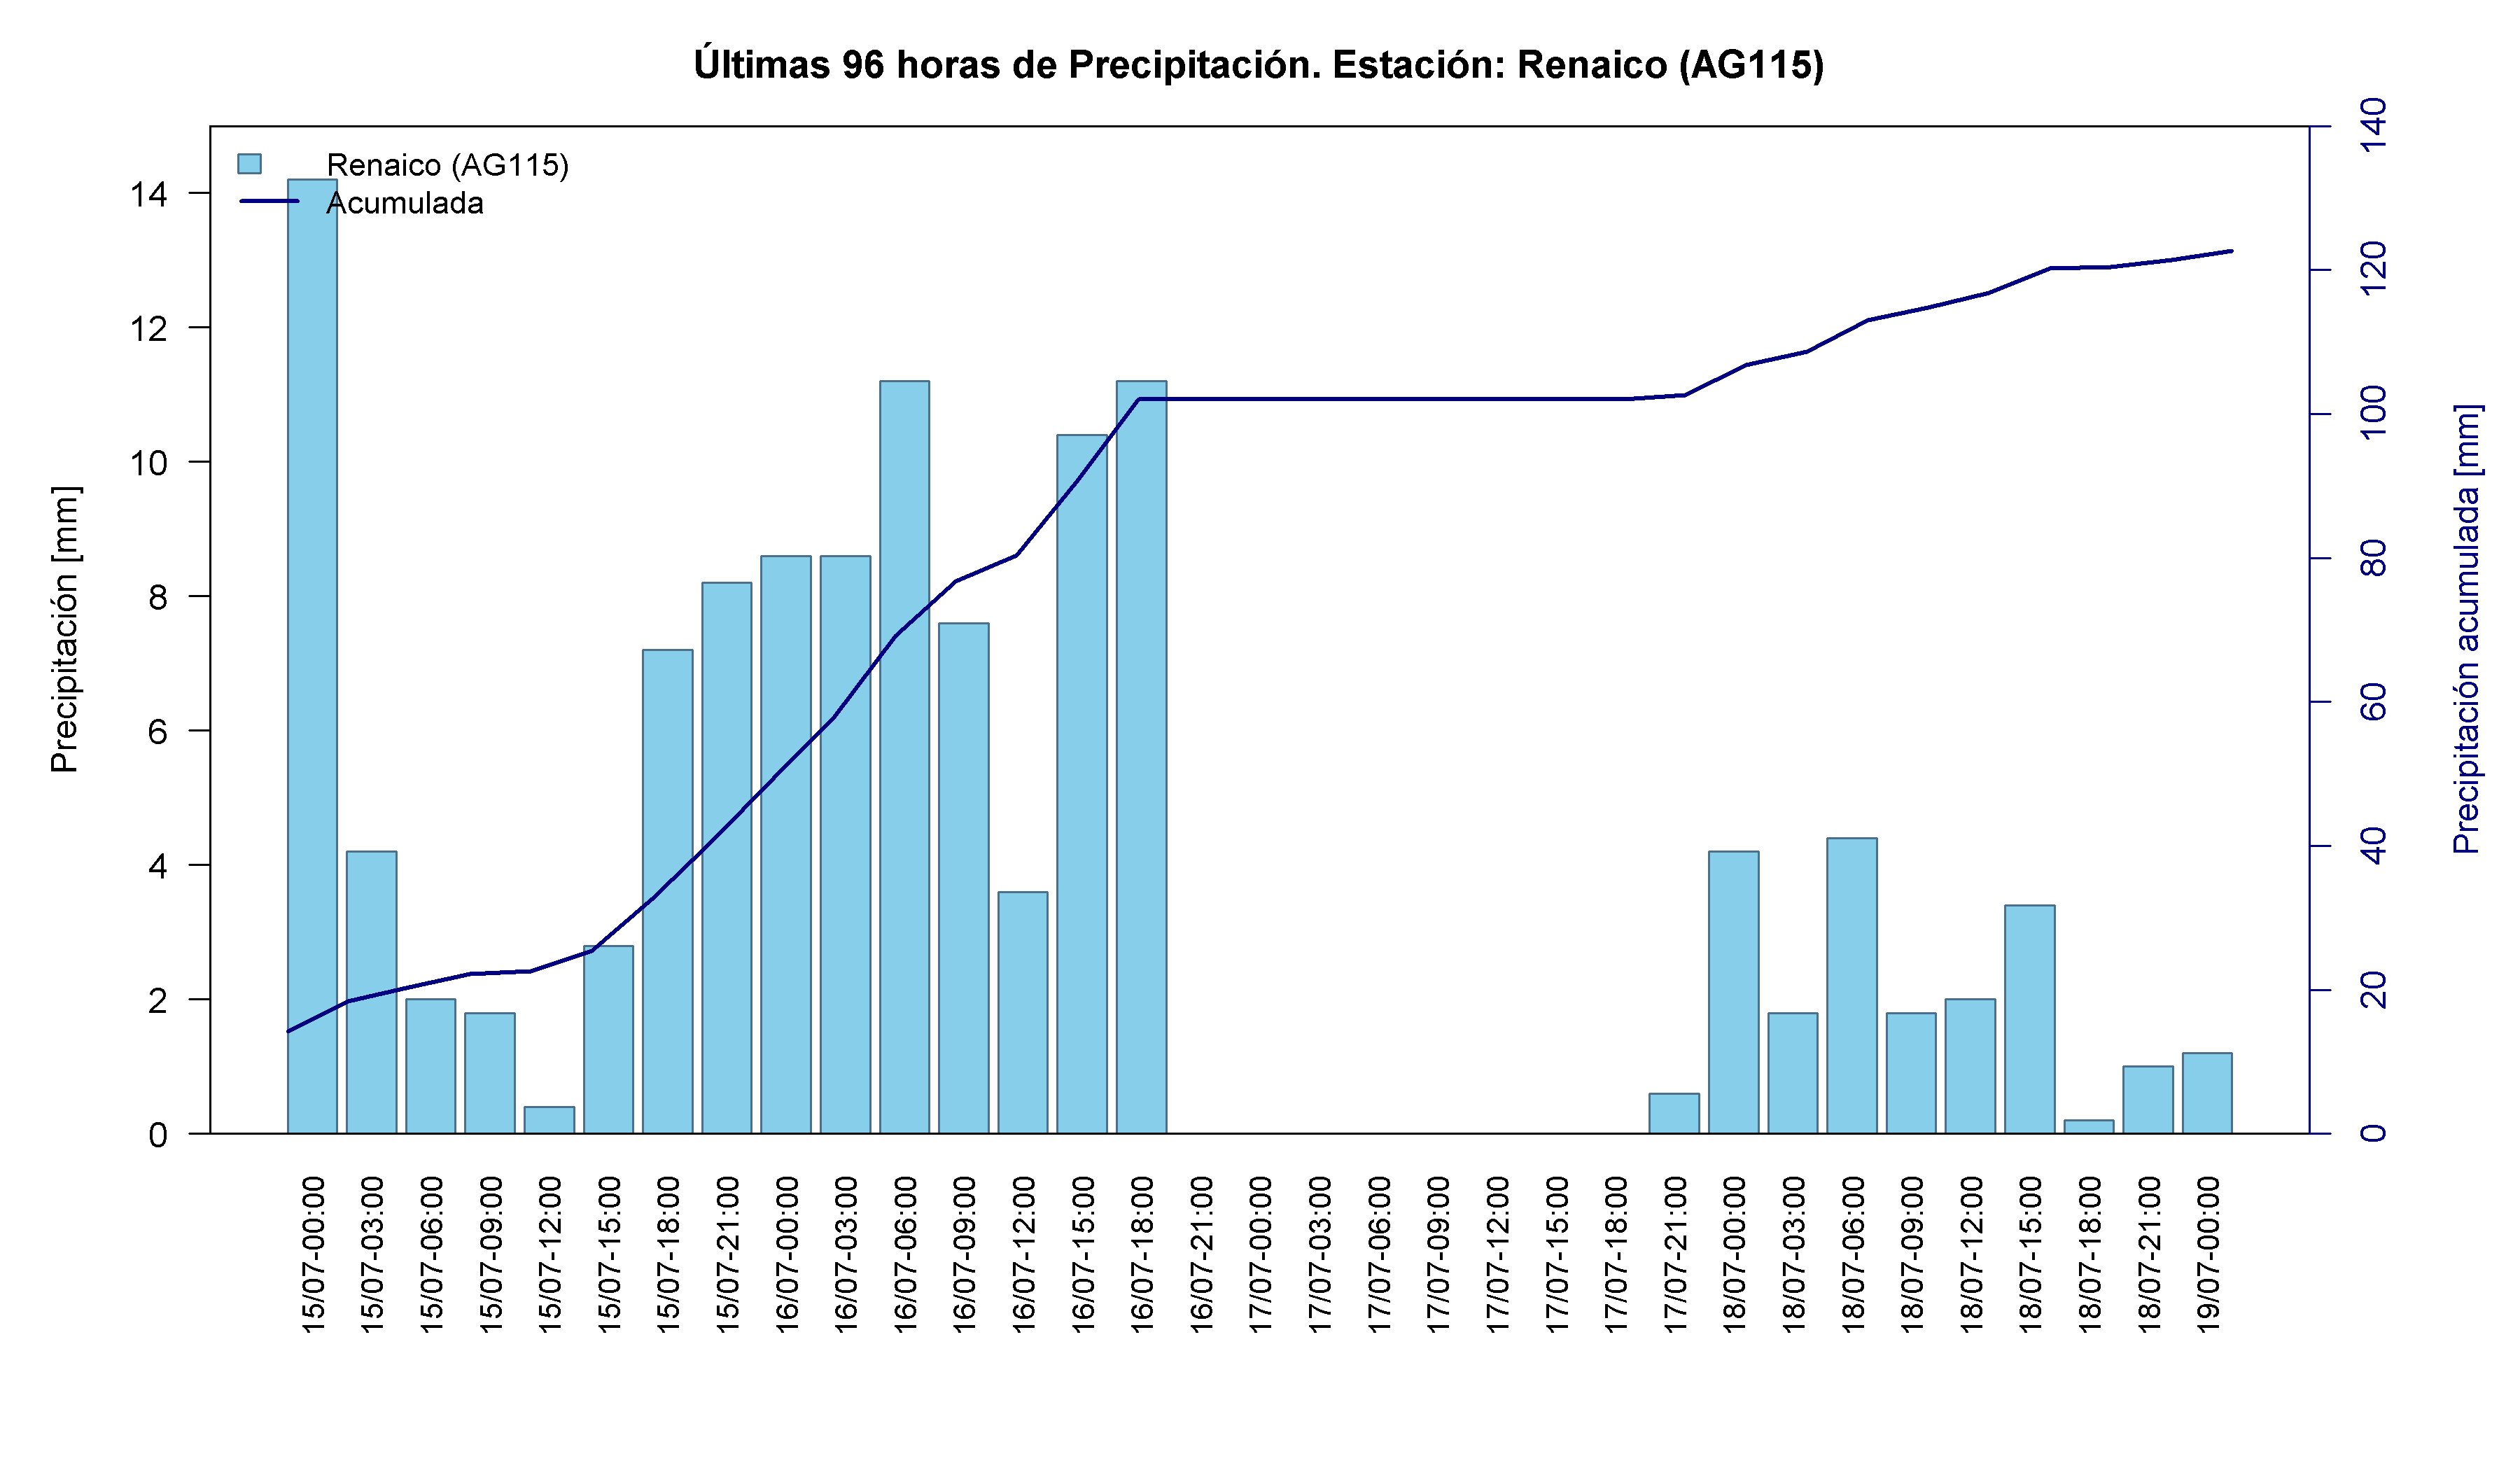
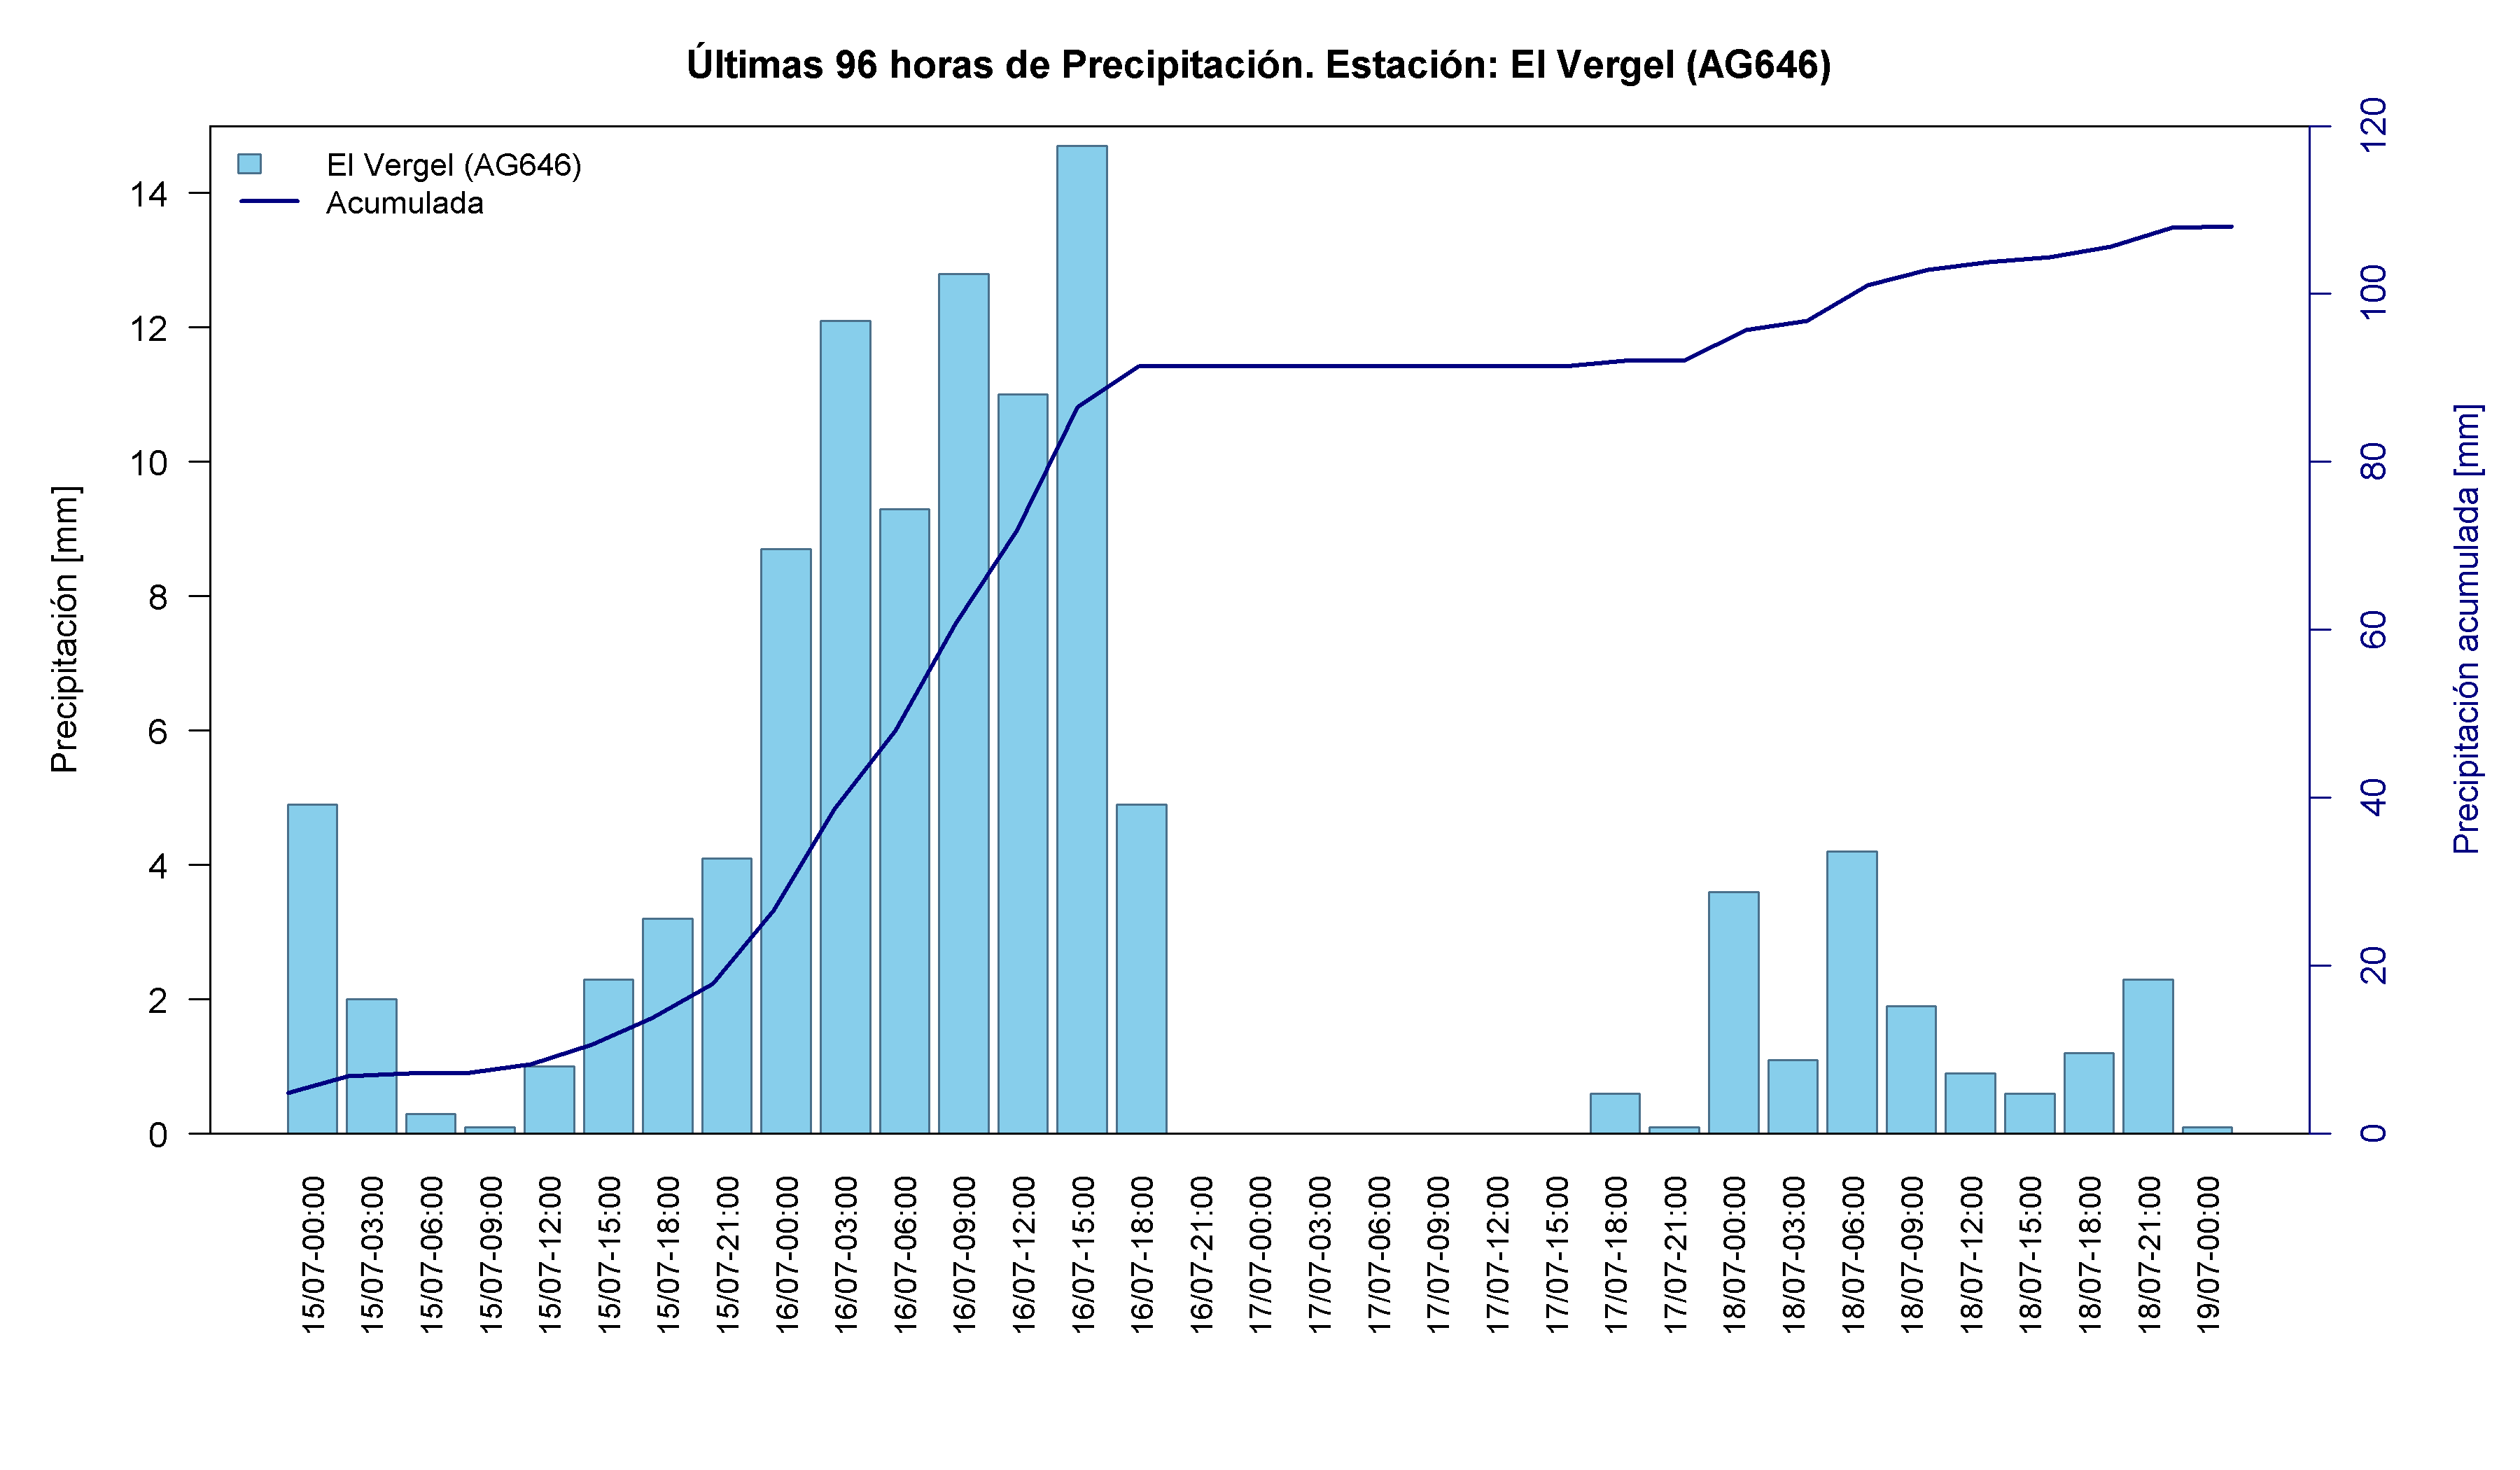
La Araucanía experienced two main phases: one during 14-15 July and another during 16-17 July. Renaico accumulated 154.6 mm and El Vergel 146.6 mm. The pattern confirms that both frontal systems affected the region, although less intensely than farther north.
Time series and interactive elements
Map 9. Location of the rain gauges analysed in the La Araucanía Region during the frontal-system event of 15-19 July 2026. Source: Authors’ analysis based on data from the VisMet meteorological viewer .
Table 9. Accumulated precipitation recorded at rain gauges in the La Araucanía Region between 15 and 19 July 2026. Source: Authors’ analysis based on data from the VisMet meteorological viewer .
Los Ríos Region
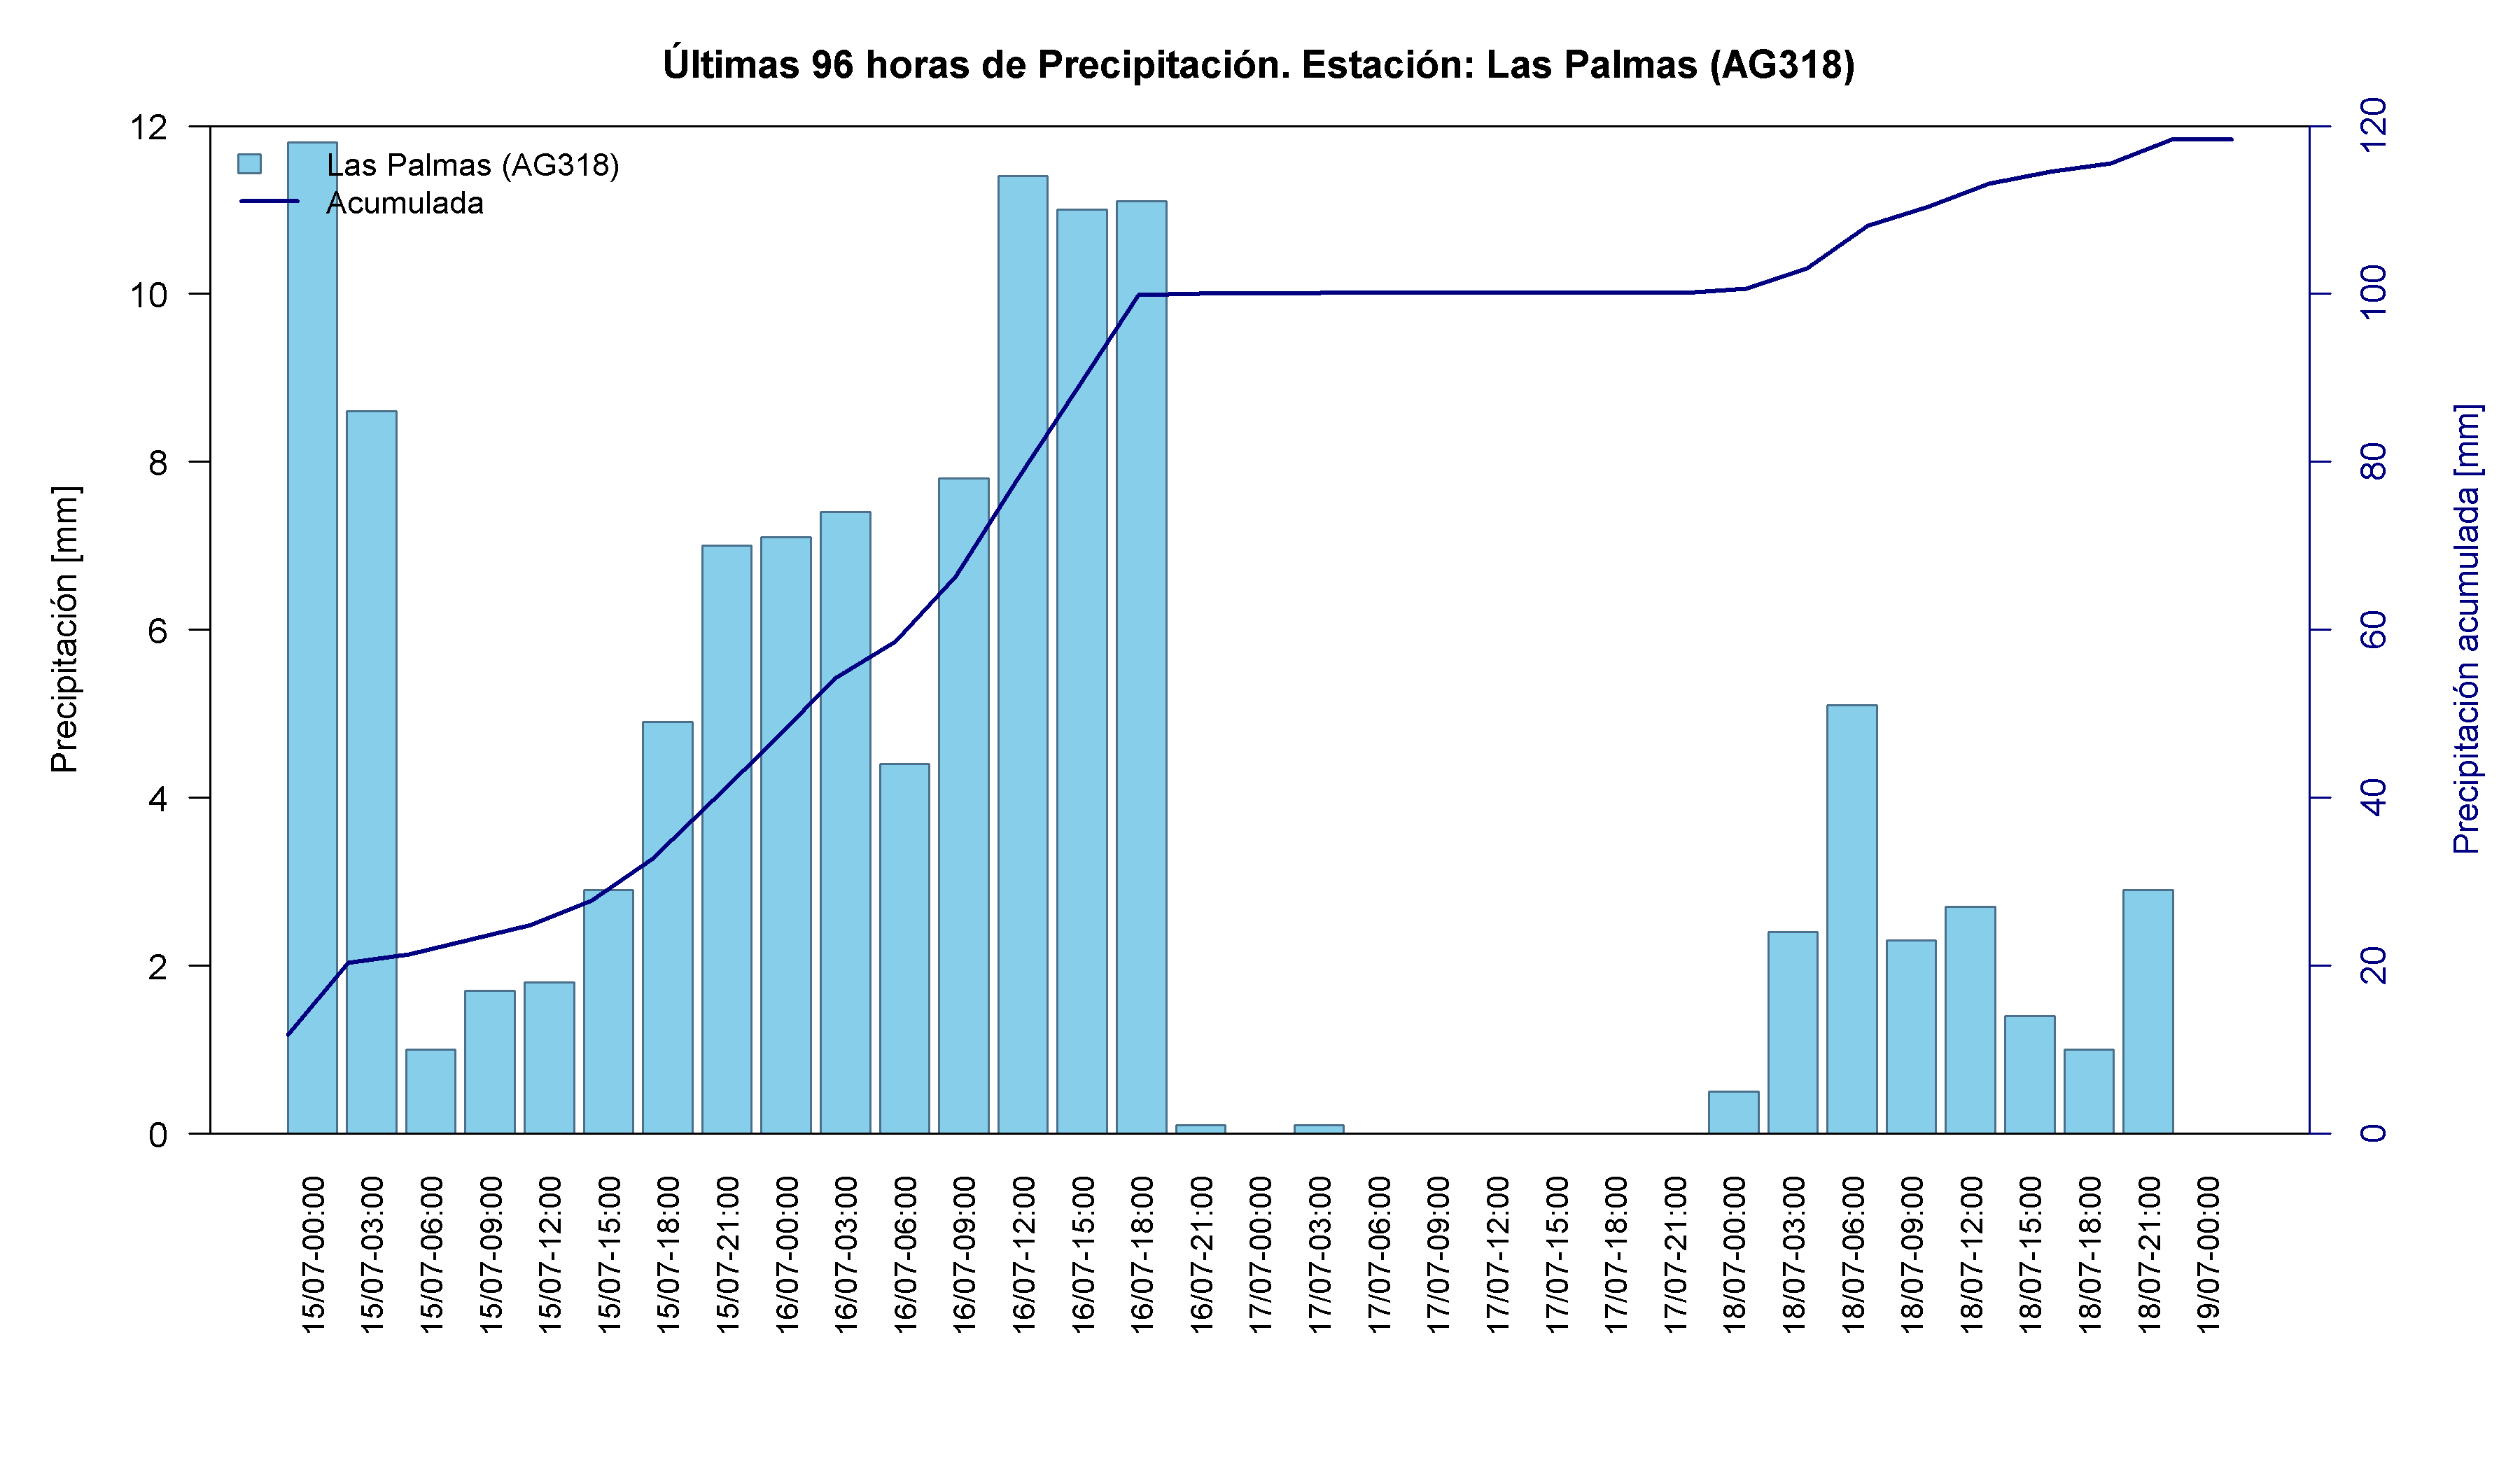
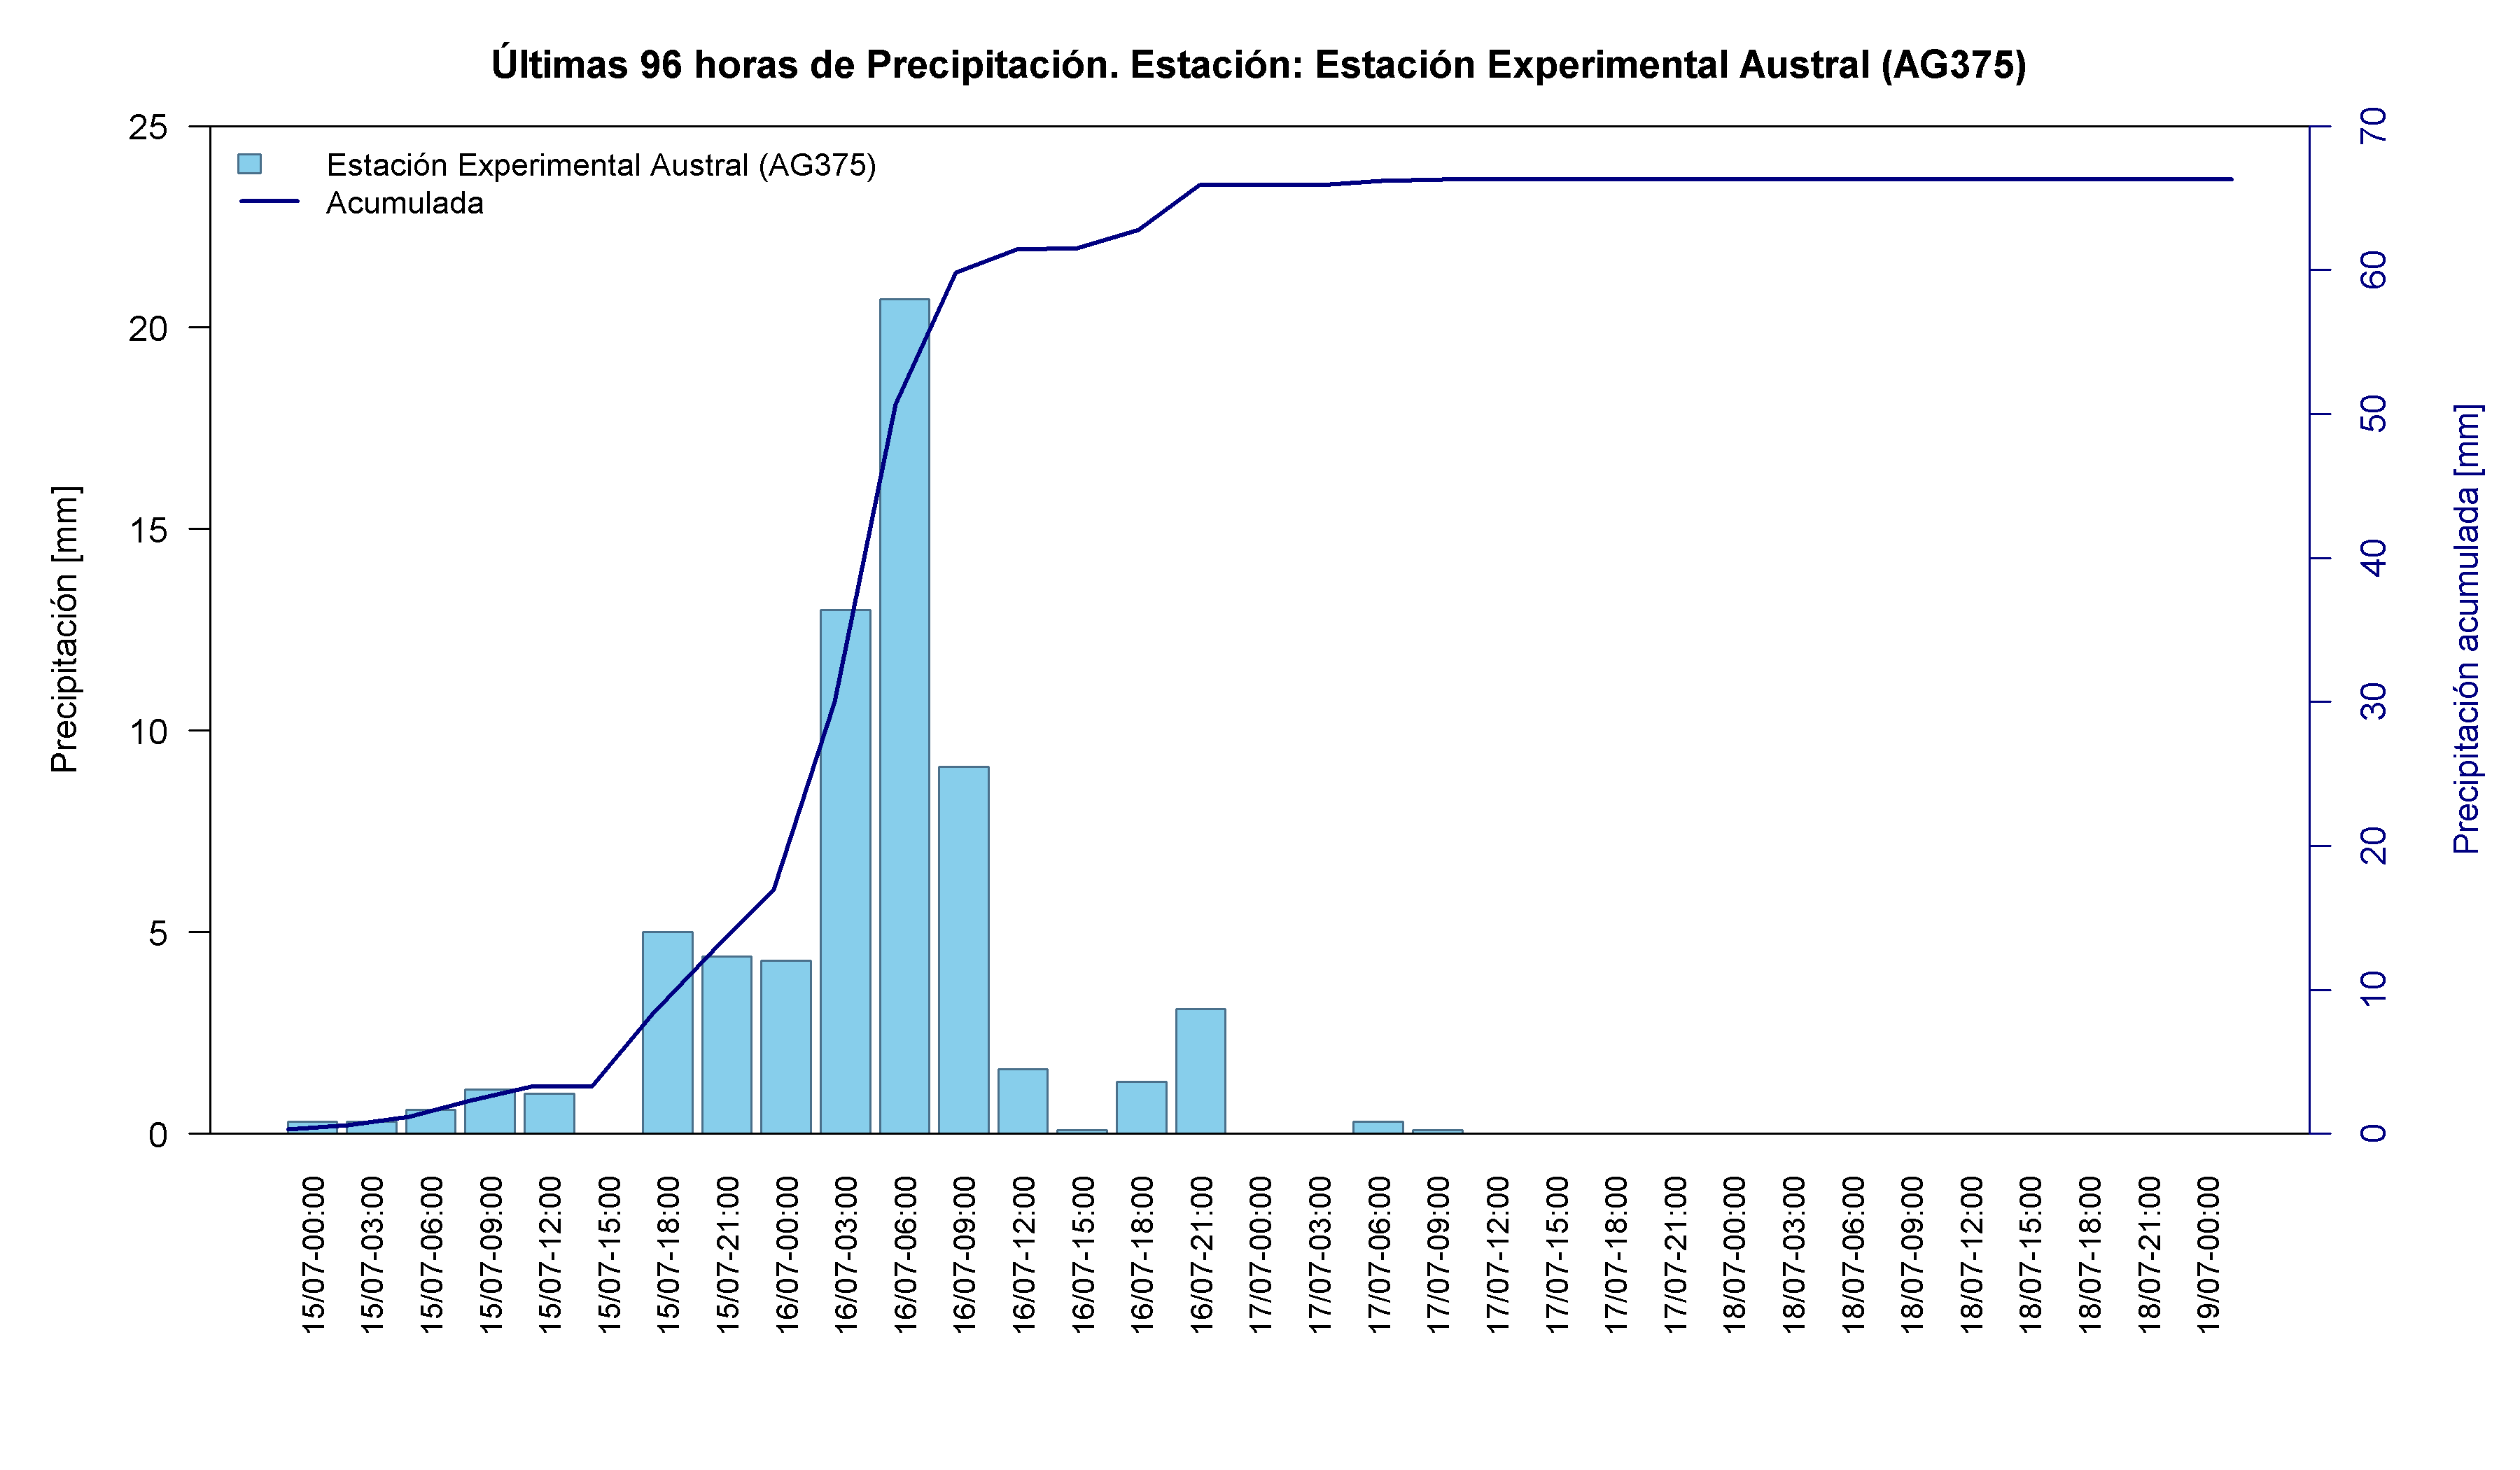
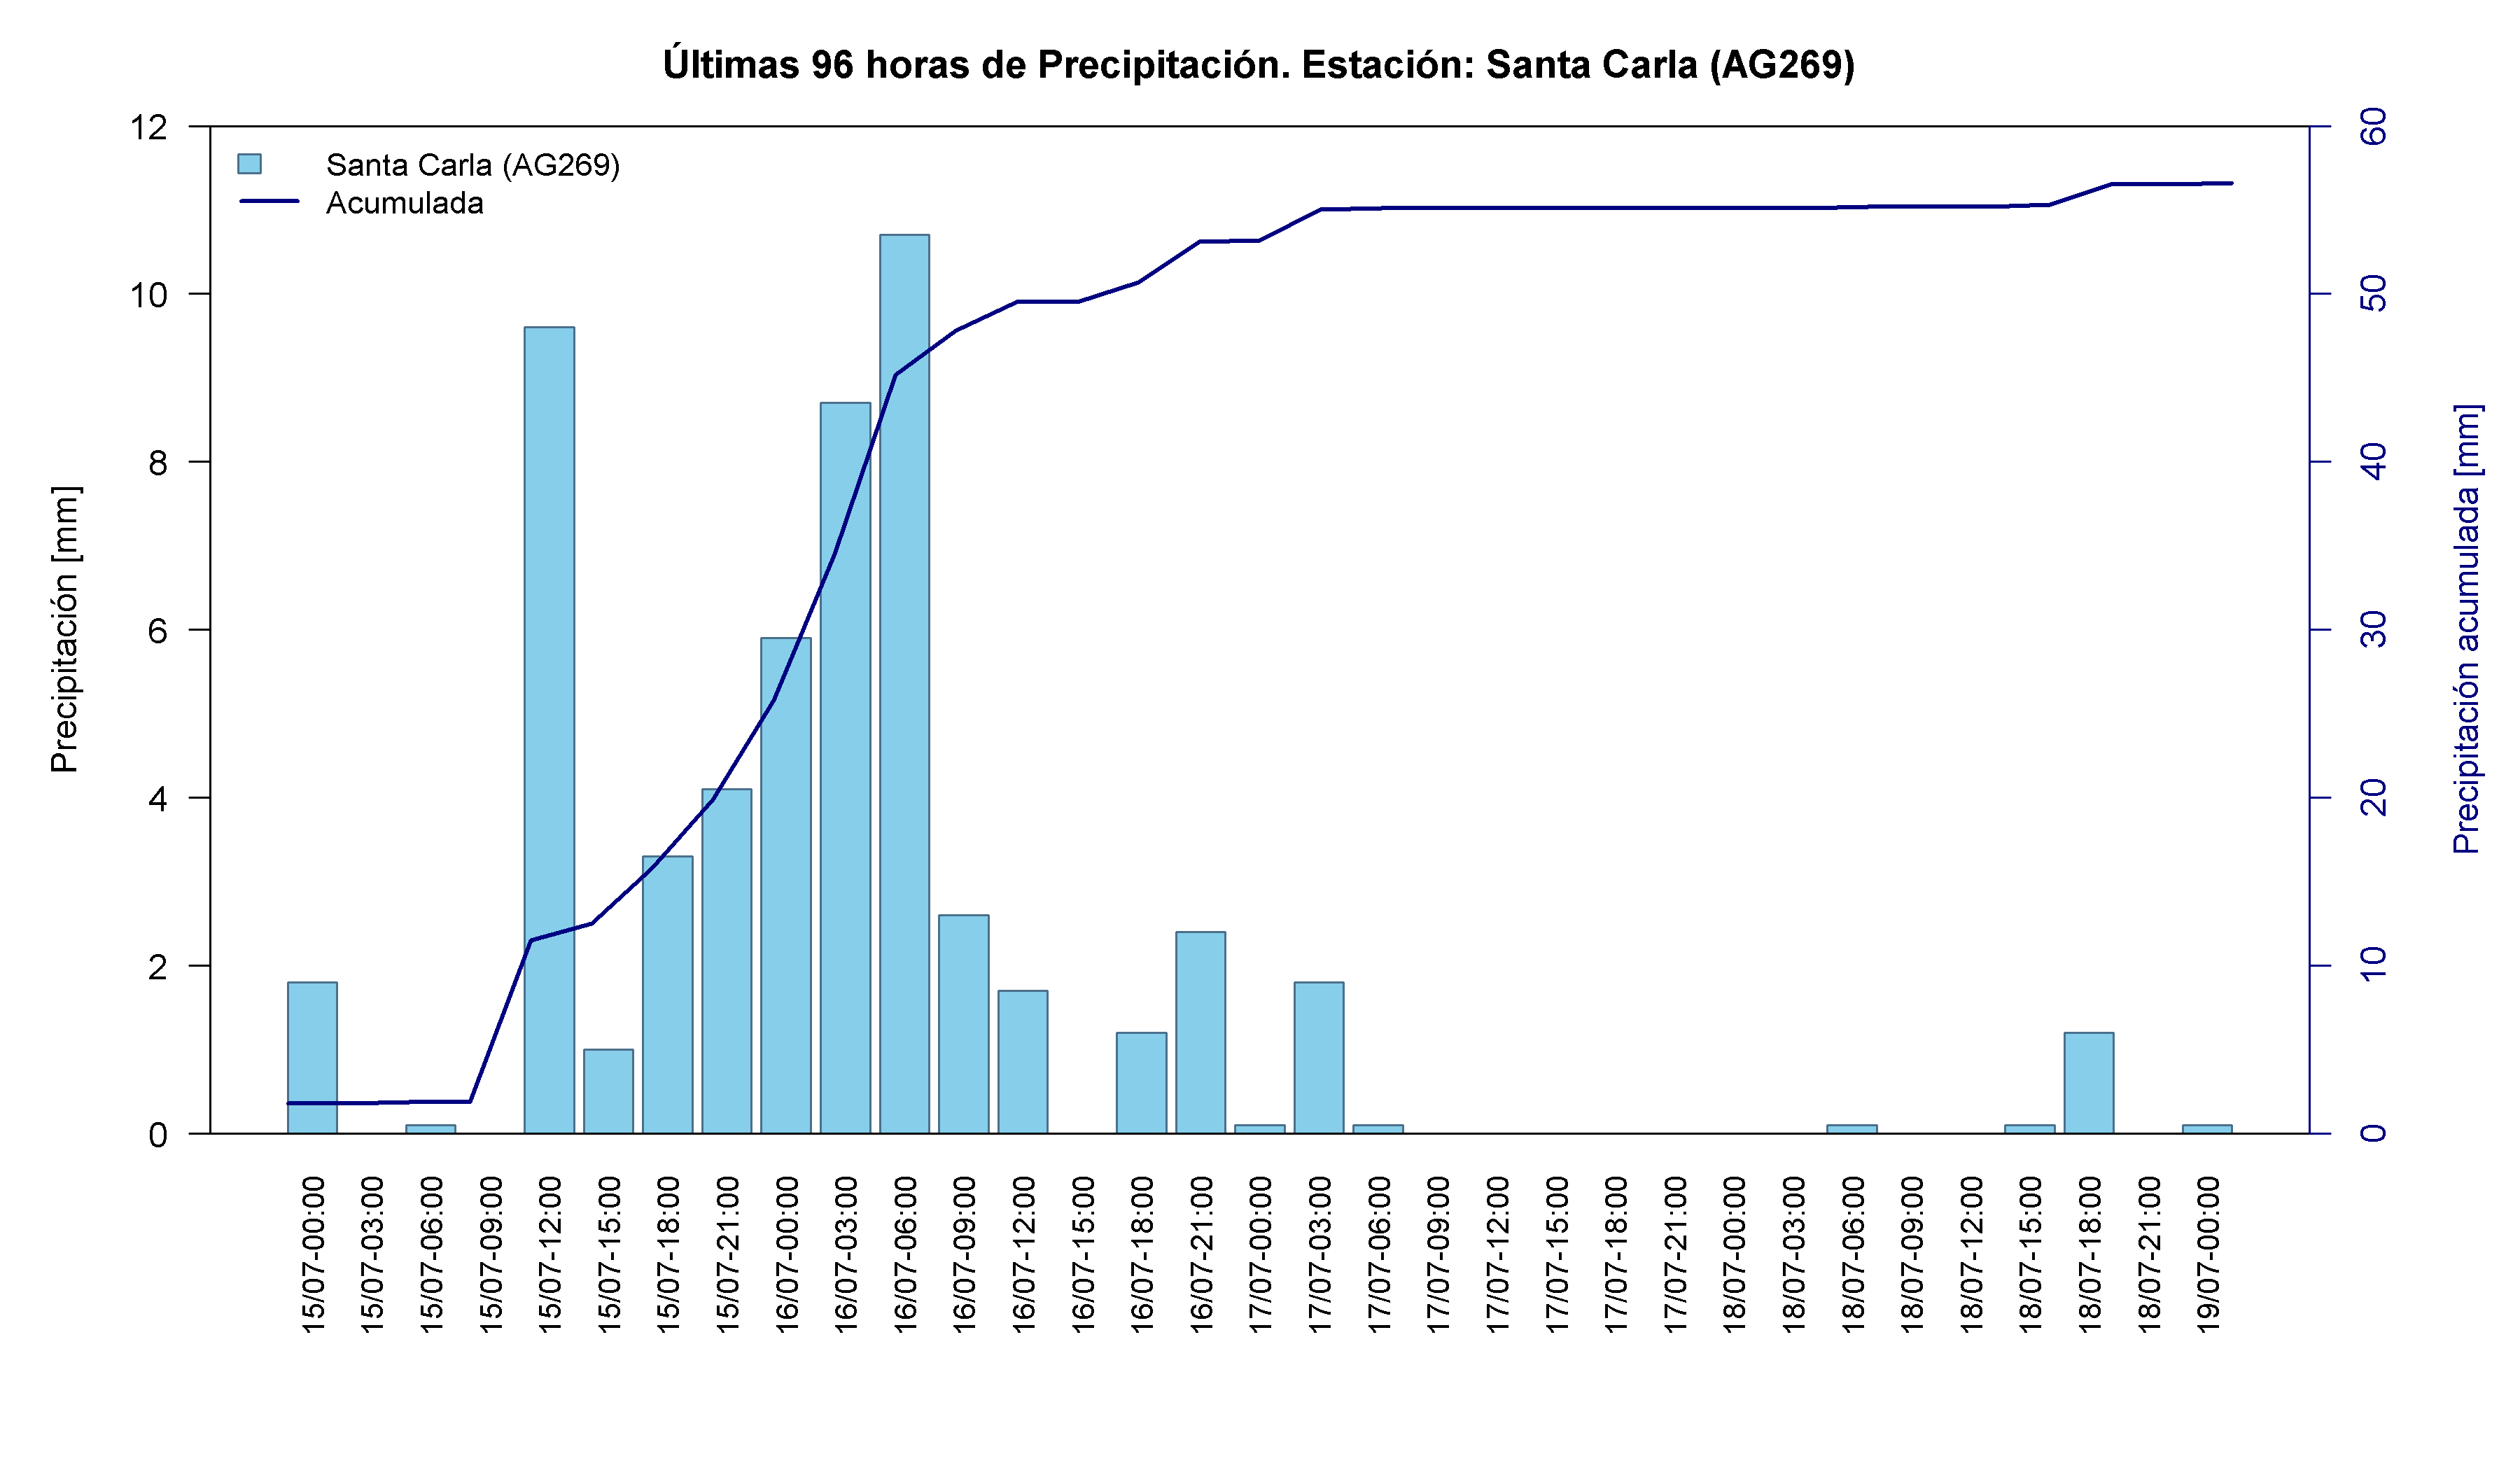
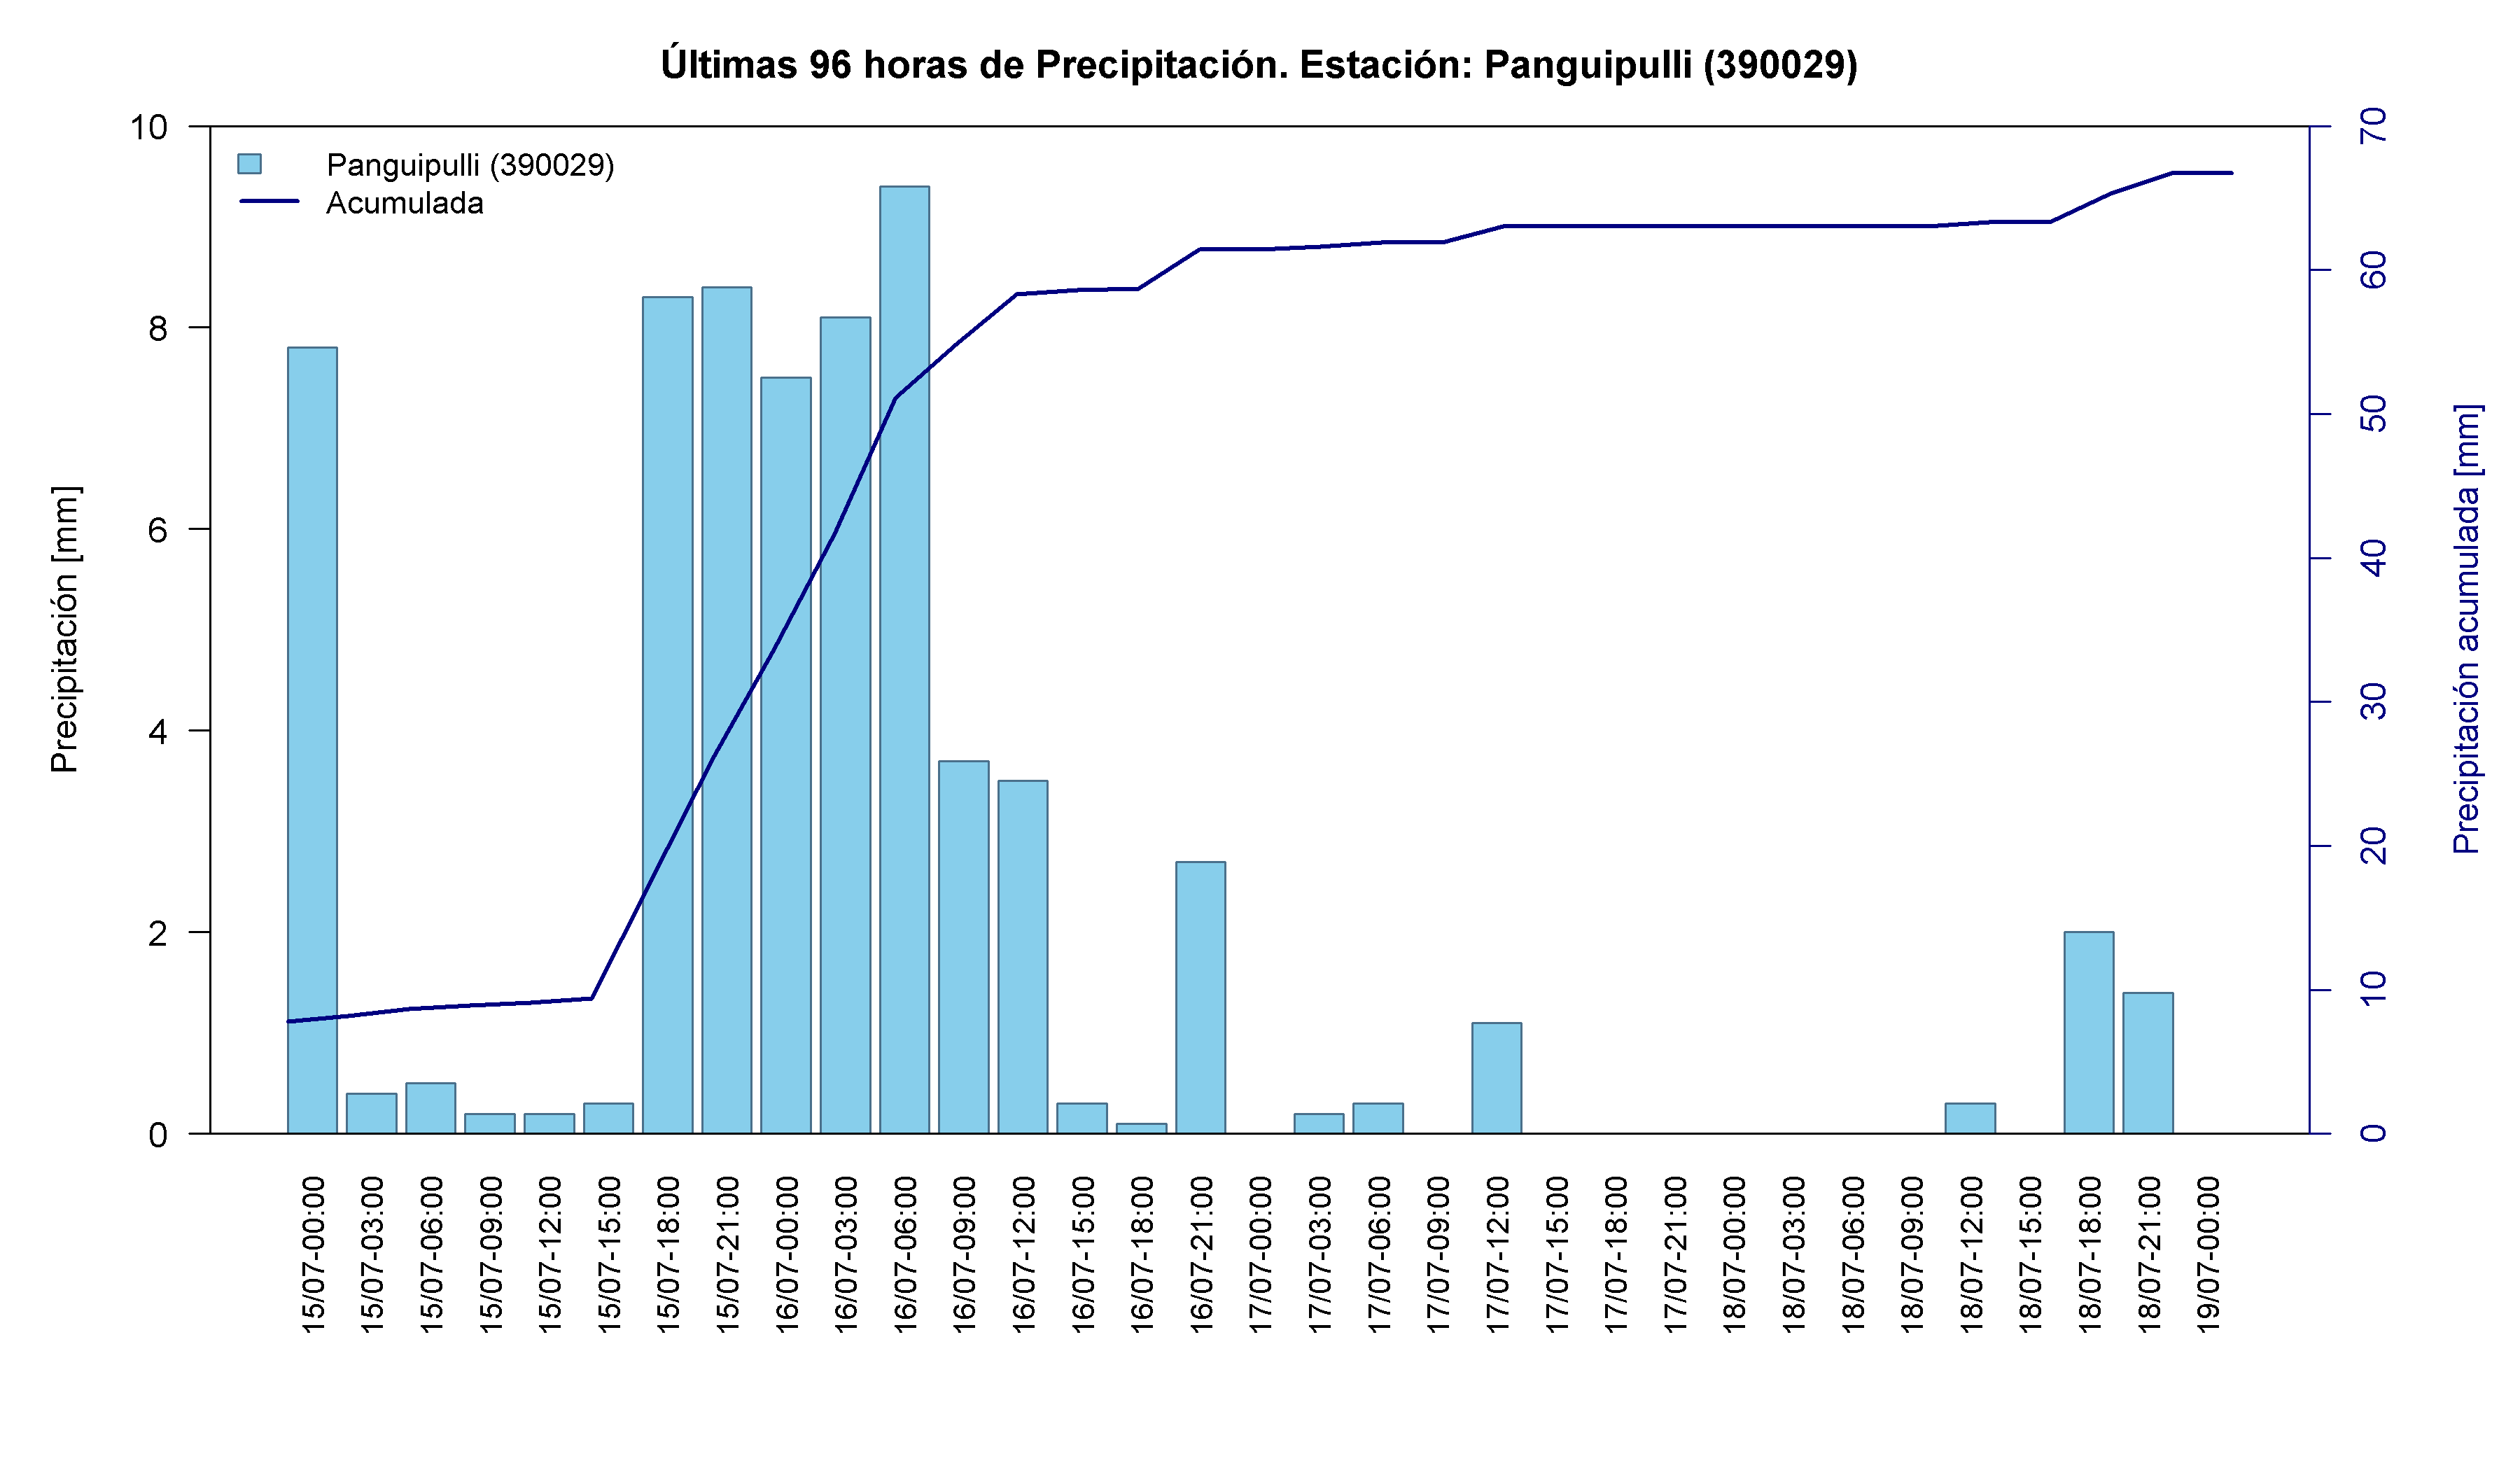
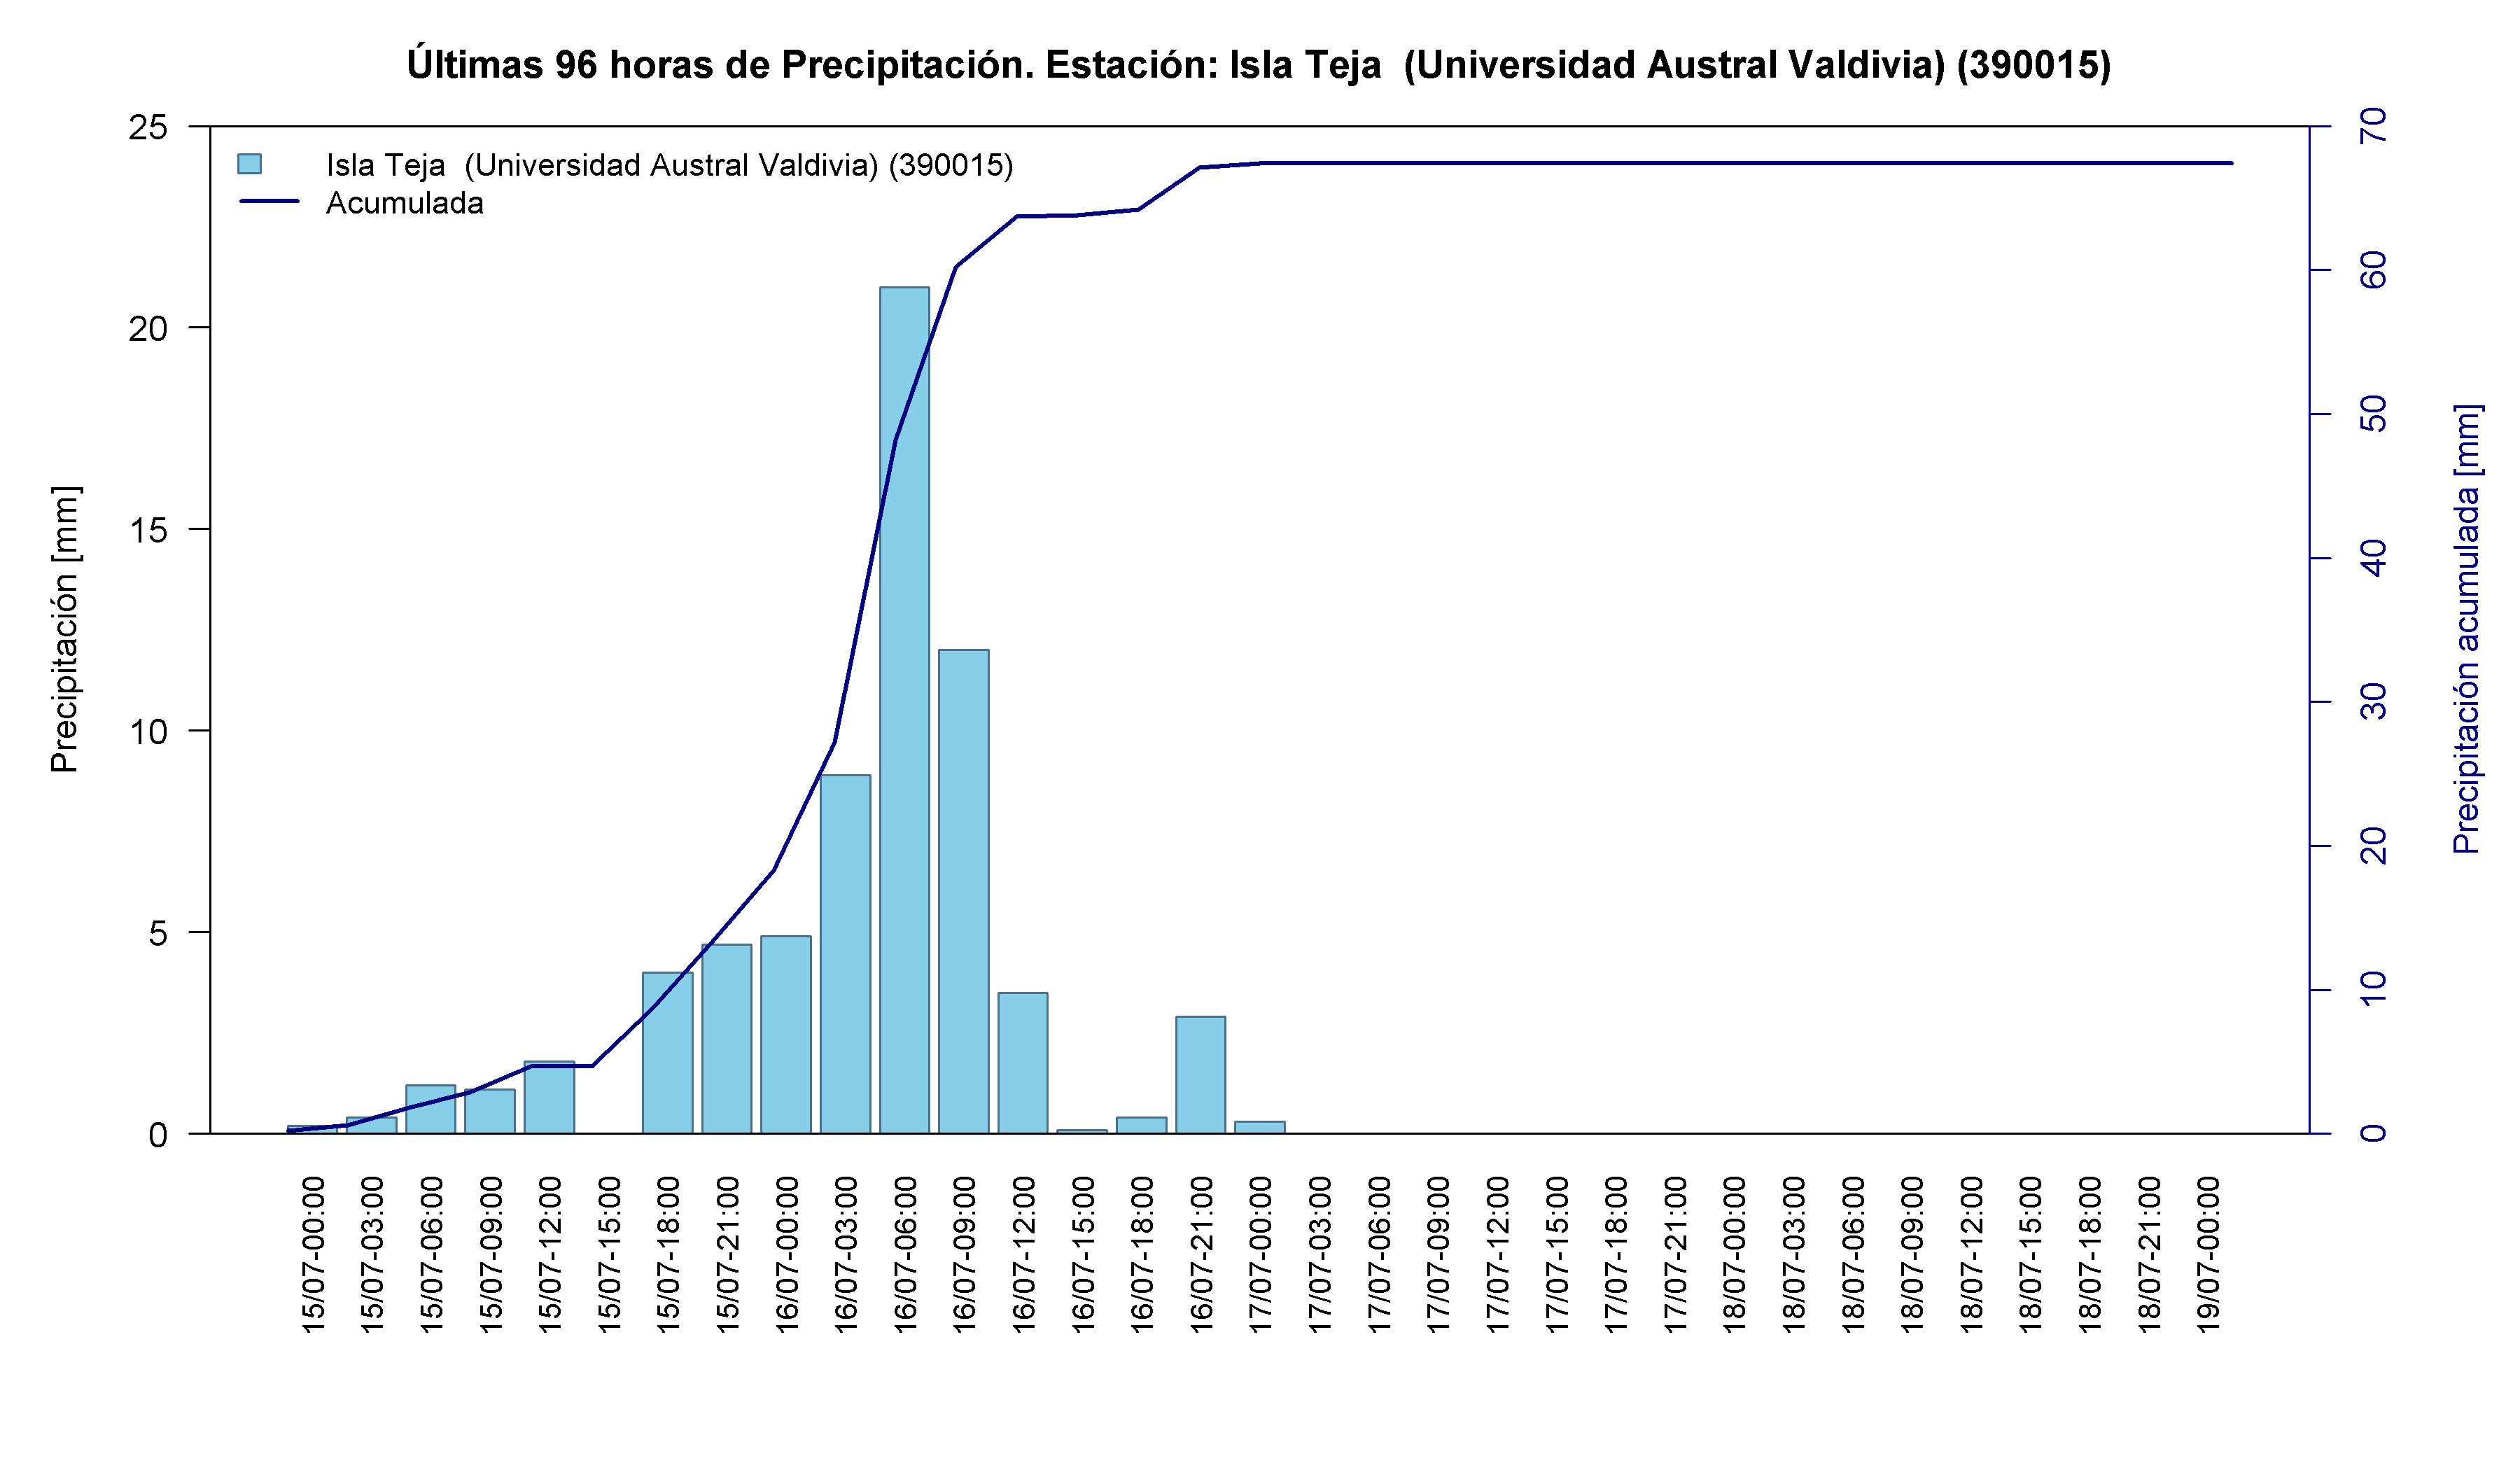
Los Ríos was among the first regions reached by the frontal sequence. The gauges show a weak initial pulse followed by clearer intensification on 16 July. Estación Experimental Austral accumulated 95.3 mm; rainfall activity declined sharply after 17 July.
Time series and interactive elements
Map 10. Location of the rain gauges analysed in the Los Ríos Region during the frontal-system event of 15-19 July 2026. Source: Authors’ analysis based on data from the VisMet meteorological viewer .
Table 10. Accumulated precipitation recorded at rain gauges in the Los Ríos Region between 15 and 19 July 2026. Source: Authors’ analysis based on data from the VisMet meteorological viewer .
Los Lagos Region
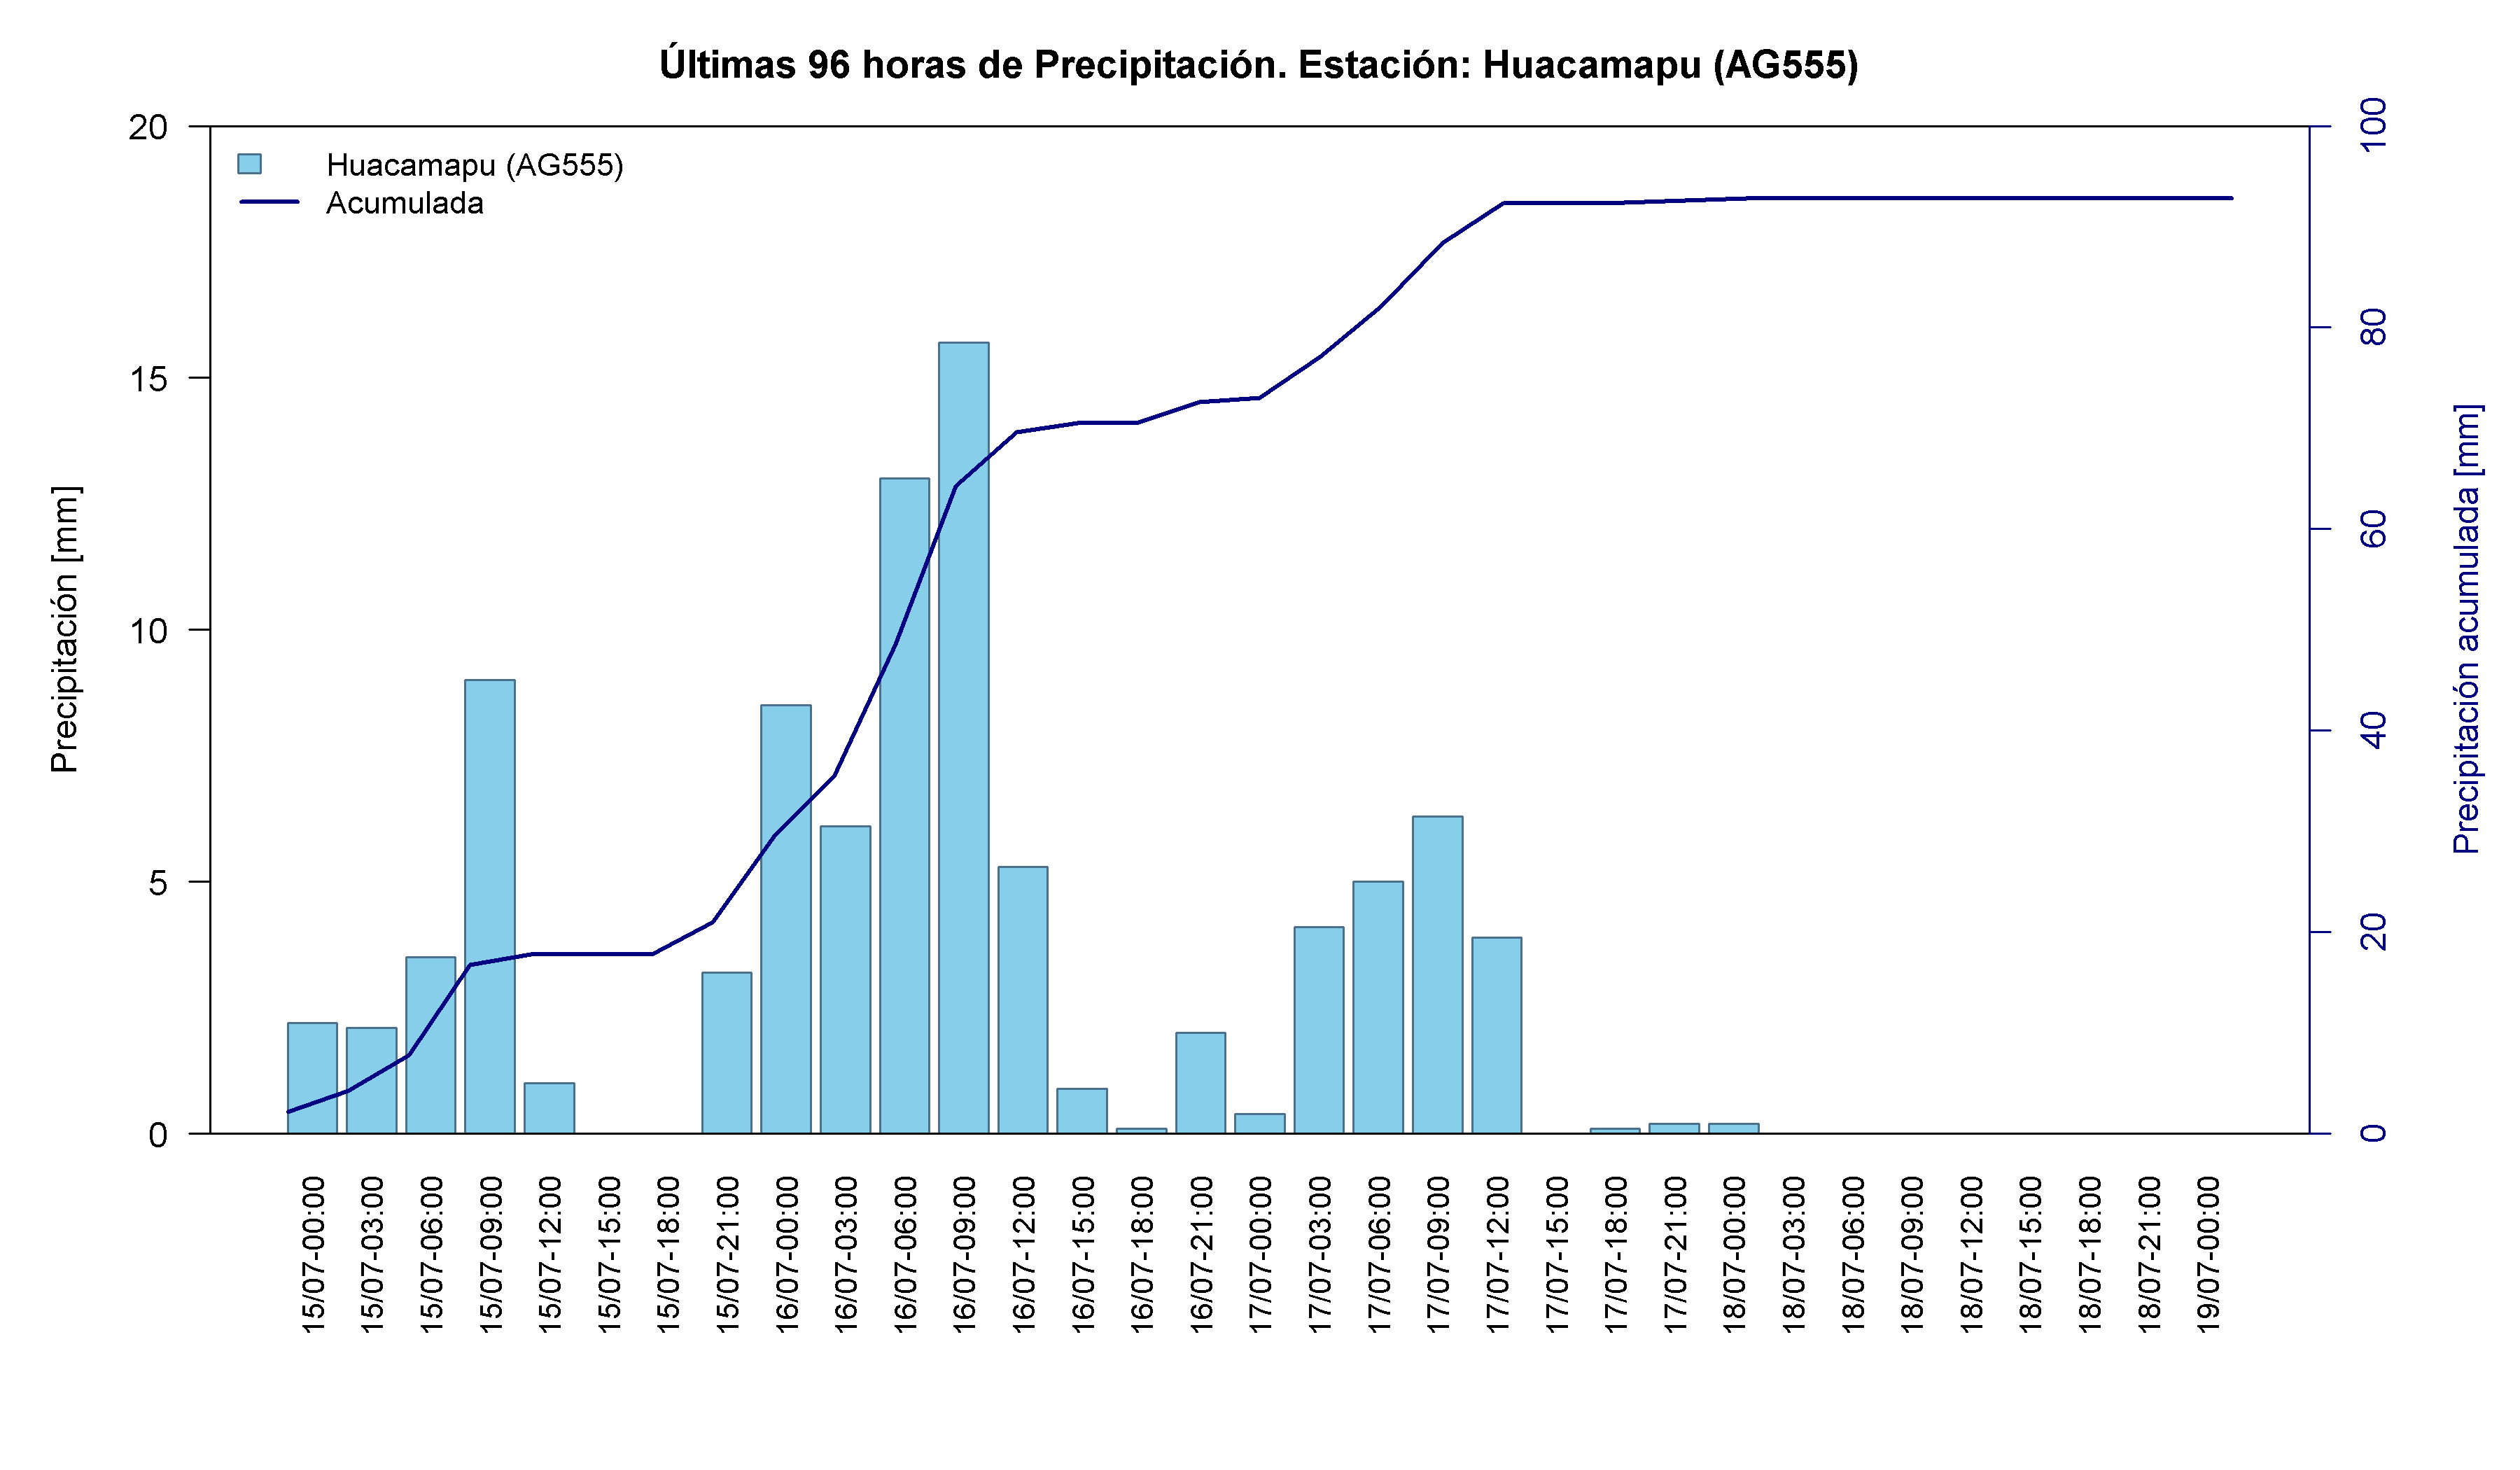
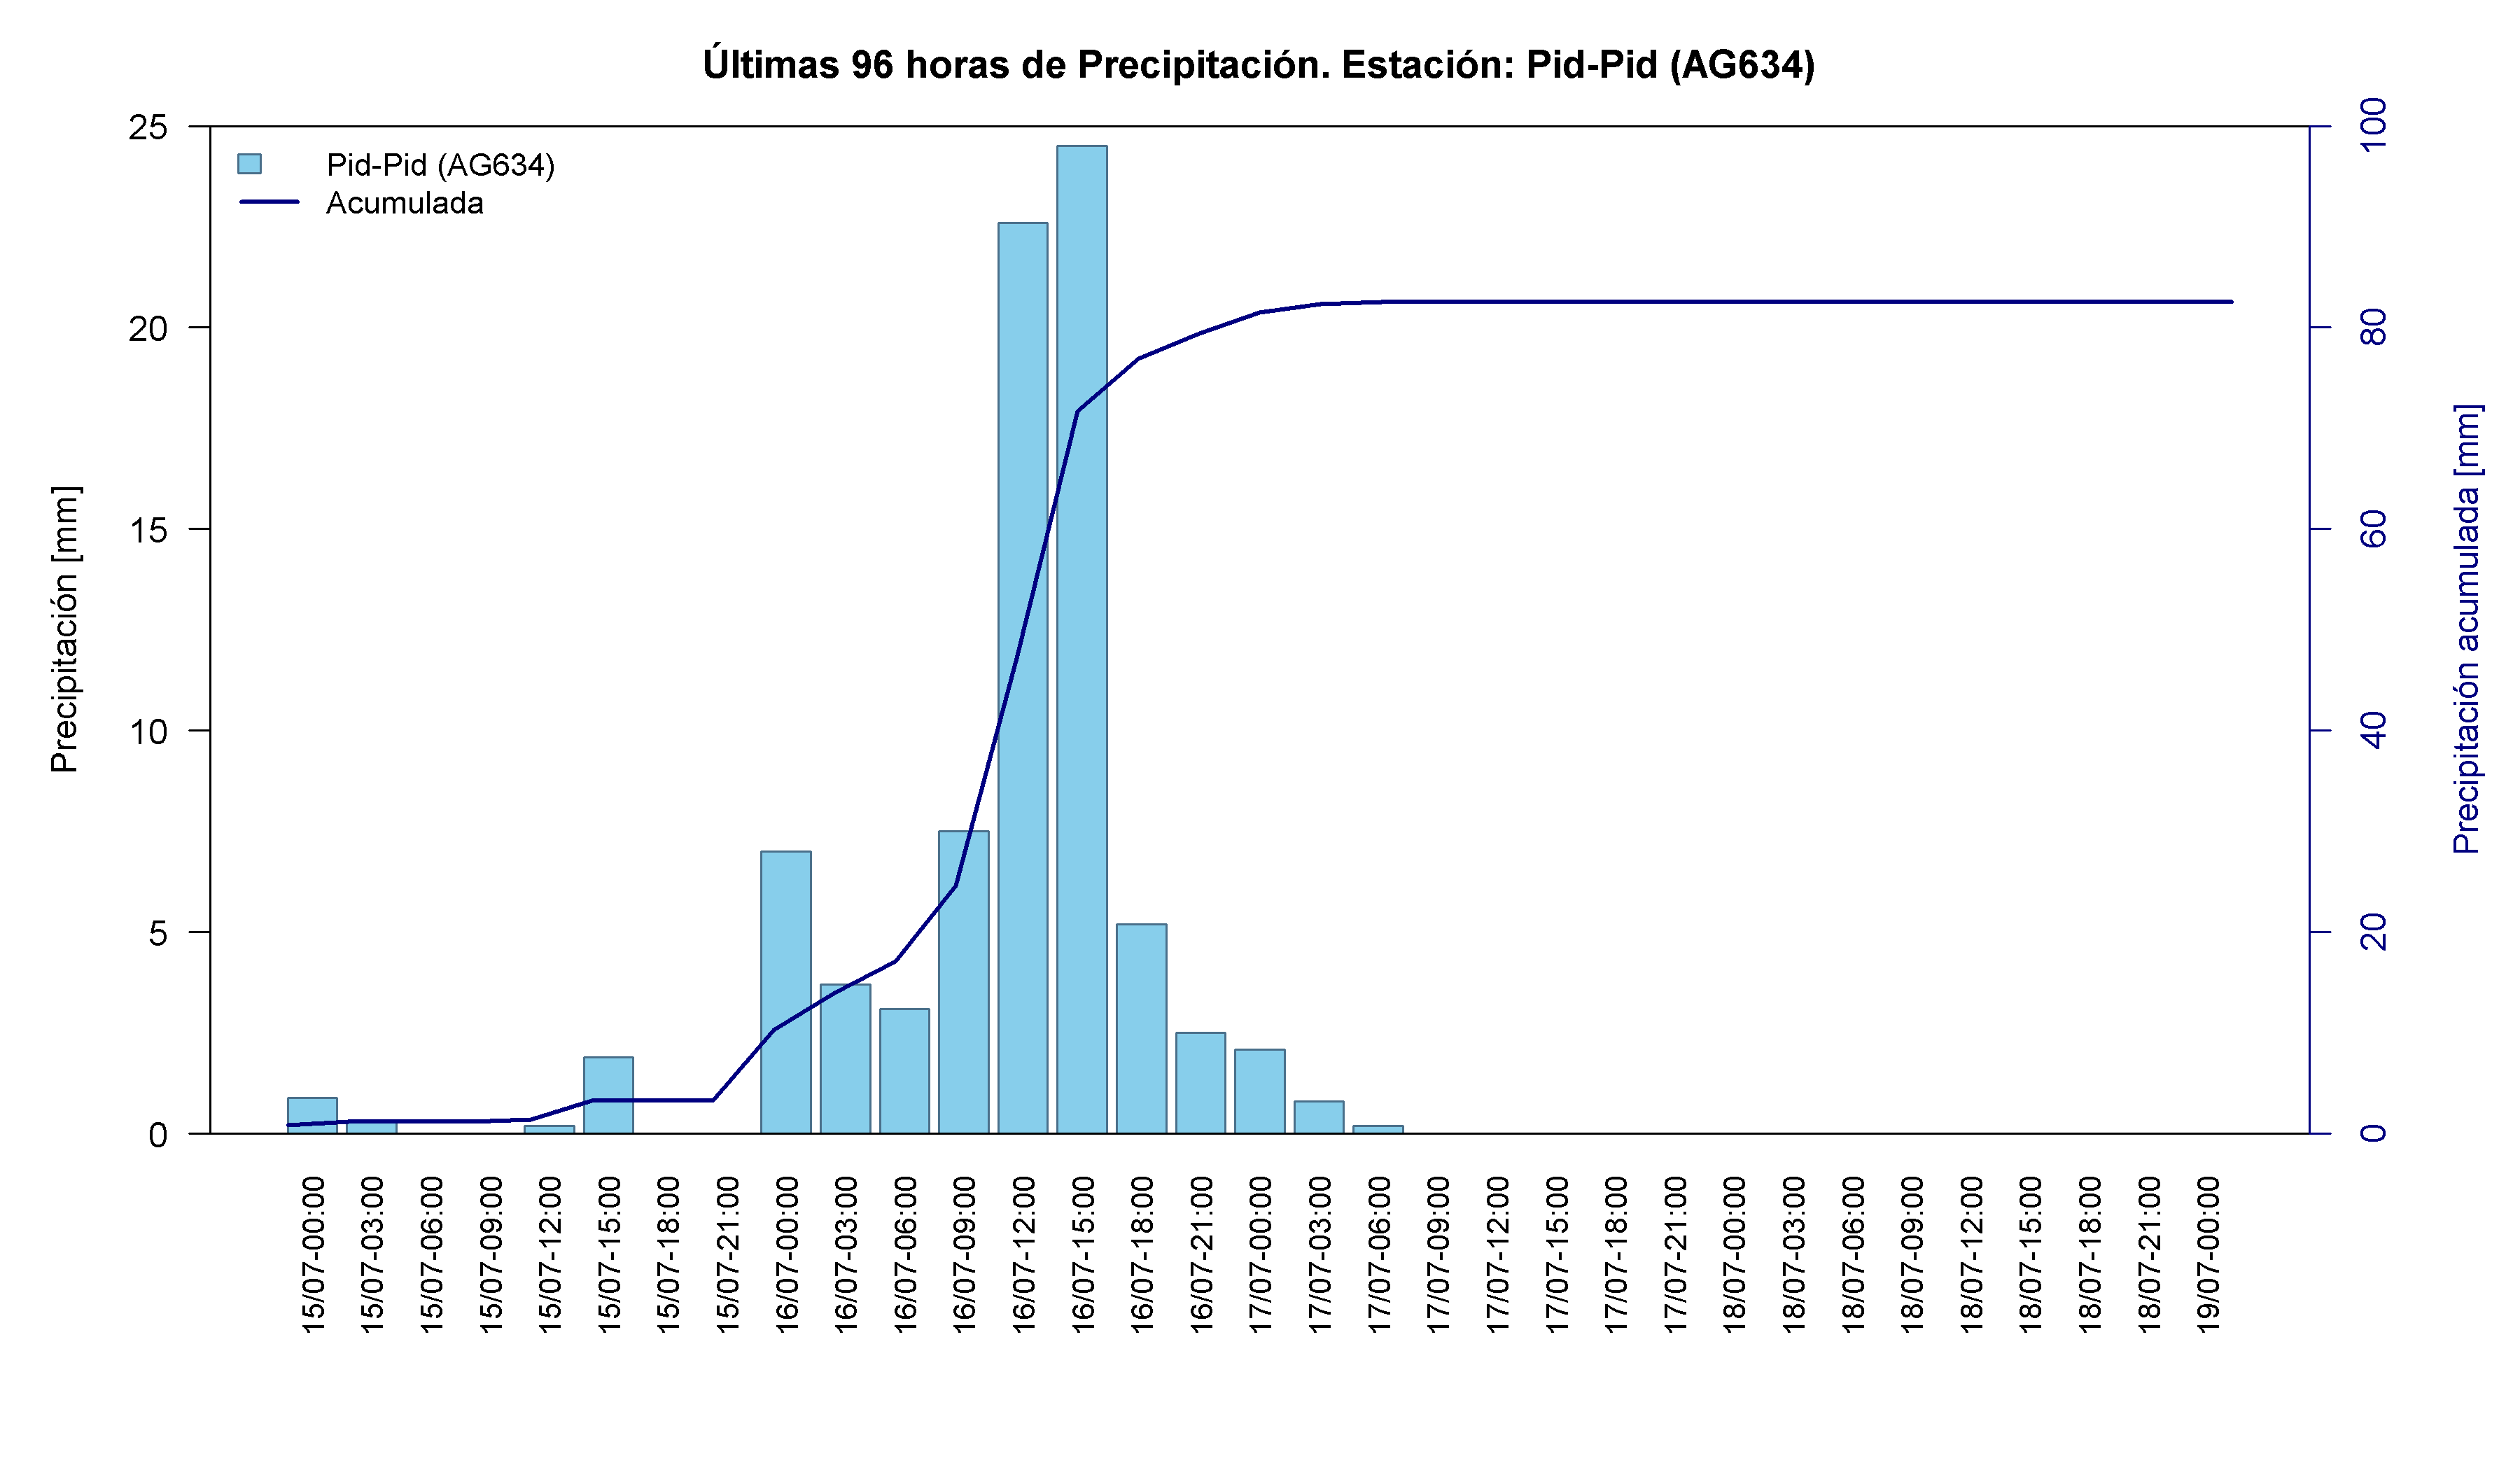
Los Lagos received persistent rainfall, but conditions were less extreme than during the early-July episode. Huacamapu accumulated 104.9 mm and Pid-Pid 82.6 mm, with maxima concentrated on 16 July. The accumulation curves flatten rapidly afterwards, indicating that the event ended relatively early in this region.
Time series and interactive elements
Map 11. Location of the rain gauges analysed in the Los Lagos Region during the frontal-system event of 15-19 July 2026. Source: Authors’ analysis based on data from the VisMet meteorological viewer .
Table 11. Accumulated precipitation recorded at rain gauges in the Los Lagos Region between 15 and 19 July 2026. Source: Authors’ analysis based on data from the VisMet meteorological viewer .
Hydrometeorological synthesis
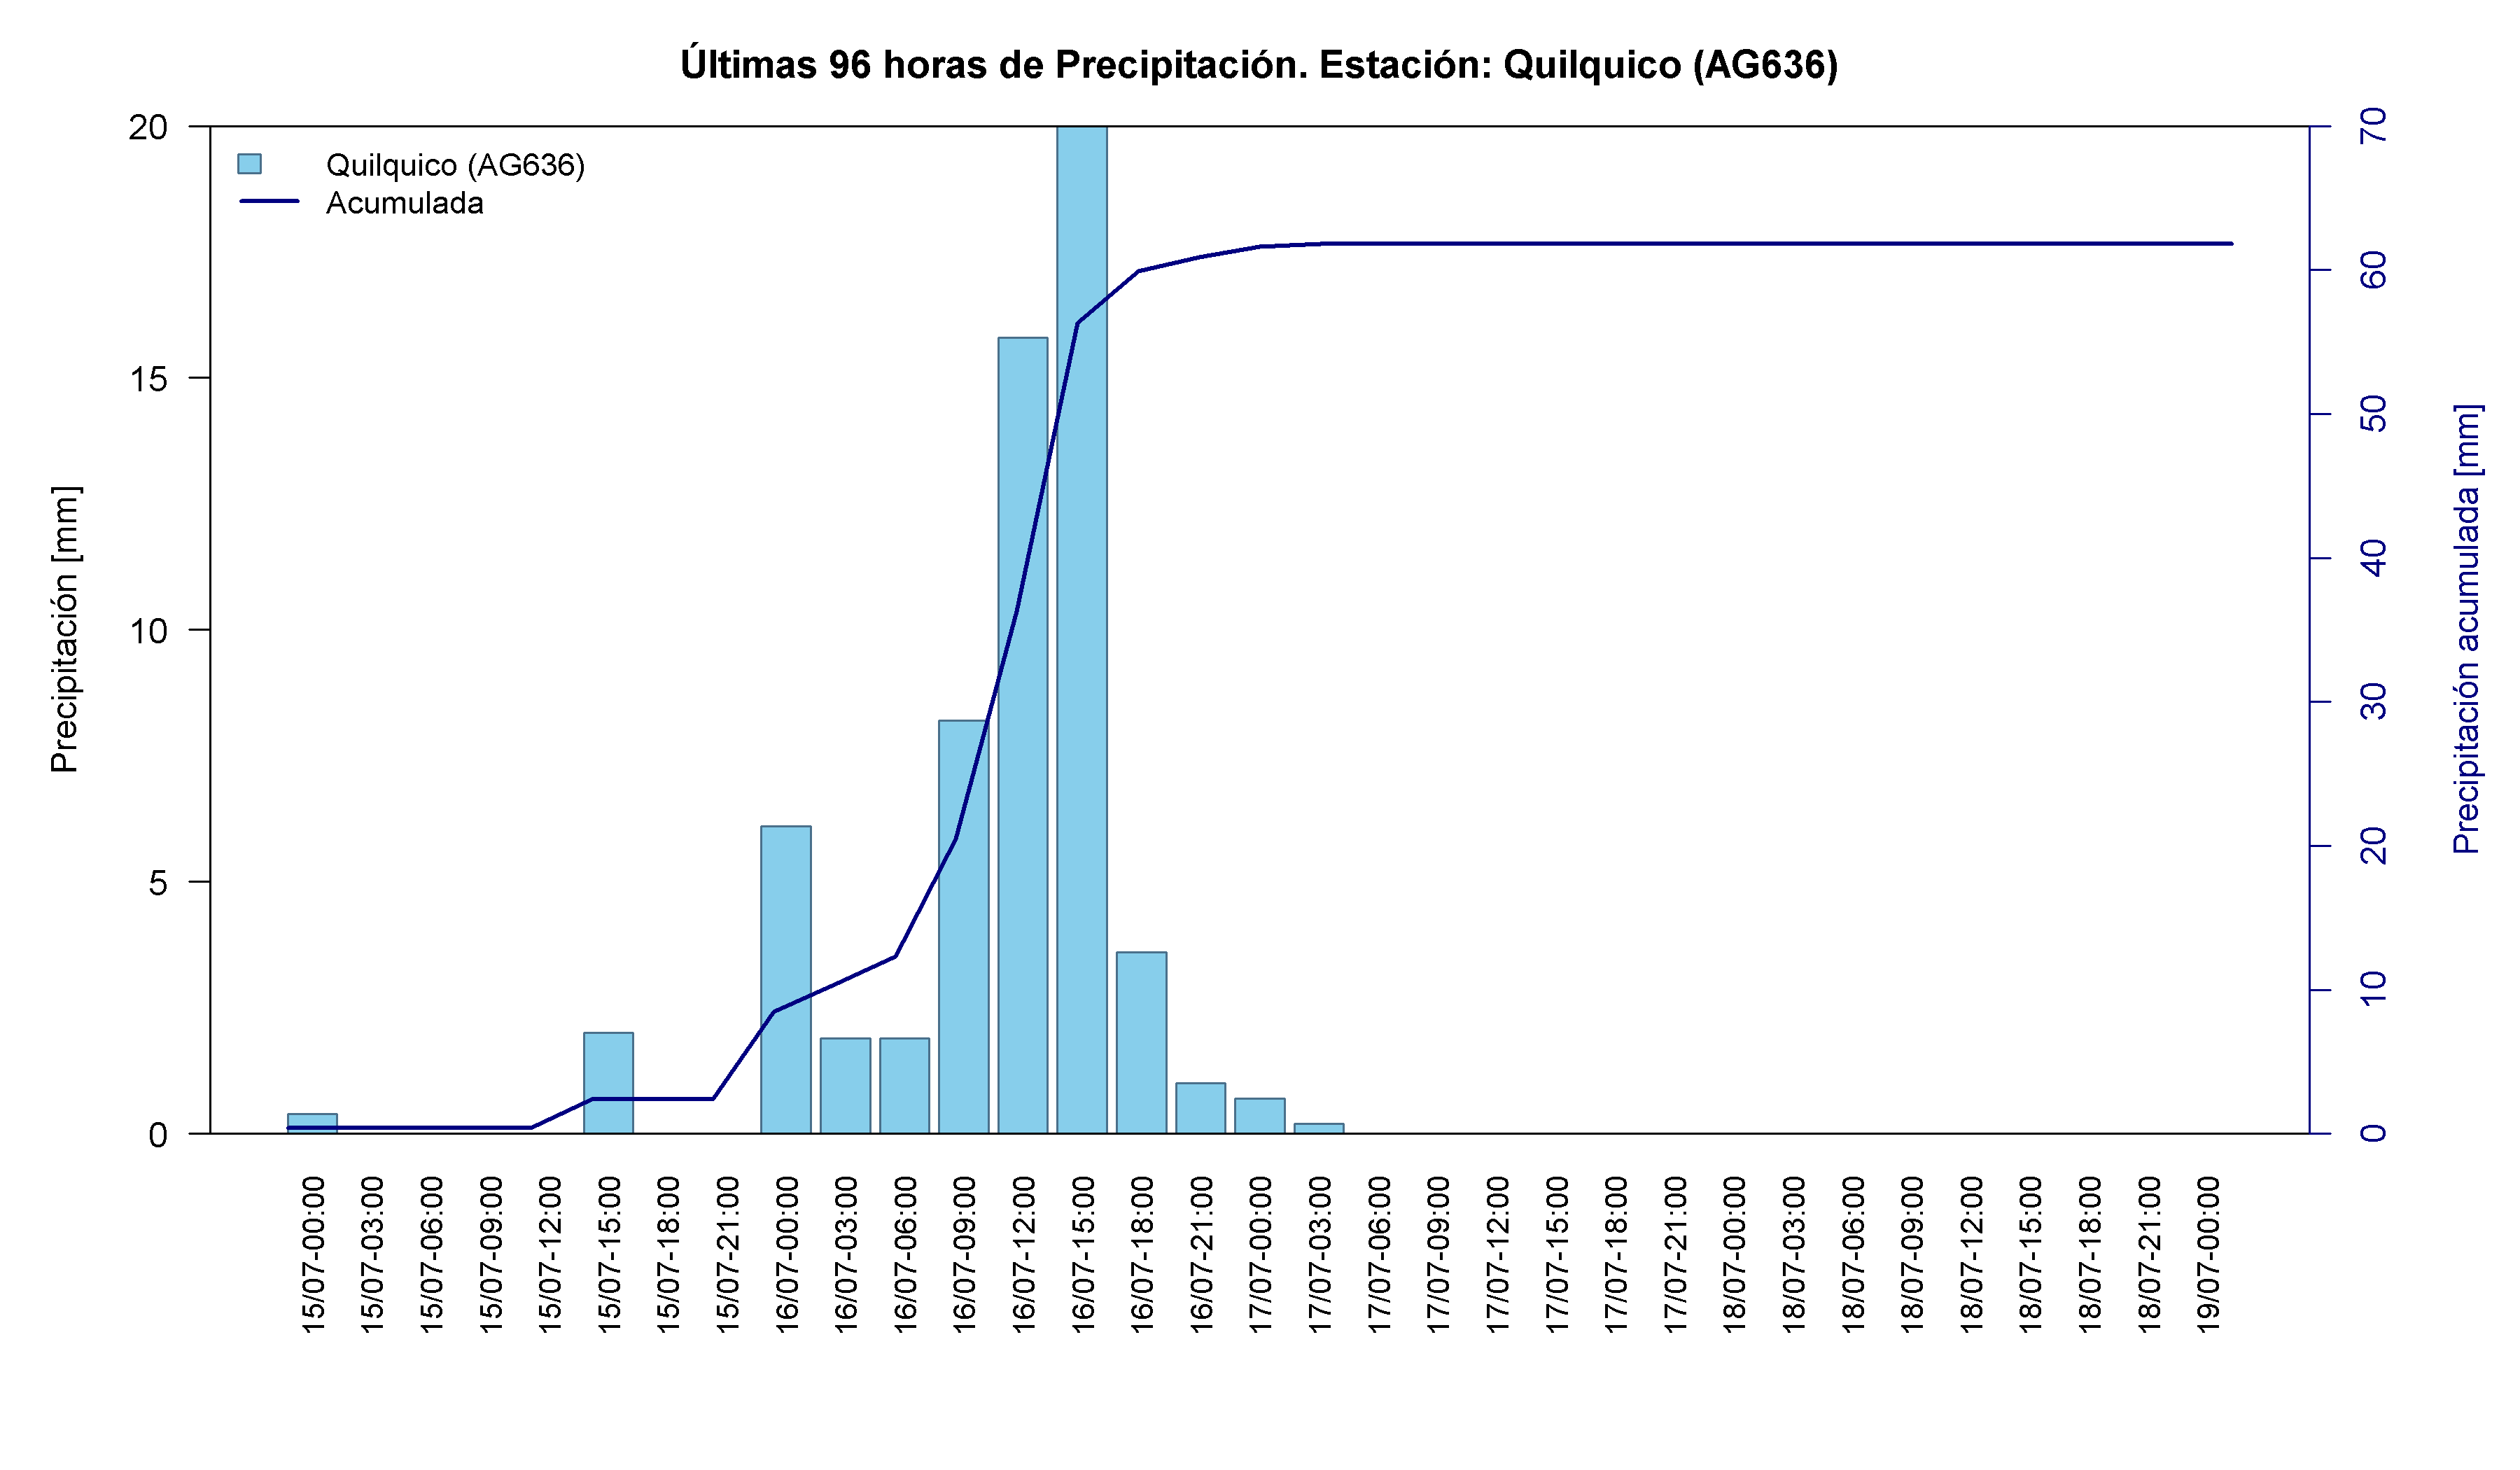
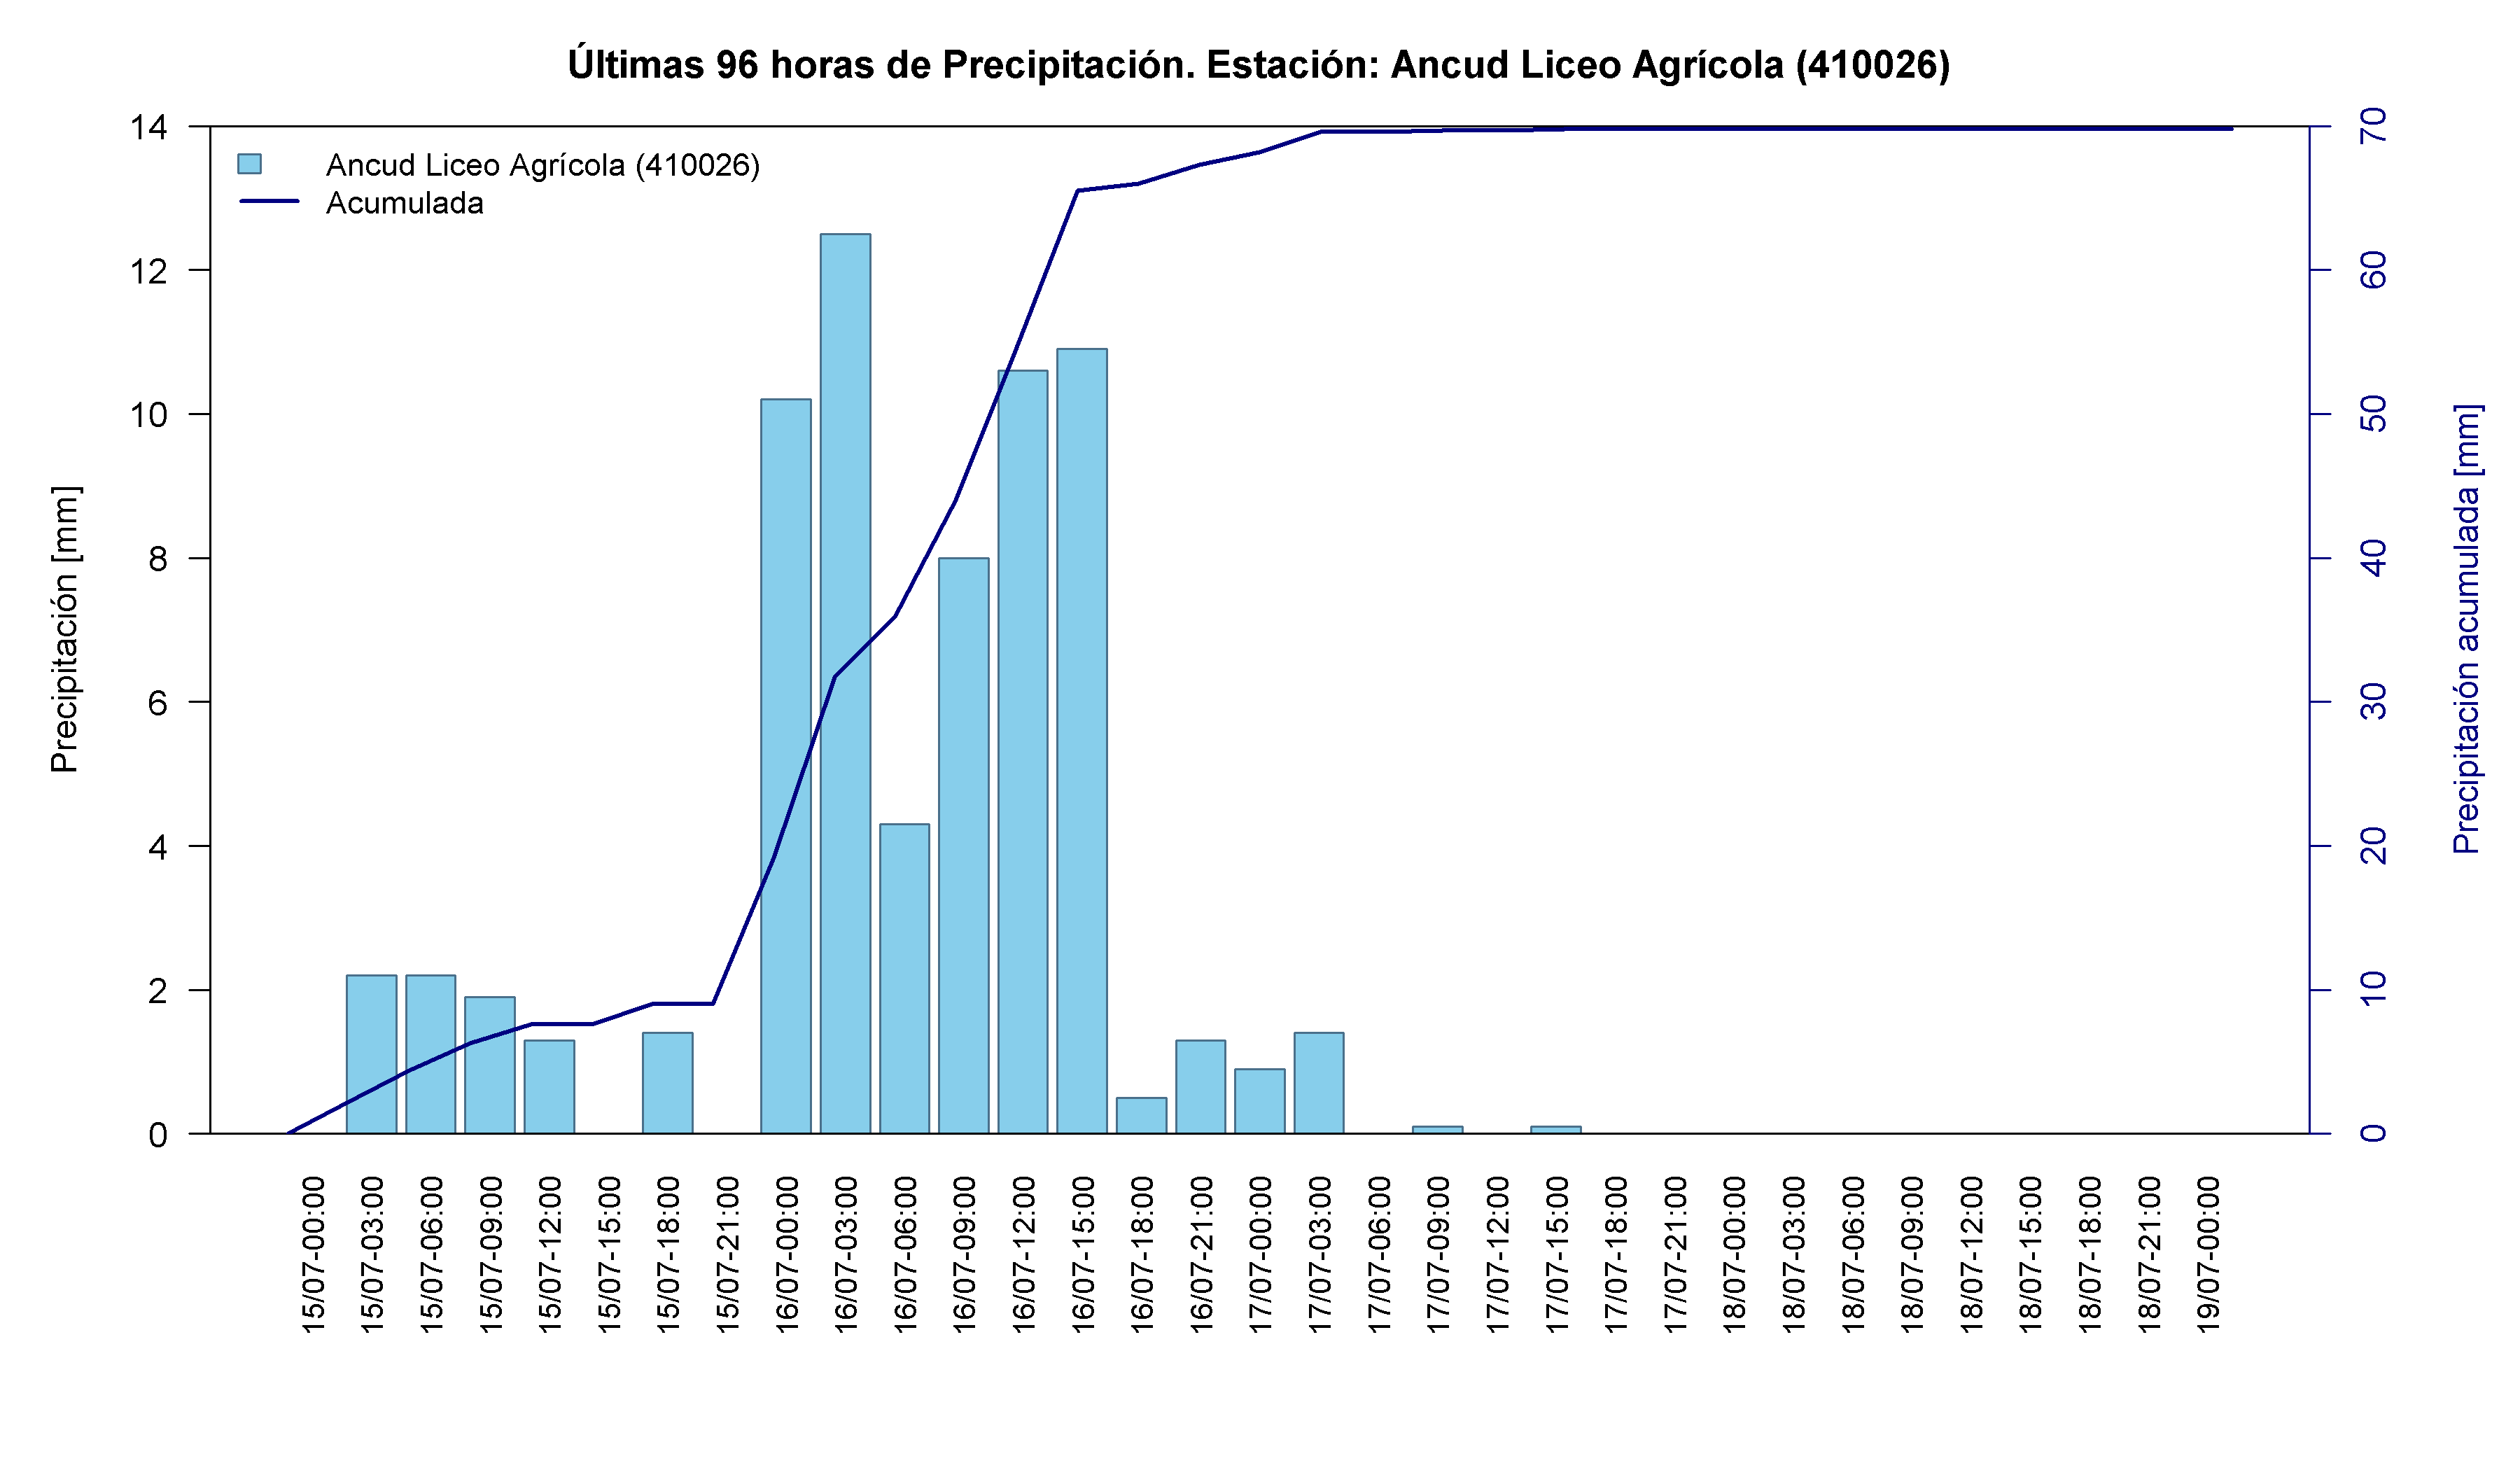
This was not one spatially uniform storm, but a sequence of systems whose rainfall maximum moved broadly from south to north. Los Ríos and Los Lagos reached their largest totals on 16 July; Ñuble, Maule, O’Higgins, Valparaíso and the Santiago Metropolitan Region received much of their rainfall between 15 and 17 July; Coquimbo and Atacama peaked during 18-19 July.
Within the analysed network, San Diego recorded the largest daily total, 217.6 mm on 17 July. Las Cardas and San Diego shared the largest event total, 256.2 mm. These values represent individual gauges and should not be extrapolated automatically to an entire region. Rainfall was highly heterogeneous, particularly across complex terrain.
The regional comparison also shows that similar totals can produce different responses. Two hundred millimetres falling within 24 hours does not have the same implications as the same amount distributed over three days. Intensity, antecedent moisture, topography, land use, drainage capacity and population exposure jointly determine the resulting impacts.
Implications for risk management
The event reinforces four priorities for hydrometeorological risk management:
- Warning systems should combine intensity, duration and antecedent wetness rather than relying only on forecast event totals.
- Small catchments and ephemeral channels require direct monitoring because they can respond rapidly before major rivers reach extreme levels.
- Electricity, communications, roads and drinking-water systems need operational redundancy because cascading failures can extend the emergency after rainfall has ended.
- Public communication should state uncertainty and timestamp every update, particularly during events whose main impact area shifts between regions.
Operational guidance remains to follow official information from Senapred, the Chilean Meteorological Directorate, Sernageomin, the General Water Directorate and municipalities; avoid rivers, ephemeral channels and flooded roads; and stay away from active landslides or structurally damaged areas.
Frequently asked questions
Why is this described as a nationwide event if rainfall intensity differed among regions?
Because the sequence affected a very large part of continental Chile, although the maximum shifted over time. Southern, central and Norte Chico regions experienced different phases of the same synoptic period.
What was the largest observation in the analysed network?
San Diego recorded 217.6 mm in one day. San Diego and Las Cardas each accumulated 256.2 mm over the full period. These are point-gauge values, not regional averages.
Why can persistent rainfall be as damaging as a short extreme burst?
Persistent rainfall progressively reduces soil infiltration and storage capacity. When a new pulse arrives, a larger fraction of the precipitation may be converted rapidly into runoff.
What evidence is still needed to quantify the event’s rarity?
A robust assessment requires quality-controlled, homogeneous historical series; frequency analysis across several durations; spatial rainfall estimates; and a joint evaluation of precipitation, streamflow, soil moisture and observed damage.
[7]: Datos de precipitación: Visualizador Meteorológico (VisMet)